
By InvestMacro | COT | Data Tables | COT Leaders | Downloads | COT Newsletter
Here are the latest charts and statistics for the Commitment of Traders (COT) data published by the Commodities Futures Trading Commission (CFTC).
The latest COT data is updated through Tuesday July 26th and shows a quick view of how large traders (for-profit speculators and commercial entities) were positioned in the futures markets.
Weekly Speculator Changes: Week 30
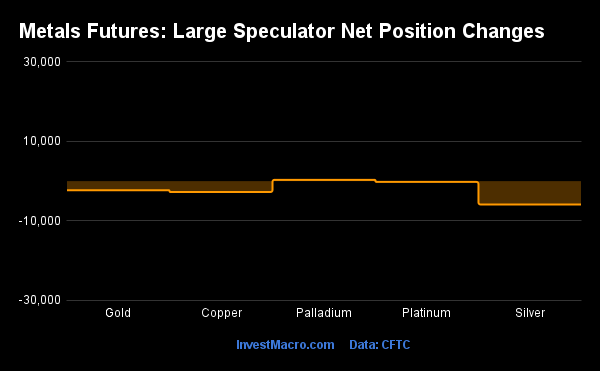
COT precious metals speculator bets were lower again this week as just one out of the five metals markets we cover had higher positioning this week while the other four markets had lower contracts.
The only precious metals market to see higher speculator bets this week was Palladium with a gain of 343 contracts.
Free Reports:
 Download Our Metatrader 4 Indicators – Put Our Free MetaTrader 4 Custom Indicators on your charts when you join our Weekly Newsletter
 Get our Weekly Commitment of Traders Reports - See where the biggest traders (Hedge Funds and Commercial Hedgers) are positioned in the futures markets on a weekly basis.
The metals leading the declines in speculator bets this week were Silver (-5,860 contracts) and Copper (-2,726 contracts) with Gold (-2,265 contracts) and Platinum (-186 contracts) also showing lower bets on the week.
Highlighting the metals COT data this week was the continued drop in speculator bets for the Silver contracts. Silver speculative bets have now fallen for seven consecutive weeks (a total decline of -21,904 contracts over that period) and for a whopping thirteen out of the past fourteen weeks (a total decline of -50,929 contracts over 14 weeks). This speculator sentiment weakness has now brought the overall net position into bearish territory (-4,500 contracts this week) for the first time since June 4th of 2019, a span of 164 weeks. The Silver position has only seen approximately 30 weeks in bearish territory over the past ten years with a seventeen-week streak of bearish positions in 2018 dominating this data. These negative net positions for Silver are rare and usually only persist for a short time so it will be interesting to see if this is some type of bottom for Silver speculators or if this will continue. The Silver futures price did get a boost this week and rose back over the $20 level ($18.54 weekly open vs $20.19 close) after hitting two-year lows recently just above the $18.00 price level.
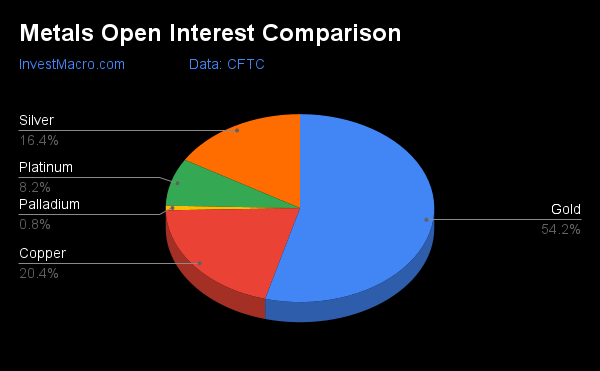
| Jul-26-2022 | OI | OI-Index | Spec-Net | Spec-Index | Com-Net | COM-Index | Smalls-Net | Smalls-Index |
|---|---|---|---|---|---|---|---|---|
| WTI Crude | 1,597,451 | 2 | 259,260 | 0 | -283,489 | 100 | 24,229 | 49 |
| Gold | 487,515 | 10 | 92,690 | 0 | -108,422 | 100 | 15,732 | 0 |
| Silver | 147,784 | 14 | -4,500 | 0 | -2,653 | 100 | 7,153 | 4 |
| Copper | 183,958 | 15 | -26,562 | 23 | 26,839 | 78 | -277 | 24 |
| Palladium | 7,124 | 4 | -3,408 | 4 | 3,894 | 97 | -486 | 16 |
| Platinum | 73,423 | 45 | -4,468 | 2 | -171 | 98 | 4,639 | 27 |
| Natural Gas | 976,126 | 4 | -118,290 | 43 | 83,028 | 57 | 35,262 | 64 |
| Brent | 177,837 | 22 | -41,482 | 42 | 40,557 | 61 | 925 | 22 |
| Heating Oil | 269,127 | 23 | 18,684 | 70 | -33,531 | 36 | 14,847 | 50 |
| Soybeans | 583,850 | 0 | 85,241 | 40 | -57,573 | 66 | -27,668 | 24 |
| Corn | 1,320,768 | 2 | 186,528 | 54 | -138,899 | 52 | -47,629 | 16 |
| Coffee | 199,536 | 5 | 28,641 | 64 | -28,867 | 43 | 226 | 2 |
| Sugar | 722,469 | 4 | 64,103 | 50 | -65,756 | 56 | 1,653 | 10 |
| Wheat | 301,674 | 6 | 25 | 19 | 8,068 | 71 | -8,093 | 68 |
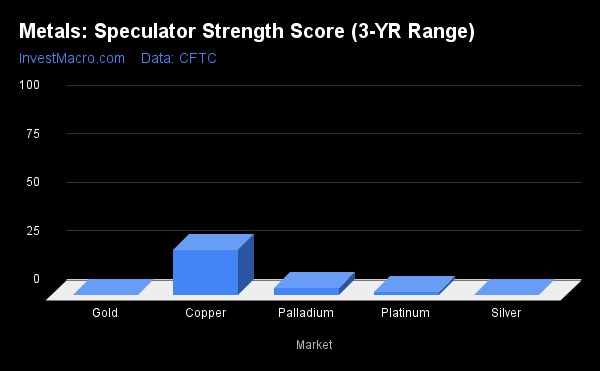
Strength Scores
Strength scores (a measure of the 3-Year range of Speculator positions, from 0 to 100 where above 80 is extreme bullish and below 20 is extreme bearish) continue to illustrate how out of favor the metals markets have been and continue to be for speculators. Copper (23.2 percent) leads the metals market in strength scores and is just out of a bearish extreme reading (below 20 percent) and fell a few points from last week. On the downside, Gold (0.0 percent) and Silver (0.0 percent) continue to make new 3-year low levels and are followed by Platinum (2.0 percent) and Palladium (3.7 percent). All four of these markets are in bearish extreme positions (below 20 percent) and have been for multiple weeks.
Strength Statistics:
Gold (0.0 percent) vs Gold previous week (0.9 percent)
Silver (0.0 percent) vs Silver previous week (7.1 percent)
Copper (23.2 percent) vs Copper previous week (25.2 percent)
Platinum (2.0 percent) vs Platinum previous week (2.2 percent)
Palladium (3.7 percent) vs Palladium previous week (1.7 percent)
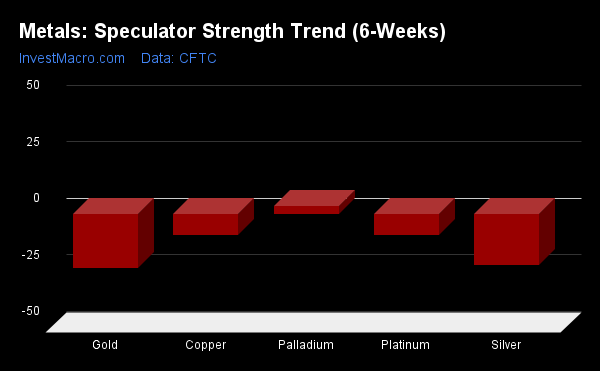
Strength Trends
Strength Score Trends (or move index, calculates the 6-week changes in strength scores) showed that Palladium (3.7 percent) had the only positive six-weeks trends for metals this week. Gold (-23.7 percent) leads the downside trend scores currently followed by Silver (-22.5 percent) with Copper (-9.2 percent) and Platinum (-9.1 percent) coming in next with lower trend scores.
Move Statistics:
Gold (-23.7 percent) vs Gold previous week (-30.8 percent)
Silver (-22.5 percent) vs Silver previous week (-19.5 percent)
Copper (-9.2 percent) vs Copper previous week (-14.5 percent)
Platinum (-9.1 percent) vs Platinum previous week (-13.9 percent)
Palladium (3.7 percent) vs Palladium previous week (-1.6 percent)
Individual Markets:
Gold Comex Futures:
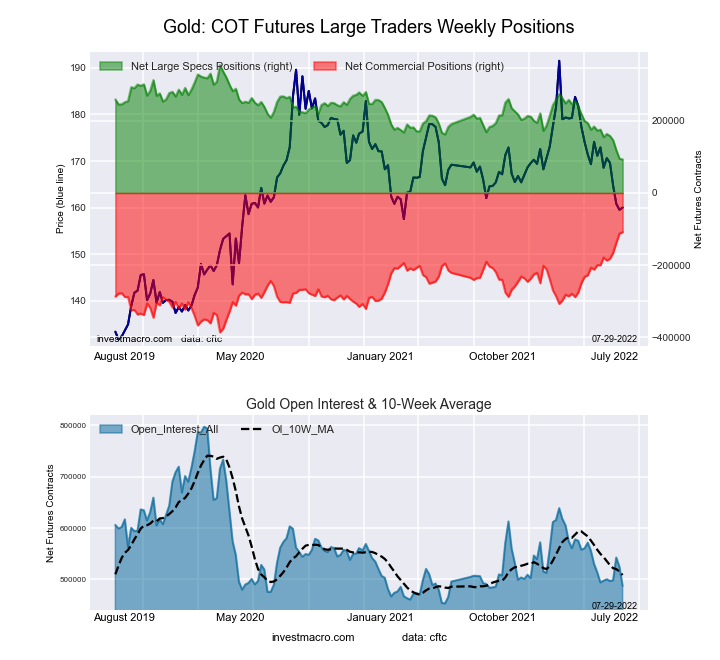 The Gold Comex Futures large speculator standing this week equaled a net position of 92,690 contracts in the data reported through Tuesday. This was a weekly lowering of -2,265 contracts from the previous week which had a total of 94,955 net contracts.
This week’s current strength score (the trader positioning range over the past three years, measured from 0 to 100) shows the speculators are currently Bearish-Extreme with a score of 0.0 percent. The commercials are Bullish-Extreme with a score of 100.0 percent and the small traders (not shown in chart) are Bearish-Extreme with a score of 0.0 percent.
| Gold Futures Statistics | SPECULATORS | COMMERCIALS | SMALL TRADERS |
| – Percent of Open Interest Longs: | 49.6 | 29.1 | 8.8 |
| – Percent of Open Interest Shorts: | 30.6 | 51.4 | 5.6 |
| – Net Position: | 92,690 | -108,422 | 15,732 |
| – Gross Longs: | 241,661 | 142,007 | 42,821 |
| – Gross Shorts: | 148,971 | 250,429 | 27,089 |
| – Long to Short Ratio: | 1.6 to 1 | 0.6 to 1 | 1.6 to 1 |
| NET POSITION TREND: | |||
| – Strength Index Score (3 Year Range Pct): | 0.0 | 100.0 | 0.0 |
| – Strength Index Reading (3 Year Range): | Bearish-Extreme | Bullish-Extreme | Bearish-Extreme |
| NET POSITION MOVEMENT INDEX: | |||
| – 6-Week Change in Strength Index: | -23.7 | 25.3 | -25.7 |
Silver Comex Futures:
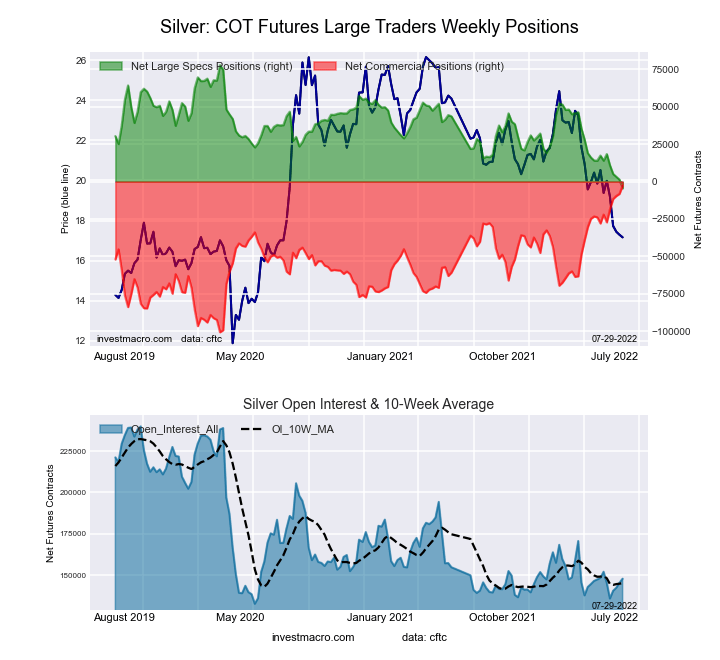 The Silver Comex Futures large speculator standing this week equaled a net position of -4,500 contracts in the data reported through Tuesday. This was a weekly reduction of -5,860 contracts from the previous week which had a total of 1,360 net contracts.
This week’s current strength score (the trader positioning range over the past three years, measured from 0 to 100) shows the speculators are currently Bearish-Extreme with a score of 0.0 percent. The commercials are Bullish-Extreme with a score of 100.0 percent and the small traders (not shown in chart) are Bearish-Extreme with a score of 3.6 percent.
| Silver Futures Statistics | SPECULATORS | COMMERCIALS | SMALL TRADERS |
| – Percent of Open Interest Longs: | 37.0 | 42.0 | 15.1 |
| – Percent of Open Interest Shorts: | 40.0 | 43.8 | 10.3 |
| – Net Position: | -4,500 | -2,653 | 7,153 |
| – Gross Longs: | 54,671 | 62,080 | 22,309 |
| – Gross Shorts: | 59,171 | 64,733 | 15,156 |
| – Long to Short Ratio: | 0.9 to 1 | 1.0 to 1 | 1.5 to 1 |
| NET POSITION TREND: | |||
| – Strength Index Score (3 Year Range Pct): | 0.0 | 100.0 | 3.6 |
| – Strength Index Reading (3 Year Range): | Bearish-Extreme | Bullish-Extreme | Bearish-Extreme |
| NET POSITION MOVEMENT INDEX: | |||
| – 6-Week Change in Strength Index: | -22.5 | 19.8 | -4.3 |
Copper Grade #1 Futures:
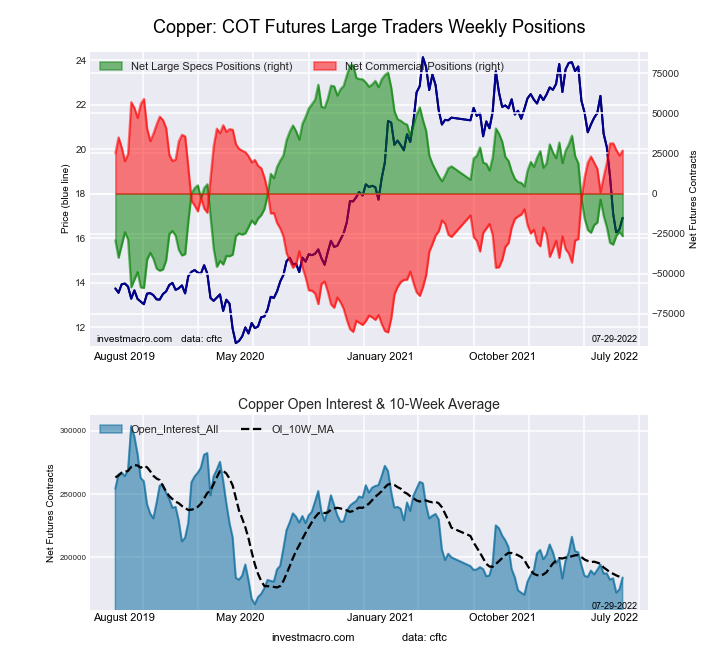 The Copper Grade #1 Futures large speculator standing this week equaled a net position of -26,562 contracts in the data reported through Tuesday. This was a weekly reduction of -2,726 contracts from the previous week which had a total of -23,836 net contracts.
This week’s current strength score (the trader positioning range over the past three years, measured from 0 to 100) shows the speculators are currently Bearish with a score of 23.2 percent. The commercials are Bullish with a score of 77.9 percent and the small traders (not shown in chart) are Bearish with a score of 23.7 percent.
| Copper Futures Statistics | SPECULATORS | COMMERCIALS | SMALL TRADERS |
| – Percent of Open Interest Longs: | 28.5 | 47.4 | 7.7 |
| – Percent of Open Interest Shorts: | 42.9 | 32.8 | 7.9 |
| – Net Position: | -26,562 | 26,839 | -277 |
| – Gross Longs: | 52,377 | 87,146 | 14,193 |
| – Gross Shorts: | 78,939 | 60,307 | 14,470 |
| – Long to Short Ratio: | 0.7 to 1 | 1.4 to 1 | 1.0 to 1 |
| NET POSITION TREND: | |||
| – Strength Index Score (3 Year Range Pct): | 23.2 | 77.9 | 23.7 |
| – Strength Index Reading (3 Year Range): | Bearish | Bullish | Bearish |
| NET POSITION MOVEMENT INDEX: | |||
| – 6-Week Change in Strength Index: | -9.2 | 11.4 | -21.9 |
Platinum Futures:
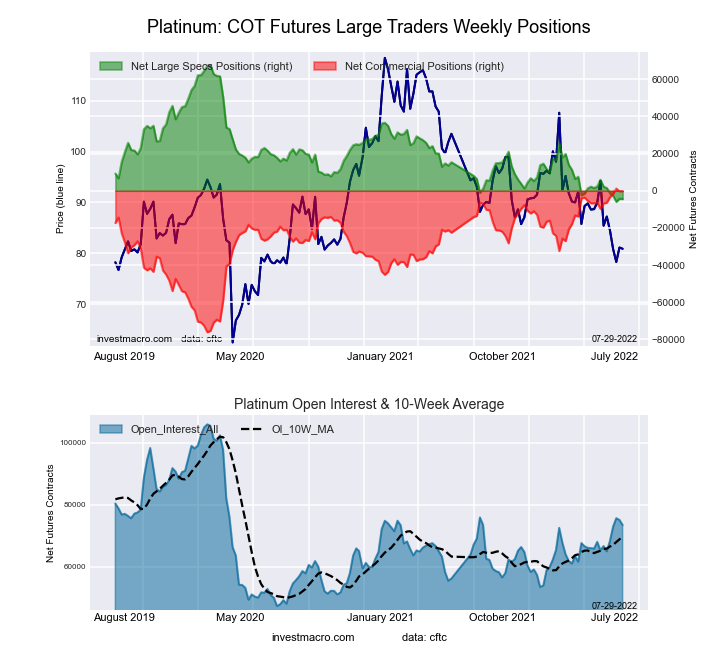 The Platinum Futures large speculator standing this week equaled a net position of -4,468 contracts in the data reported through Tuesday. This was a weekly lowering of -186 contracts from the previous week which had a total of -4,282 net contracts.
This week’s current strength score (the trader positioning range over the past three years, measured from 0 to 100) shows the speculators are currently Bearish-Extreme with a score of 2.0 percent. The commercials are Bullish-Extreme with a score of 98.2 percent and the small traders (not shown in chart) are Bearish with a score of 26.7 percent.
| Platinum Futures Statistics | SPECULATORS | COMMERCIALS | SMALL TRADERS |
| – Percent of Open Interest Longs: | 42.3 | 38.4 | 11.4 |
| – Percent of Open Interest Shorts: | 48.3 | 38.7 | 5.1 |
| – Net Position: | -4,468 | -171 | 4,639 |
| – Gross Longs: | 31,027 | 28,217 | 8,349 |
| – Gross Shorts: | 35,495 | 28,388 | 3,710 |
| – Long to Short Ratio: | 0.9 to 1 | 1.0 to 1 | 2.3 to 1 |
| NET POSITION TREND: | |||
| – Strength Index Score (3 Year Range Pct): | 2.0 | 98.2 | 26.7 |
| – Strength Index Reading (3 Year Range): | Bearish-Extreme | Bullish-Extreme | Bearish |
| NET POSITION MOVEMENT INDEX: | |||
| – 6-Week Change in Strength Index: | -9.1 | 8.6 | 0.8 |
Palladium Futures:
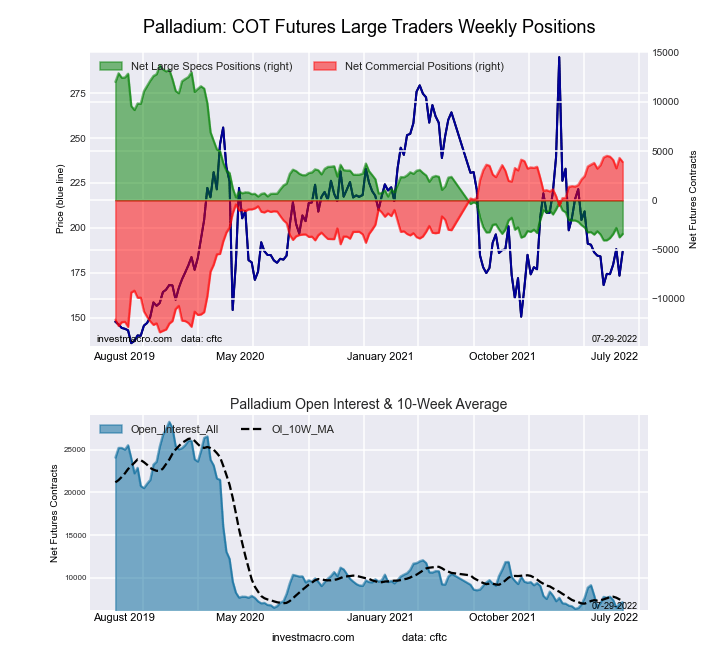 The Palladium Futures large speculator standing this week equaled a net position of -3,408 contracts in the data reported through Tuesday. This was a weekly increase of 343 contracts from the previous week which had a total of -3,751 net contracts.
This week’s current strength score (the trader positioning range over the past three years, measured from 0 to 100) shows the speculators are currently Bearish-Extreme with a score of 3.7 percent. The commercials are Bullish-Extreme with a score of 96.6 percent and the small traders (not shown in chart) are Bearish-Extreme with a score of 15.7 percent.
| Palladium Futures Statistics | SPECULATORS | COMMERCIALS | SMALL TRADERS |
| – Percent of Open Interest Longs: | 10.2 | 70.4 | 12.6 |
| – Percent of Open Interest Shorts: | 58.0 | 15.7 | 19.4 |
| – Net Position: | -3,408 | 3,894 | -486 |
| – Gross Longs: | 724 | 5,012 | 898 |
| – Gross Shorts: | 4,132 | 1,118 | 1,384 |
| – Long to Short Ratio: | 0.2 to 1 | 4.5 to 1 | 0.6 to 1 |
| NET POSITION TREND: | |||
| – Strength Index Score (3 Year Range Pct): | 3.7 | 96.6 | 15.7 |
| – Strength Index Reading (3 Year Range): | Bearish-Extreme | Bullish-Extreme | Bearish-Extreme |
| NET POSITION MOVEMENT INDEX: | |||
| – 6-Week Change in Strength Index: | 3.7 | -2.6 | -10.9 |
Article By InvestMacro – Receive our weekly COT Reports by Email
*COT Report: The COT data, released weekly to the public each Friday, is updated through the most recent Tuesday (data is 3 days old) and shows a quick view of how large speculators or non-commercials (for-profit traders) were positioned in the futures markets.
The CFTC categorizes trader positions according to commercial hedgers (traders who use futures contracts for hedging as part of the business), non-commercials (large traders who speculate to realize trading profits) and nonreportable traders (usually small traders/speculators) as well as their open interest (contracts open in the market at time of reporting).See CFTC criteria here.

- Geopolitical and macroeconomic conditions continue to pressure market sentiment Jul 20, 2026
- USD/JPY Poised to Continue Gains as Expensive Oil and Lack of Support Weigh on Yen Jul 20, 2026
- COT Metals Charts: Weekly Speculator Bets led by Copper & Steel Jul 18, 2026
- COT Bonds Charts: Weekly Speculator Bets led by 2-Year, SOFR 3M & 5-Year Bonds Jul 18, 2026
- COT Energy Charts: Weekly Speculator Bets led by Brent Oil & Heating Oil Jul 18, 2026
- COT Soft Commodities Charts: Weekly Speculator Bets led by Wheat, Corn & Soybean Meal Jul 18, 2026
- The Bank of Canada kept its interest rate unchanged. Platinum prices reached a three‑week high Jul 16, 2026
- Stock indices rose after the release of US inflation data. China’s GDP slowed sharply Jul 15, 2026
- GBP/USD Awaits Political News: What Will Happen Next Jul 15, 2026
- USD/JPY Holds at Highs: Pressure Lingers on Yen Jul 14, 2026