By RoboForex Analytical Department
The Gold prices reached stability on Monday not far from $1,812 per troy ounce. The strong American currency still puts much pressure on the precious metal.
Despite the significant market turbulence, demand for Gold as a “safe haven” asset is close to zero because US bonds are rallying and attracting much more attention. Unlike bonds, Gold doesn’t generate its own profitability.
Another factor that makes Gold less attractive to investors in the anticipation of another rate hike by the US Federal Reserve System.
Also, the Gold price is being pressured by news from India, which raised its import fee for the precious metal from 7.5% с 12.5% to reduce the foreign trade deficit. This move will decrease the demand for Gold in the country – the news is very important for market players because India is the second biggest consumer of Gold on the planet.
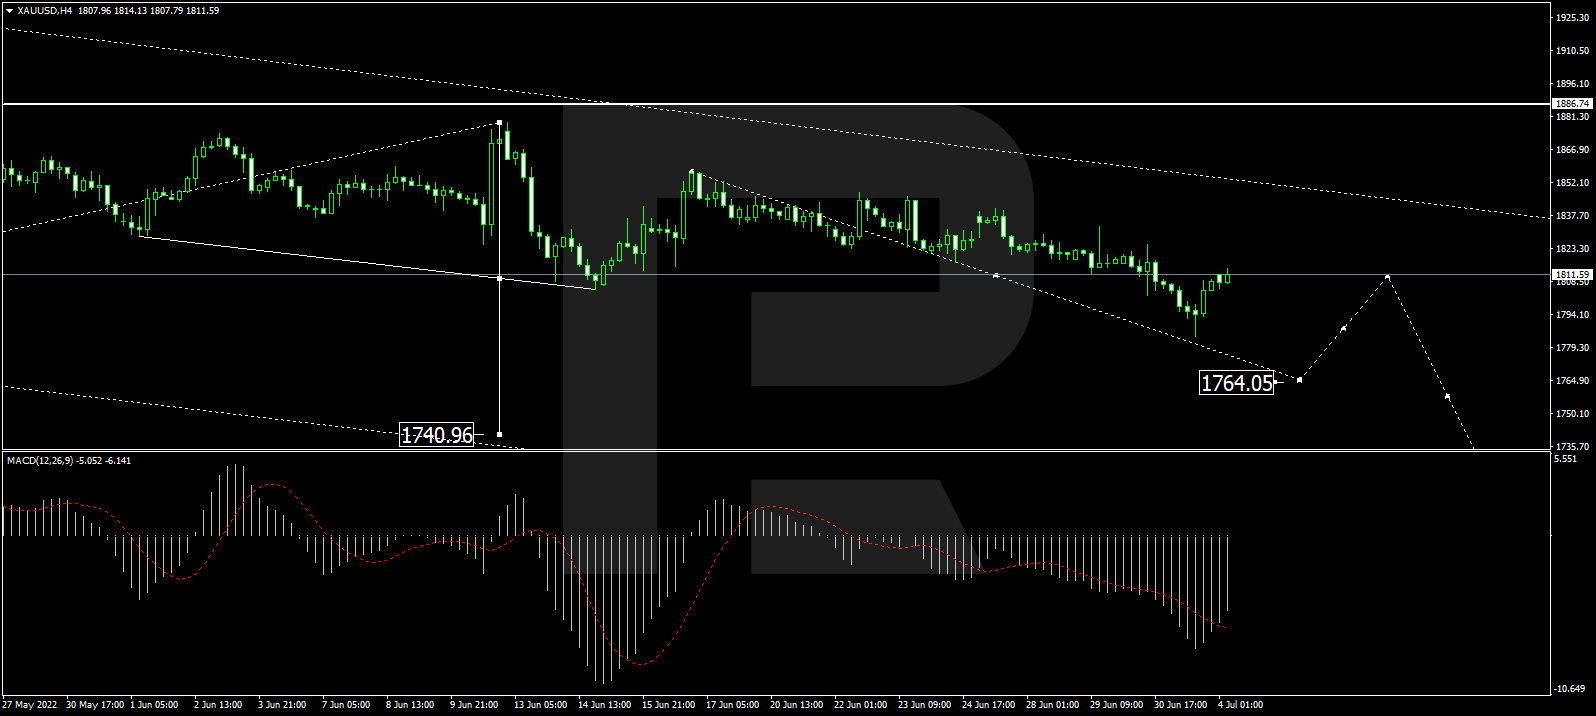
As we can see in the H4 chart, after completing the first descending structure at 1805.05, along with the correction up to 1857.10, XAU/USD has rebounded from the latter level; right now, it is falling again with the short-term target at 1764.00. Later, the market may start a new correction to test 1811.77 from below and then resume trading downwards towards 1704.88. From the technical point of view, this scenario is confirmed by the MACD Oscillator: its signal line is moving below 0 and may soon update its lows.
Free Reports:
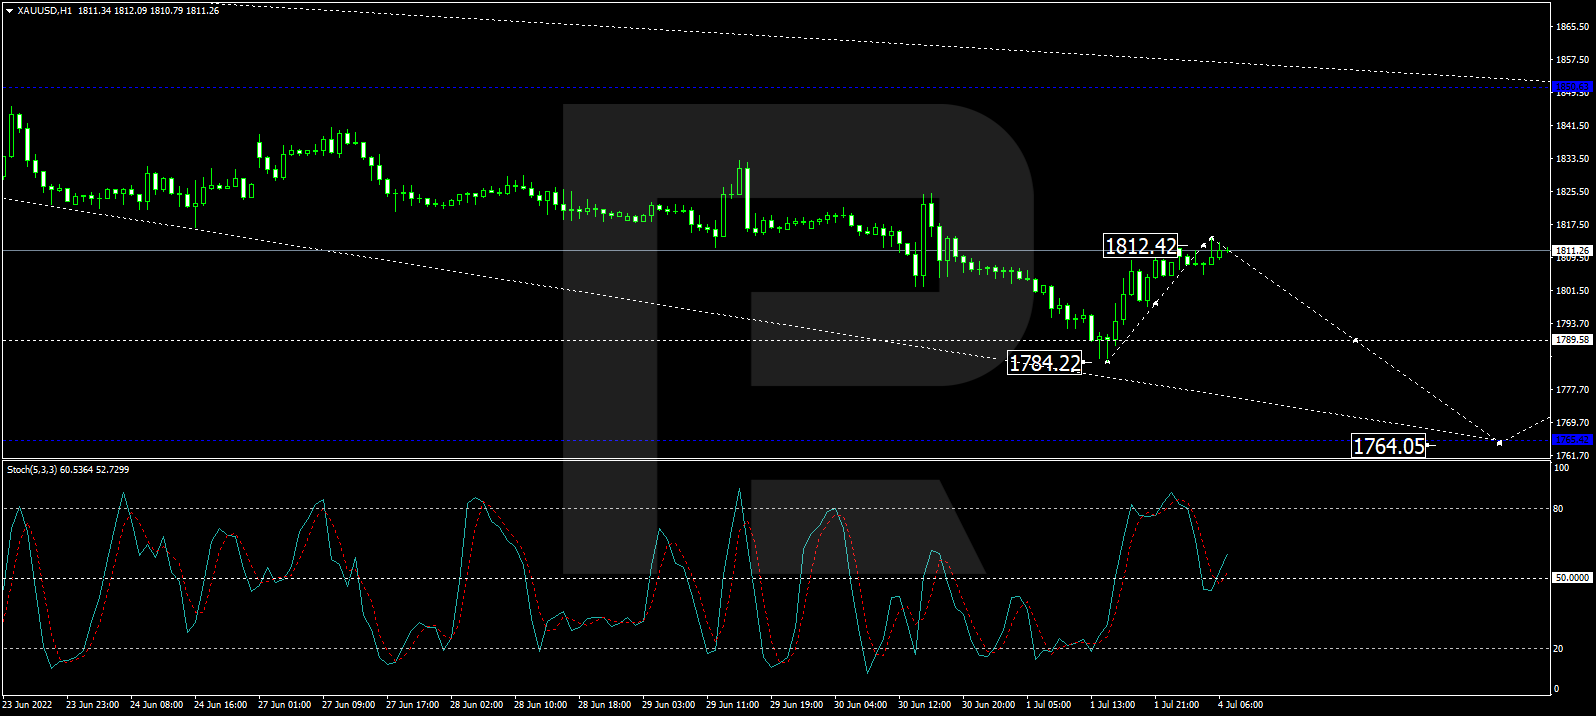
In the H1 chart, Gold has finished the descending wave at 1784.22, along with the correction to test 1812.40 from below; right now, it is consolidating below the latter level. Possibly, the metal may break this range to the downside and resume falling with the short-term target at 1764.00. From the technical point of view, this scenario is confirmed by the Stochastic Oscillator: after breaking 50 downwards, its signal is expected to continue falling and reach 20.
Disclaimer
Any forecasts contained herein are based on the author’s particular opinion. This analysis may not be treated as trading advice. RoboForex bears no responsibility for trading results based on trading recommendations and reviews contained herein.
By JustMarkets The US stock indices ended Friday’s session in the red. By the end…
By Analytical Department RoboForex USD/JPY opens the week at 162.36 on Monday. The Japanese yen…
By InvestMacro Here are the latest charts and statistics for the Commitment of Traders (COT)…
By InvestMacro The latest update for the weekly Commitment of Traders (COT) report was released…
By InvestMacro Here are the latest charts and statistics for the Commitment of Traders (COT)…
By InvestMacro Here are the latest charts and statistics for the Commitment of Traders (COT)…
This website uses cookies.