
By InvestMacro | COT | Data Tables | COT Leaders | Downloads | COT Newsletter
Here are the latest charts and statistics for the Commitment of Traders (COT) data published by the Commodities Futures Trading Commission (CFTC).
The latest COT data is updated through Tuesday May 31st and shows a quick view of how large traders (for-profit speculators and commercial entities) were positioned in the futures markets.
Metals large speculator bets were mostly higher this week as three out of the five metals markets we cover had higher positioning this week while two markets had lower contracts. Leading the gains for metals was Copper (1,608 contracts) with Platinum (878 contracts) and Palladium (339 contracts) also showing a positive week. Meanwhile, leading the declines in speculator bets this week was Gold (-11,224 contracts) while Silver (-106 contracts) also registered lower bets on the week.
Gold positions dropped by over -11,000 contracts this week and have now been lower in nine out of the past twelve weeks. The gold position has declined by a total of -101,799 contracts over that 12-week time period. This weakness has now pushed the gold speculator net standing to the lowest level of the past seventeen weeks, dating back to February 1st.
Free Reports:
 Get our Weekly Commitment of Traders Reports - See where the biggest traders (Hedge Funds and Commercial Hedgers) are positioned in the futures markets on a weekly basis.
 Sign Up for Our Stock Market Newsletter – Get updated on News, Charts & Rankings of Public Companies when you join our Stocks Newsletter
Silver bets, meanwhile, have fallen for six consecutive weeks and by a total of -32,432 contracts over that period. Silver speculators have bailed out of their bullish positions since early March 3rd when the net position hit a 43-week high at +52,297 contracts. Currently, the net position has fallen all the way down to +13,997 contracts this week which marks the lowest level in the past 155 weeks, dating back to June 11th of 2019.
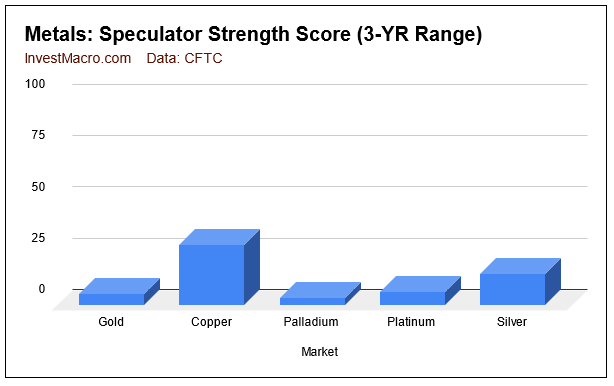 Strength scores (3-Year range of Speculator positions, from 0 to 100 where above 80 is extreme bullish and below 20 is extreme bearish) show that most of the metals markets are in extreme bearish levels (except Gold which is just above the 20 percent threshold).
 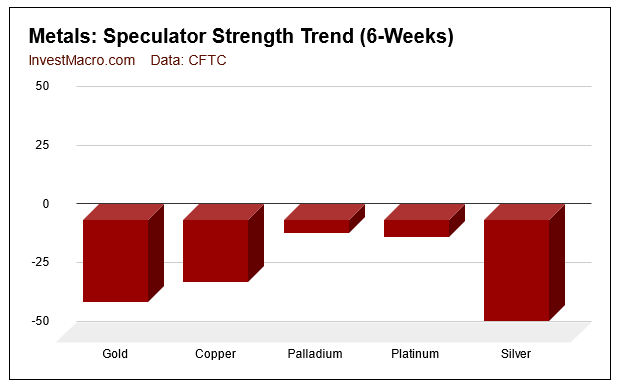 Strength score trends (or move index, that show 6-week changes in strength scores) shows the recent weakness of all of the metals market. Silver, Gold and Copper have fallen particularly hard in six weeks.
| May-31-2022 | OI | OI-Index | Spec-Net | Spec-Index | Com-Net | COM-Index | Smalls-Net | Smalls-Index |
|---|---|---|---|---|---|---|---|---|
| WTI Crude | 1,787,928 | 9 | 332,976 | 10 | -373,761 | 91 | 40,785 | 72 |
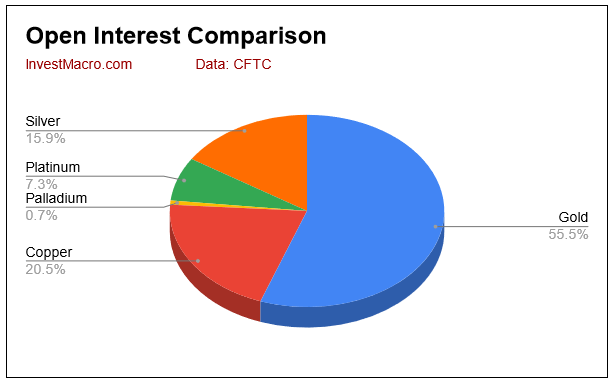
| Gold | 513,722 | 18 | 172,589 | 5 | -200,056 | 95 | 27,467 | 32 |
| Silver | 147,301 | 14 | 13,997 | 15 | -23,861 | 99 | 9,864 | 6 |
| Copper | 189,923 | 19 | -18,025 | 29 | 15,425 | 70 | 2,600 | 40 |
| Palladium | 6,538 | 1 | -3,133 | 4 | 3,221 | 95 | -88 | 39 |
| Platinum | 67,964 | 35 | 2,363 | 7 | -6,501 | 96 | 4,138 | 20 |
| Natural Gas | 1,115,815 | 7 | -110,368 | 45 | 59,679 | 50 | 50,689 | 100 |
| Brent | 181,699 | 25 | -40,872 | 43 | 38,941 | 58 | 1,931 | 35 |
| Heating Oil | 349,618 | 31 | 6,455 | 52 | -32,434 | 37 | 25,979 | 88 |
| Soybeans | 753,373 | 34 | 186,078 | 71 | -158,757 | 34 | -27,321 | 25 |
| Corn | 1,564,217 | 32 | 404,200 | 82 | -353,348 | 22 | -50,852 | 14 |
| Coffee | 214,170 | 8 | 43,015 | 76 | -45,757 | 28 | 2,742 | 17 |
| Sugar | 848,463 | 11 | 201,680 | 78 | -240,752 | 23 | 39,072 | 56 |
| Wheat | 331,136 | 11 | 22,309 | 48 | -18,647 | 33 | -3,662 | 91 |
Gold Comex Futures:
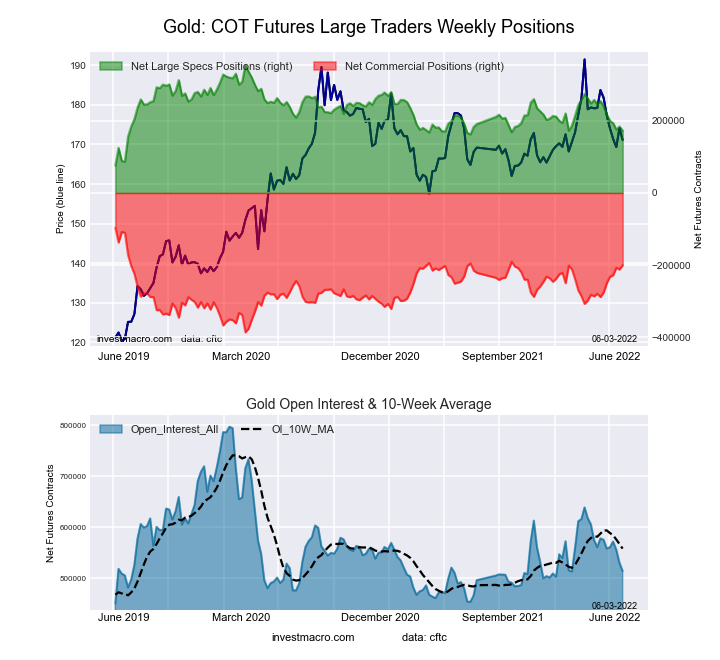 The Gold Comex Futures large speculator standing this week totaled a net position of 172,589 contracts in the data reported through Tuesday. This was a weekly decline of -11,224 contracts from the previous week which had a total of 183,813 net contracts.
This week’s current strength score (the trader positioning range over the past three years, measured from 0 to 100) shows the speculators are currently Bearish-Extreme with a score of 5.4 percent. The commercials are Bullish-Extreme with a score of 94.9 percent and the small traders (not shown in chart) are Bearish with a score of 32.2 percent.
| Gold Futures Statistics | SPECULATORS | COMMERCIALS | SMALL TRADERS |
| – Percent of Open Interest Longs: | 52.5 | 26.3 | 9.1 |
| – Percent of Open Interest Shorts: | 18.9 | 65.3 | 3.7 |
| – Net Position: | 172,589 | -200,056 | 27,467 |
| – Gross Longs: | 269,459 | 135,360 | 46,639 |
| – Gross Shorts: | 96,870 | 335,416 | 19,172 |
| – Long to Short Ratio: | 2.8 to 1 | 0.4 to 1 | 2.4 to 1 |
| NET POSITION TREND: | |||
| – Strength Index Score (3 Year Range Pct): | 5.4 | 94.9 | 32.2 |
| – Strength Index Reading (3 Year Range): | Bearish-Extreme | Bullish-Extreme | Bearish |
| NET POSITION MOVEMENT INDEX: | |||
| – 6-Week Change in Strength Index: | -35.1 | 38.6 | -27.6 |
Silver Comex Futures:
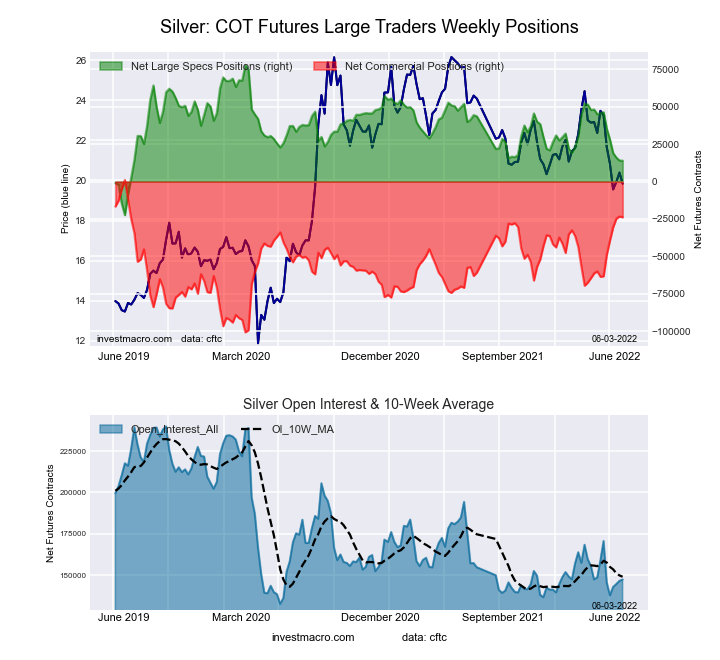 The Silver Comex Futures large speculator standing this week totaled a net position of 13,997 contracts in the data reported through Tuesday. This was a weekly decrease of -106 contracts from the previous week which had a total of 14,103 net contracts.
This week’s current strength score (the trader positioning range over the past three years, measured from 0 to 100) shows the speculators are currently Bearish-Extreme with a score of 15.1 percent. The commercials are Bullish-Extreme with a score of 99.3 percent and the small traders (not shown in chart) are Bearish-Extreme with a score of 6.2 percent.
| Silver Futures Statistics | SPECULATORS | COMMERCIALS | SMALL TRADERS |
| – Percent of Open Interest Longs: | 37.7 | 38.3 | 16.6 |
| – Percent of Open Interest Shorts: | 28.2 | 54.5 | 9.9 |
| – Net Position: | 13,997 | -23,861 | 9,864 |
| – Gross Longs: | 55,545 | 56,447 | 24,482 |
| – Gross Shorts: | 41,548 | 80,308 | 14,618 |
| – Long to Short Ratio: | 1.3 to 1 | 0.7 to 1 | 1.7 to 1 |
| NET POSITION TREND: | |||
| – Strength Index Score (3 Year Range Pct): | 15.1 | 99.3 | 6.2 |
| – Strength Index Reading (3 Year Range): | Bearish-Extreme | Bullish-Extreme | Bearish-Extreme |
| NET POSITION MOVEMENT INDEX: | |||
| – 6-Week Change in Strength Index: | -43.1 | 50.9 | -38.3 |
Copper Grade #1 Futures:
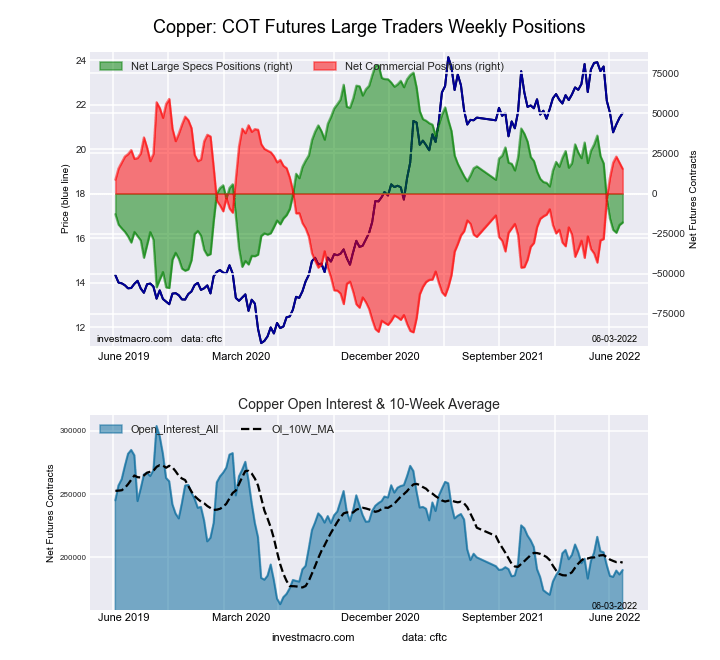 The Copper Grade #1 Futures large speculator standing this week totaled a net position of -18,025 contracts in the data reported through Tuesday. This was a weekly gain of 1,608 contracts from the previous week which had a total of -19,633 net contracts.
This week’s current strength score (the trader positioning range over the past three years, measured from 0 to 100) shows the speculators are currently Bearish with a score of 29.4 percent. The commercials are Bullish with a score of 70.1 percent and the small traders (not shown in chart) are Bearish with a score of 40.3 percent.
| Copper Futures Statistics | SPECULATORS | COMMERCIALS | SMALL TRADERS |
| – Percent of Open Interest Longs: | 28.1 | 52.5 | 9.0 |
| – Percent of Open Interest Shorts: | 37.6 | 44.4 | 7.7 |
| – Net Position: | -18,025 | 15,425 | 2,600 |
| – Gross Longs: | 53,404 | 99,692 | 17,184 |
| – Gross Shorts: | 71,429 | 84,267 | 14,584 |
| – Long to Short Ratio: | 0.7 to 1 | 1.2 to 1 | 1.2 to 1 |
| NET POSITION TREND: | |||
| – Strength Index Score (3 Year Range Pct): | 29.4 | 70.1 | 40.3 |
| – Strength Index Reading (3 Year Range): | Bearish | Bullish | Bearish |
| NET POSITION MOVEMENT INDEX: | |||
| – 6-Week Change in Strength Index: | -26.5 | 30.1 | -39.7 |
Platinum Futures:
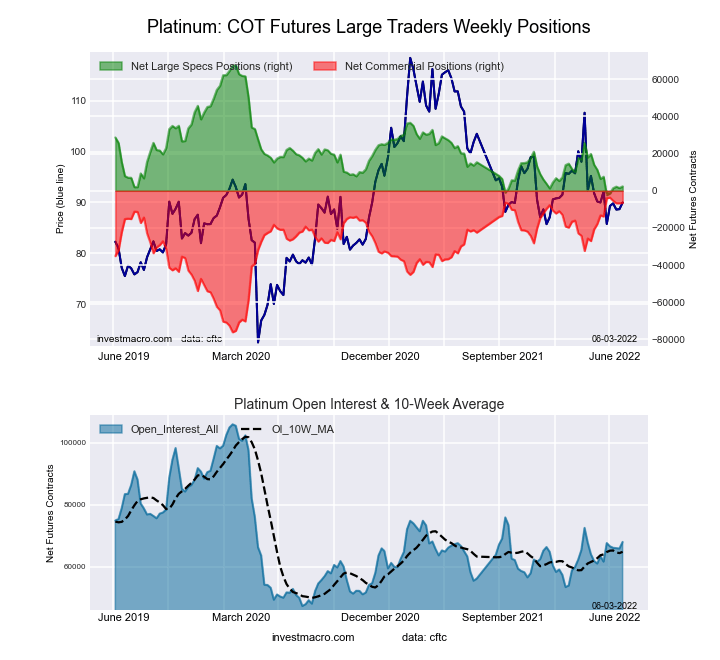 The Platinum Futures large speculator standing this week totaled a net position of 2,363 contracts in the data reported through Tuesday. This was a weekly rise of 878 contracts from the previous week which had a total of 1,485 net contracts.
This week’s current strength score (the trader positioning range over the past three years, measured from 0 to 100) shows the speculators are currently Bearish-Extreme with a score of 6.7 percent. The commercials are Bullish-Extreme with a score of 96.1 percent and the small traders (not shown in chart) are Bearish-Extreme with a score of 19.7 percent.
| Platinum Futures Statistics | SPECULATORS | COMMERCIALS | SMALL TRADERS |
| – Percent of Open Interest Longs: | 40.1 | 40.6 | 11.8 |
| – Percent of Open Interest Shorts: | 36.6 | 50.2 | 5.7 |
| – Net Position: | 2,363 | -6,501 | 4,138 |
| – Gross Longs: | 27,226 | 27,591 | 8,034 |
| – Gross Shorts: | 24,863 | 34,092 | 3,896 |
| – Long to Short Ratio: | 1.1 to 1 | 0.8 to 1 | 2.1 to 1 |
| NET POSITION TREND: | |||
| – Strength Index Score (3 Year Range Pct): | 6.7 | 96.1 | 19.7 |
| – Strength Index Reading (3 Year Range): | Bearish-Extreme | Bullish-Extreme | Bearish-Extreme |
| NET POSITION MOVEMENT INDEX: | |||
| – 6-Week Change in Strength Index: | -7.4 | 10.1 | -29.9 |
Palladium Futures:
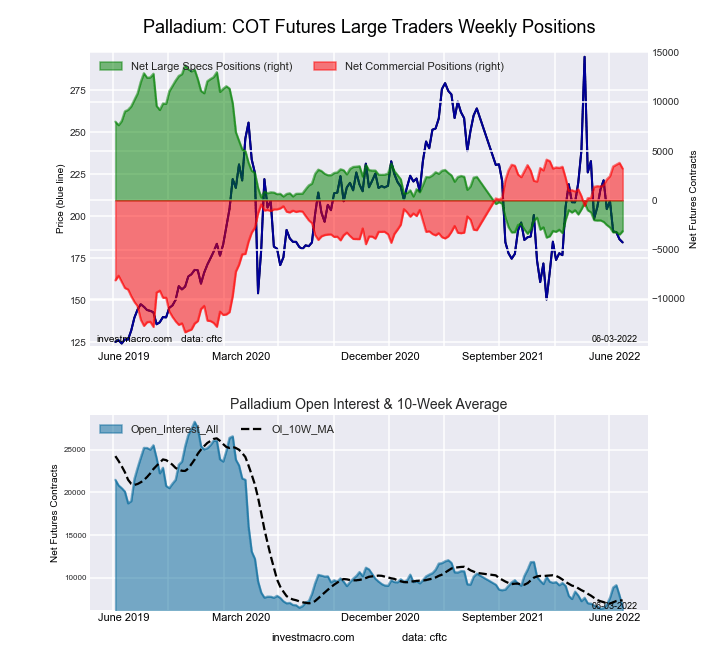 The Palladium Futures large speculator standing this week totaled a net position of -3,133 contracts in the data reported through Tuesday. This was a weekly increase of 339 contracts from the previous week which had a total of -3,472 net contracts.
This week’s current strength score (the trader positioning range over the past three years, measured from 0 to 100) shows the speculators are currently Bearish-Extreme with a score of 3.7 percent. The commercials are Bullish-Extreme with a score of 94.8 percent and the small traders (not shown in chart) are Bearish with a score of 38.8 percent.
| Palladium Futures Statistics | SPECULATORS | COMMERCIALS | SMALL TRADERS |
| – Percent of Open Interest Longs: | 12.3 | 70.6 | 15.7 |
| – Percent of Open Interest Shorts: | 60.2 | 21.3 | 17.1 |
| – Net Position: | -3,133 | 3,221 | -88 |
| – Gross Longs: | 803 | 4,614 | 1,029 |
| – Gross Shorts: | 3,936 | 1,393 | 1,117 |
| – Long to Short Ratio: | 0.2 to 1 | 3.3 to 1 | 0.9 to 1 |
| NET POSITION TREND: | |||
| – Strength Index Score (3 Year Range Pct): | 3.7 | 94.8 | 38.8 |
| – Strength Index Reading (3 Year Range): | Bearish-Extreme | Bullish-Extreme | Bearish |
| NET POSITION MOVEMENT INDEX: | |||
| – 6-Week Change in Strength Index: | -5.4 | 9.5 | -41.1 |
Article By InvestMacro – Receive our weekly COT Reports by Email
*COT Report: The COT data, released weekly to the public each Friday, is updated through the most recent Tuesday (data is 3 days old) and shows a quick view of how large speculators or non-commercials (for-profit traders) were positioned in the futures markets.
The CFTC categorizes trader positions according to commercial hedgers (traders who use futures contracts for hedging as part of the business), non-commercials (large traders who speculate to realize trading profits) and nonreportable traders (usually small traders/speculators) as well as their open interest (contracts open in the market at time of reporting).See CFTC criteria here.

- Geopolitical and macroeconomic conditions continue to pressure market sentiment Jul 20, 2026
- USD/JPY Poised to Continue Gains as Expensive Oil and Lack of Support Weigh on Yen Jul 20, 2026
- COT Metals Charts: Weekly Speculator Bets led by Copper & Steel Jul 18, 2026
- COT Bonds Charts: Weekly Speculator Bets led by 2-Year, SOFR 3M & 5-Year Bonds Jul 18, 2026
- COT Energy Charts: Weekly Speculator Bets led by Brent Oil & Heating Oil Jul 18, 2026
- COT Soft Commodities Charts: Weekly Speculator Bets led by Wheat, Corn & Soybean Meal Jul 18, 2026
- The Bank of Canada kept its interest rate unchanged. Platinum prices reached a three‑week high Jul 16, 2026
- Stock indices rose after the release of US inflation data. China’s GDP slowed sharply Jul 15, 2026
- GBP/USD Awaits Political News: What Will Happen Next Jul 15, 2026
- USD/JPY Holds at Highs: Pressure Lingers on Yen Jul 14, 2026