
By RoboForex Analytical Department
Another week of May brings a new decline in Oil. Brent is retreating and hanging around $109.50.
A season of active car travel is starting in the US. In this light, demand for gasoline, which is getting more and more expensive, is rising. As a result, the problems with satisfying the demand are also getting more complicated and may continue pushing gasoline prices upwards.
The latest report from Baker Hughes showed that the Oil Rig Count in the US is rising too slowly to provide enough support to the commodity market – the indicator gained only 6 units, up to 563 – while in Canada it decreased by 5 units. At the same time, shale oil production remains rather passive.
There are too many market emotions around geopolitical tensions. For example, earlier today, Bloomberg reported that Germany was planning to stop importing Russian oil by the end of the year even if the European Union fails to agree on a similar decision. In a time of insufficient oil supply, such news may eliminate negative vibes a little bit.
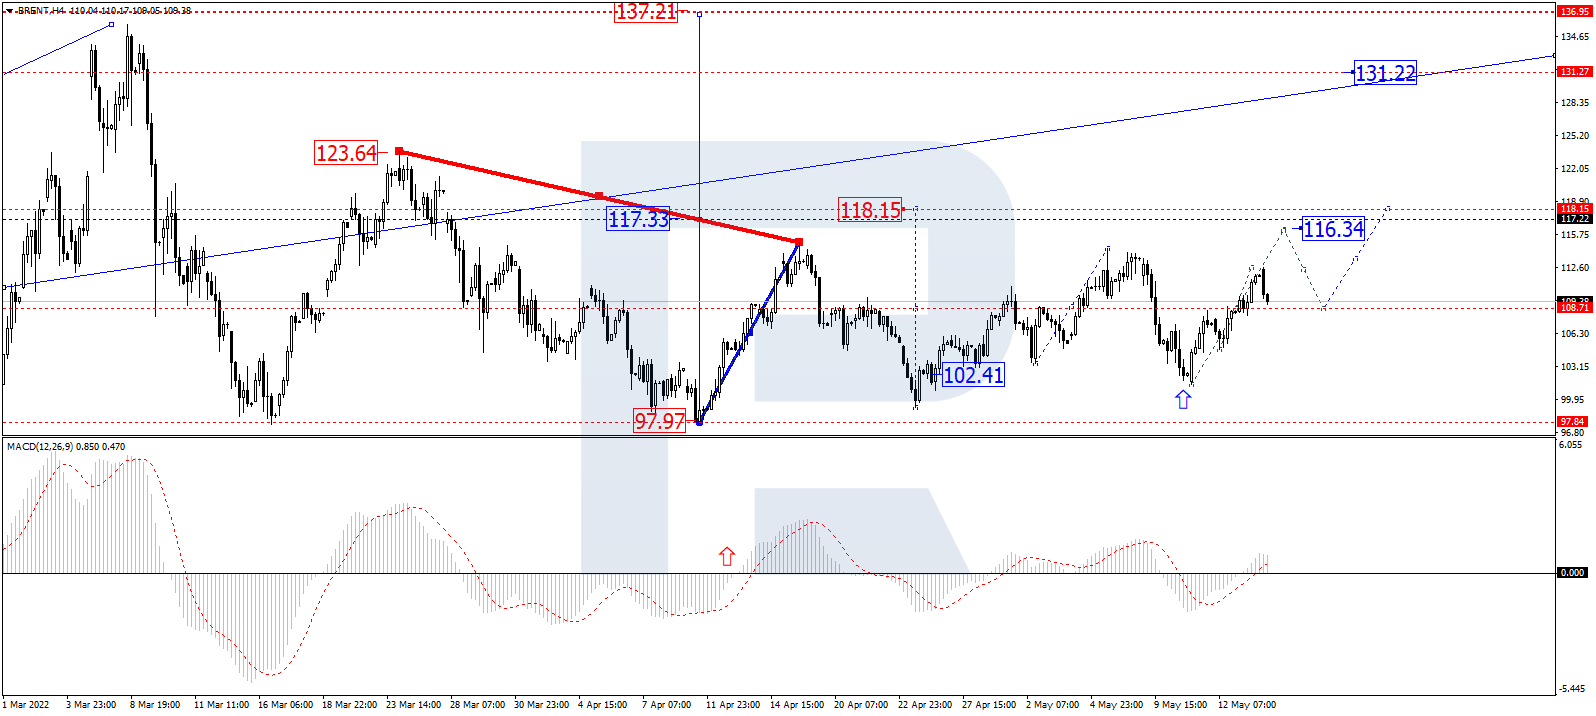
In the H4 chart, having completed the correction at 101.55 and then broken two important levels, at 108.75 and 112.60, Brent continues forming the ascending wave with the target at 118.15. Today, the pair may correct to test 108.75 from above and then form one more ascending structure towards 116.15. Later, the market may break the latter level and continue moving within the uptrend to reach the above-mentioned target. From the technical point of view, this scenario is confirmed by MACD Oscillator: after breaking 0 to the upside, its signal line is growing within the histogram area, which means that the uptrend in the price chart may continue.
Free Reports:
 Sign Up for Our Stock Market Newsletter – Get updated on News, Charts & Rankings of Public Companies when you join our Stocks Newsletter
 Get our Weekly Commitment of Traders Reports - See where the biggest traders (Hedge Funds and Commercial Hedgers) are positioned in the futures markets on a weekly basis.
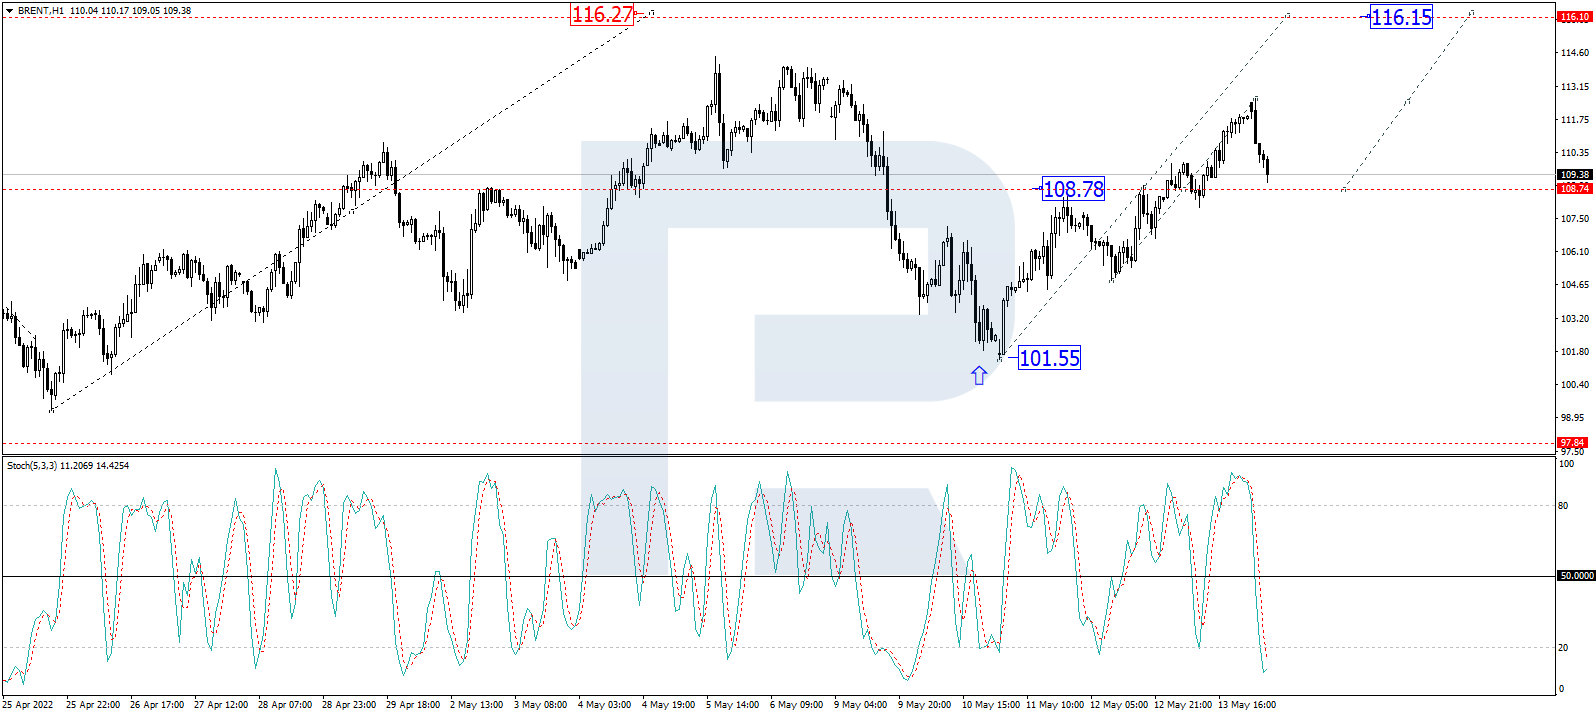
As we can see in the H1 chart, Brent is forming another ascending structure from 101.55 to 116.15; it has already reached the short-term target at 112.60 and is currently correcting to test 108.75 from above. After the correction is over, the market may resume growing to break 116.15 and then continue trading upwards with the target at 118.15. From the technical point of view, this idea is confirmed by the Stochastic Oscillator: its signal line is moving below 20 and may resume growing to break 50. After that, the line is expected to continue moving upwards and reach 80.
Disclaimer
Any forecasts contained herein are based on the author’s particular opinion. This analysis may not be treated as trading advice. RoboForex bears no responsibility for trading results based on trading recommendations and reviews contained herein.

- GBP/USD Starts the Week on a Strong Footing Aug 10, 2026
- The US stock indices finished the session with solid gains following the release of weak labor‑market data Aug 10, 2026
- COT Metals Charts: Speculator Bets led by Gold, Copper & Platinum Aug 9, 2026
- COT Bonds Charts: Speculator Bets led by 2-Year Bonds & US Treasury Bonds Aug 9, 2026
- COT Energy Charts: Speculator Bets led by Heating Oil & Bloomberg Index Aug 9, 2026
- COT Soft Commodities Charts: Speculator Bets led by Sugar & Cotton Aug 9, 2026
- The Central Bank of Mexico kept its interest rate unchanged. Iran plans to introduce strict bans for US and Israeli vessels in the Strait of Hormuz Aug 7, 2026
- USD/JPY Holds Firm: Yen Loses Some Support Aug 7, 2026
- Australian trade balance returned to positive territory Aug 6, 2026
- Results in Line for Most Reporting Companies Aug 5, 2026
