
By InvestMacro | COT | Data Tables | COT Leaders | Downloads | COT Newsletter
Here are the latest charts and statistics for the Commitment of Traders (COT) data published by the Commodities Futures Trading Commission (CFTC).
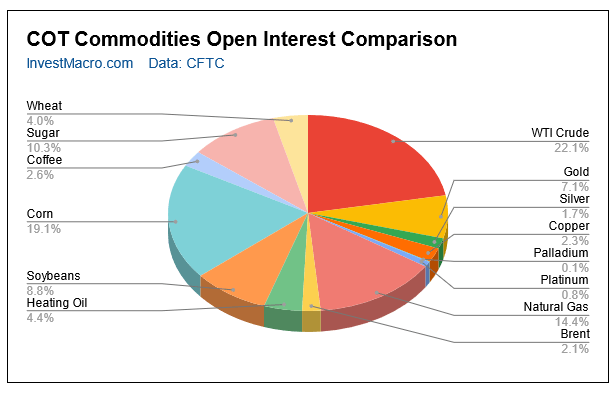
The latest COT data is updated through Tuesday May 3rd 2022 and shows a quick view of how large traders (for-profit speculators and commercial entities) were positioned in the futures markets.
The markets with higher speculator bets this week were WTI Crude Oil (5,638 contracts) and Brent Crude Oil (11,213 contracts) while the markets with lower speculator bets this week were Natural Gas (-326 contracts), Heating Oil (-9,228 contracts), Gasoline (-860 contracts) and the Bloomberg Commodity Index (-2,138 contracts).
| May-03-2022 | OI | OI-Index | Spec-Net | Spec-Index | Com-Net | COM-Index | Smalls-Net | Smalls-Index |
|---|---|---|---|---|---|---|---|---|
| WTI Crude | 1,751,564 | 2 | 321,701 | 6 | -366,213 | 94 | 44,512 | 78 |
| Gold | 560,441 | 31 | 199,168 | 42 | -231,852 | 55 | 32,684 | 57 |
| Silver | 137,692 | 5 | 28,068 | 50 | -39,317 | 60 | 11,249 | 8 |
| Copper | 185,255 | 16 | -15,623 | 31 | 10,080 | 66 | 5,543 | 57 |
| Palladium | 7,638 | 6 | -2,752 | 6 | 2,455 | 90 | 297 | 61 |
| Platinum | 66,545 | 33 | -1,541 | 1 | -3,667 | 100 | 5,208 | 35 |
| Natural Gas | 1,138,319 | 12 | -117,706 | 43 | 72,861 | 54 | 44,845 | 92 |
| Brent | 168,128 | 14 | -27,318 | 65 | 26,014 | 37 | 1,304 | 27 |
| Heating Oil | 349,618 | 31 | 6,455 | 52 | -32,434 | 37 | 25,979 | 88 |
| Soybeans | 700,856 | 22 | 190,402 | 77 | -165,353 | 27 | -25,049 | 29 |
| Corn | 1,513,880 | 23 | 501,865 | 94 | -451,210 | 8 | -50,655 | 14 |
| Coffee | 206,337 | 1 | 40,697 | 77 | -43,007 | 28 | 2,310 | 5 |
| Sugar | 818,627 | 1 | 201,592 | 78 | -236,394 | 23 | 34,802 | 51 |
| Wheat | 319,233 | 0 | 20,012 | 60 | -14,225 | 30 | -5,787 | 82 |
Free Reports:
 Sign Up for Our Stock Market Newsletter – Get updated on News, Charts & Rankings of Public Companies when you join our Stocks Newsletter
 Get our Weekly Commitment of Traders Reports - See where the biggest traders (Hedge Funds and Commercial Hedgers) are positioned in the futures markets on a weekly basis.
WTI Crude Oil Futures:
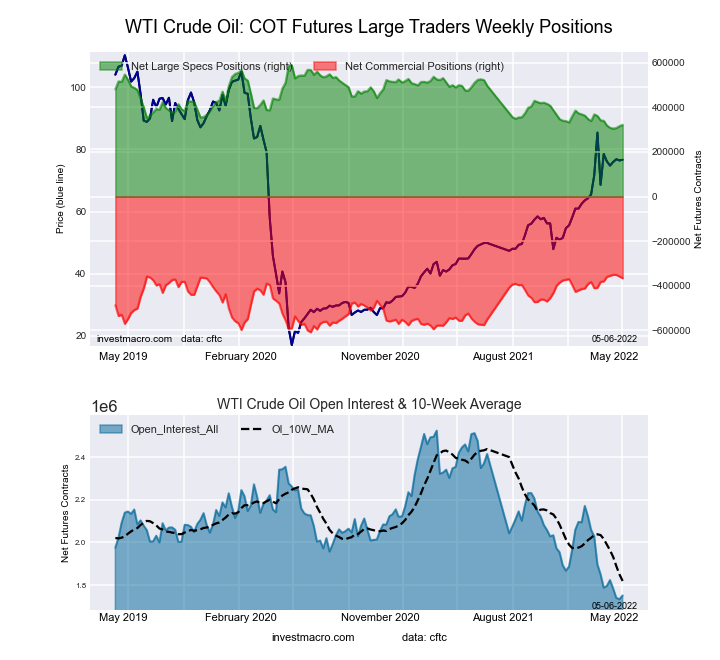 The WTI Crude Oil Futures large speculator standing this week reached a net position of 321,701 contracts in the data reported through Tuesday. This was a weekly gain of 5,638 contracts from the previous week which had a total of 316,063 net contracts.
This week’s current strength score (the trader positioning range over the past three years, measured from 0 to 100) shows the speculators are currently Bearish-Extreme with a score of 5.9 percent. The commercials are Bullish-Extreme with a score of 93.9 percent and the small traders (not shown in chart) are Bullish with a score of 77.7 percent.
| WTI Crude Oil Futures Statistics | SPECULATORS | COMMERCIALS | SMALL TRADERS |
| – Percent of Open Interest Longs: | 24.0 | 35.4 | 5.2 |
| – Percent of Open Interest Shorts: | 5.6 | 56.3 | 2.6 |
| – Net Position: | 321,701 | -366,213 | 44,512 |
| – Gross Longs: | 419,692 | 620,327 | 90,371 |
| – Gross Shorts: | 97,991 | 986,540 | 45,859 |
| – Long to Short Ratio: | 4.3 to 1 | 0.6 to 1 | 2.0 to 1 |
| NET POSITION TREND: | |||
| – Strength Index Score (3 Year Range Pct): | 5.9 | 93.9 | 77.7 |
| – Strength Index Reading (3 Year Range): | Bearish-Extreme | Bullish-Extreme | Bullish |
| NET POSITION MOVEMENT INDEX: | |||
| – 6-Week Change in Strength Index: | -6.4 | 5.4 | 6.2 |
Brent Crude Oil Futures:
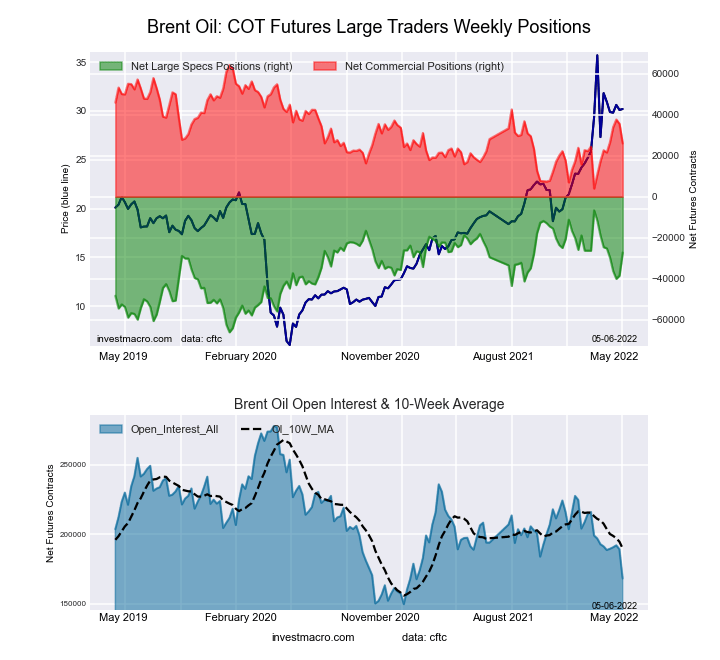 The Brent Crude Oil Futures large speculator standing this week reached a net position of -27,318 contracts in the data reported through Tuesday. This was a weekly increase of 11,213 contracts from the previous week which had a total of -38,531 net contracts.
This week’s current strength score (the trader positioning range over the past three years, measured from 0 to 100) shows the speculators are currently Bullish with a score of 65.4 percent. The commercials are Bearish with a score of 36.6 percent and the small traders (not shown in chart) are Bearish with a score of 26.9 percent.
| Brent Crude Oil Futures Statistics | SPECULATORS | COMMERCIALS | SMALL TRADERS |
| – Percent of Open Interest Longs: | 20.6 | 46.7 | 4.1 |
| – Percent of Open Interest Shorts: | 36.9 | 31.2 | 3.3 |
| – Net Position: | -27,318 | 26,014 | 1,304 |
| – Gross Longs: | 34,685 | 78,491 | 6,840 |
| – Gross Shorts: | 62,003 | 52,477 | 5,536 |
| – Long to Short Ratio: | 0.6 to 1 | 1.5 to 1 | 1.2 to 1 |
| NET POSITION TREND: | |||
| – Strength Index Score (3 Year Range Pct): | 65.4 | 36.6 | 26.9 |
| – Strength Index Reading (3 Year Range): | Bullish | Bearish | Bearish |
| NET POSITION MOVEMENT INDEX: | |||
| – 6-Week Change in Strength Index: | -4.5 | 5.6 | -9.8 |
Natural Gas Futures:
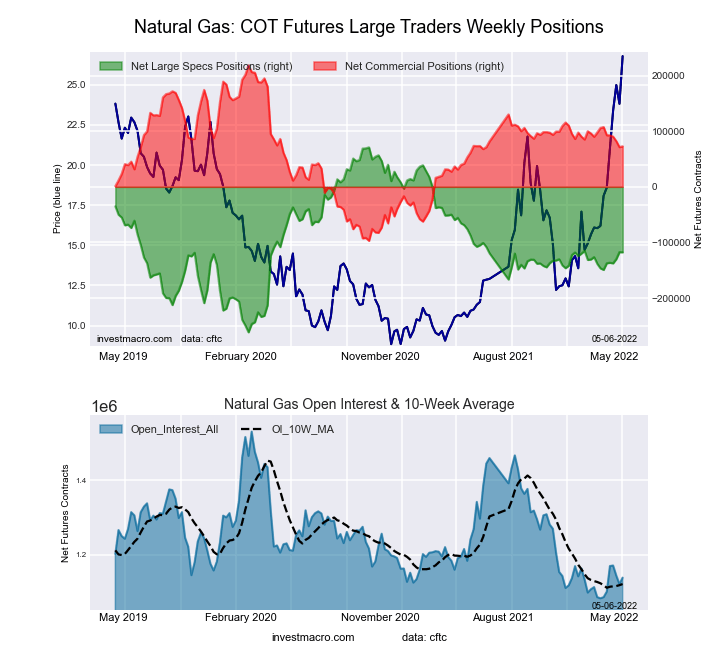 The Natural Gas Futures large speculator standing this week reached a net position of -117,706 contracts in the data reported through Tuesday. This was a weekly reduction of -326 contracts from the previous week which had a total of -117,380 net contracts.
This week’s current strength score (the trader positioning range over the past three years, measured from 0 to 100) shows the speculators are currently Bearish with a score of 43.3 percent. The commercials are Bullish with a score of 53.8 percent and the small traders (not shown in chart) are Bullish-Extreme with a score of 92.3 percent.
| Natural Gas Futures Statistics | SPECULATORS | COMMERCIALS | SMALL TRADERS |
| – Percent of Open Interest Longs: | 21.7 | 38.9 | 6.4 |
| – Percent of Open Interest Shorts: | 32.0 | 32.5 | 2.5 |
| – Net Position: | -117,706 | 72,861 | 44,845 |
| – Gross Longs: | 247,092 | 442,604 | 72,900 |
| – Gross Shorts: | 364,798 | 369,743 | 28,055 |
| – Long to Short Ratio: | 0.7 to 1 | 1.2 to 1 | 2.6 to 1 |
| NET POSITION TREND: | |||
| – Strength Index Score (3 Year Range Pct): | 43.3 | 53.8 | 92.3 |
| – Strength Index Reading (3 Year Range): | Bearish | Bullish | Bullish-Extreme |
| NET POSITION MOVEMENT INDEX: | |||
| – 6-Week Change in Strength Index: | 9.5 | -11.0 | 7.5 |
Gasoline Blendstock Futures:
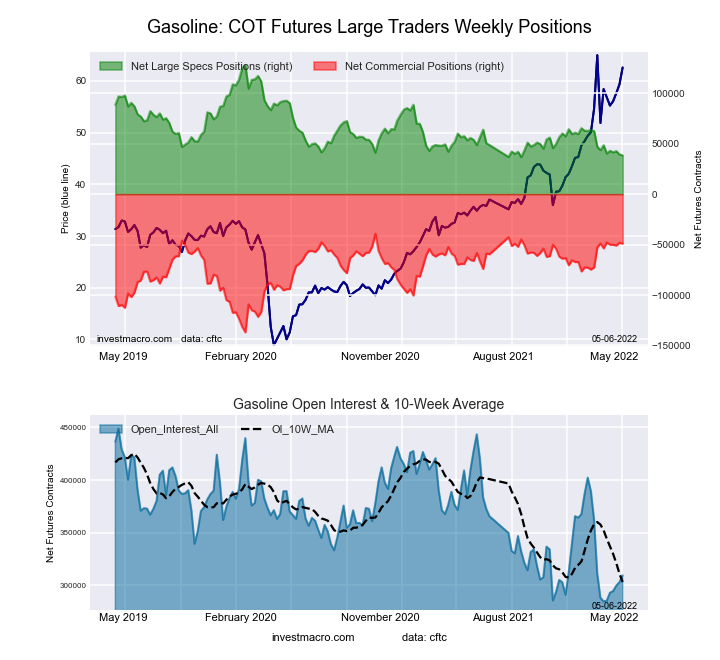 The Gasoline Blendstock Futures large speculator standing this week reached a net position of 38,381 contracts in the data reported through Tuesday. This was a weekly decline of -860 contracts from the previous week which had a total of 39,241 net contracts.
This week’s current strength score (the trader positioning range over the past three years, measured from 0 to 100) shows the speculators are currently Bearish-Extreme with a score of 9.2 percent. The commercials are Bullish-Extreme with a score of 88.0 percent and the small traders (not shown in chart) are Bullish-Extreme with a score of 83.4 percent.
| Nasdaq Mini Futures Statistics | SPECULATORS | COMMERCIALS | SMALL TRADERS |
| – Percent of Open Interest Longs: | 25.5 | 52.1 | 7.3 |
| – Percent of Open Interest Shorts: | 13.1 | 68.0 | 3.9 |
| – Net Position: | 38,381 | -48,991 | 10,610 |
| – Gross Longs: | 79,017 | 161,247 | 22,690 |
| – Gross Shorts: | 40,636 | 210,238 | 12,080 |
| – Long to Short Ratio: | 1.9 to 1 | 0.8 to 1 | 1.9 to 1 |
| NET POSITION TREND: | |||
| – Strength Index Score (3 Year Range Pct): | 9.2 | 88.0 | 83.4 |
| – Strength Index Reading (3 Year Range): | Bearish-Extreme | Bullish-Extreme | Bullish-Extreme |
| NET POSITION MOVEMENT INDEX: | |||
| – 6-Week Change in Strength Index: | -10.2 | 4.7 | 35.3 |
#2 Heating Oil NY-Harbor Futures:
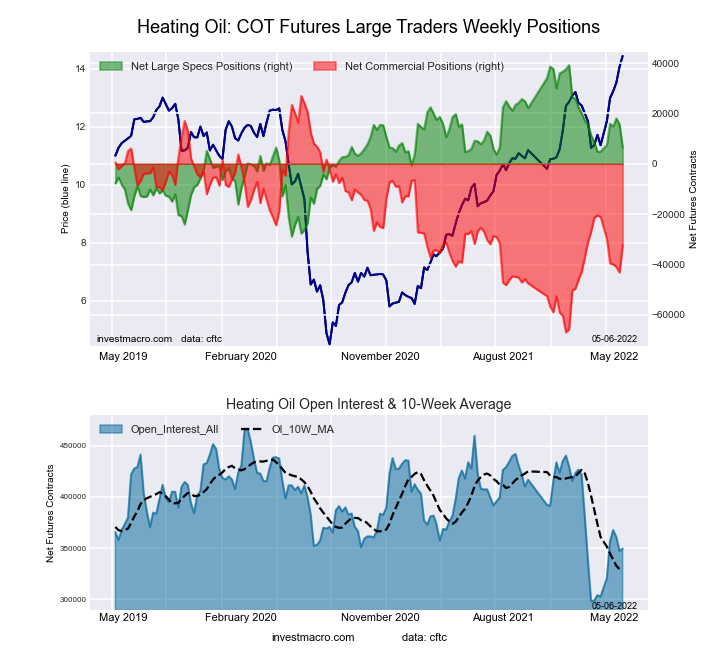 The #2 Heating Oil NY-Harbor Futures large speculator standing this week reached a net position of 6,455 contracts in the data reported through Tuesday. This was a weekly fall of -9,228 contracts from the previous week which had a total of 15,683 net contracts.
This week’s current strength score (the trader positioning range over the past three years, measured from 0 to 100) shows the speculators are currently Bullish with a score of 51.9 percent. The commercials are Bearish with a score of 36.7 percent and the small traders (not shown in chart) are Bullish-Extreme with a score of 88.4 percent.
| Heating Oil Futures Statistics | SPECULATORS | COMMERCIALS | SMALL TRADERS |
| – Percent of Open Interest Longs: | 17.0 | 50.8 | 14.4 |
| – Percent of Open Interest Shorts: | 15.1 | 60.1 | 6.9 |
| – Net Position: | 6,455 | -32,434 | 25,979 |
| – Gross Longs: | 59,340 | 177,626 | 50,210 |
| – Gross Shorts: | 52,885 | 210,060 | 24,231 |
| – Long to Short Ratio: | 1.1 to 1 | 0.8 to 1 | 2.1 to 1 |
| NET POSITION TREND: | |||
| – Strength Index Score (3 Year Range Pct): | 51.9 | 36.7 | 88.4 |
| – Strength Index Reading (3 Year Range): | Bullish | Bearish | Bullish-Extreme |
| NET POSITION MOVEMENT INDEX: | |||
| – 6-Week Change in Strength Index: | 4.2 | -10.3 | 23.6 |
Bloomberg Commodity Index Futures:
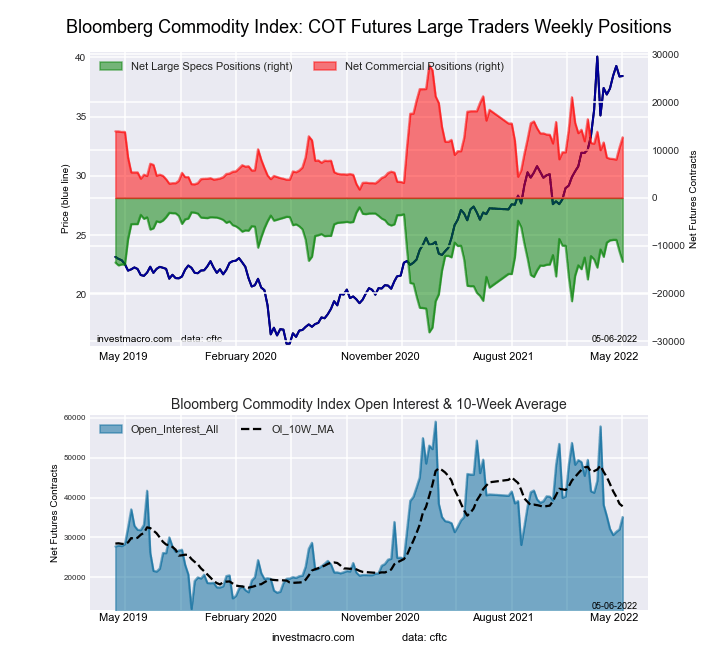 The Bloomberg Commodity Index Futures large speculator standing this week reached a net position of -13,354 contracts in the data reported through Tuesday. This was a weekly fall of -2,138 contracts from the previous week which had a total of -11,216 net contracts.
This week’s current strength score (the trader positioning range over the past three years, measured from 0 to 100) shows the speculators are currently Bullish with a score of 56.4 percent. The commercials are Bearish with a score of 42.0 percent and the small traders (not shown in chart) are Bearish with a score of 44.0 percent.
| Bloomberg Index Futures Statistics | SPECULATORS | COMMERCIALS | SMALL TRADERS |
| – Percent of Open Interest Longs: | 58.2 | 36.0 | 2.1 |
| – Percent of Open Interest Shorts: | 96.2 | 0.0 | 0.2 |
| – Net Position: | -13,354 | 12,665 | 689 |
| – Gross Longs: | 20,458 | 12,665 | 743 |
| – Gross Shorts: | 33,812 | 0 | 54 |
| – Long to Short Ratio: | 0.6 to 1 | inf to 1 | 13.8 to 1 |
| NET POSITION TREND: | |||
| – Strength Index Score (3 Year Range Pct): | 56.4 | 42.0 | 44.0 |
| – Strength Index Reading (3 Year Range): | Bullish | Bearish | Bearish |
| NET POSITION MOVEMENT INDEX: | |||
| – 6-Week Change in Strength Index: | -4.0 | 4.1 | -1.5 |
Article By InvestMacro – Receive our weekly COT Reports by Email
*COT Report: The COT data, released weekly to the public each Friday, is updated through the most recent Tuesday (data is 3 days old) and shows a quick view of how large speculators or non-commercials (for-profit traders) were positioned in the futures markets.
The CFTC categorizes trader positions according to commercial hedgers (traders who use futures contracts for hedging as part of the business), non-commercials (large traders who speculate to realize trading profits) and nonreportable traders (usually small traders/speculators) as well as their open interest (contracts open in the market at time of reporting).See CFTC criteria here.

- Investors run to safe-haven assets amid Middle East escalation Mar 6, 2026
- EUR/USD Under Pressure: Middle East Risks Outweigh All Else Mar 6, 2026
- Bitcoin shows resilience to Middle East events. Oil market stabilizes Mar 5, 2026
- GBP/USD: Market Not Expecting BoE Rate Cut in March Mar 5, 2026
- Brent headed for $100? Mar 4, 2026
- Global stock indices continue sell-off due to Middle East conflict Mar 4, 2026
- USD/JPY to Quickly Return to Growth: Momentum Favours the US Dollar Mar 4, 2026
- European equities plunge amid Persian Gulf military conflict Mar 3, 2026
- Gold Rallies for Fifth Day, With External Risks Mounting Mar 3, 2026
- Iran Crisis: A Dangerous Turning Point Mar 2, 2026