
By InvestMacro | COT | Data Tables | COT Leaders | Downloads | COT Newsletter
Here are the latest charts and statistics for the Commitment of Traders (COT) data published by the Commodities Futures Trading Commission (CFTC).
The latest COT data is updated through Tuesday April 19th and shows a quick view of how large traders (for-profit speculators and commercial entities) were positioned in the futures markets.
Highlighting the COT metals data is the recent decline in the Gold futures bets. The speculative net position in the Gold futures has fallen for two out of the past three weeks and in four out of the past six weeks. Previously, Gold speculator positions had added bullish bets for five consecutive weeks from February 8th through March 8th and brought the speculator bullish standing to the highest level in sixty-one weeks at +274,388 contracts.
The recent reduction in speculator bets and the slight cool off in the Gold price do not necessarily mean that sentiment for the shiny metal is turning. In fact, the Gold position may have greater heights in store as open interest levels have not recently touched any significant peak high (typically a surge of opinions and counter-opinions that can stop a trend especially at key levels) and the speculator strength level has not reached (or gotten close to) a bullish-extreme level (both of these levels can be signs of a top and exhaustion in trends). The net position for Gold, even after the recent weakness, remains above the 2022 weekly average of +230,004 contracts (the weekly average of all of 2021 was +204,623 contracts). So despite a rising interest rate environment (which may hurt or may help Gold), the combination of super-hot inflationary pressures, a war-time crisis and strong sentiment could help make Gold primed to stay on its bullish path.
Free Reports:
 Get our Weekly Commitment of Traders Reports - See where the biggest traders (Hedge Funds and Commercial Hedgers) are positioned in the futures markets on a weekly basis.
 Download Our Metatrader 4 Indicators – Put Our Free MetaTrader 4 Custom Indicators on your charts when you join our Weekly Newsletter
Overall, the markets with higher speculator bets this week were Silver (443 contracts) and Platinum (1,122 contracts).
The markets with declining speculator bets this week were Gold (-14,530 contracts), Copper (-4,510 contracts) and Palladium (-149 contracts).
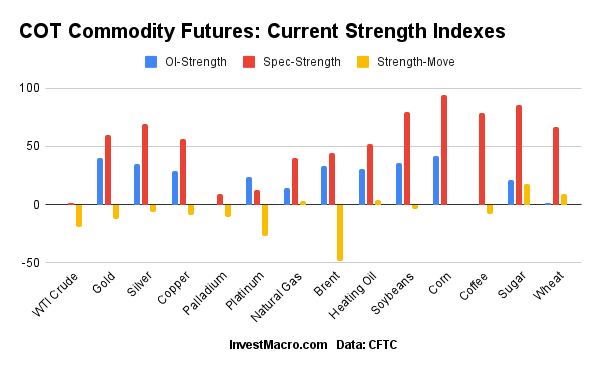 Speculator strength standings for each Commodity where strength index is current net position compared to past three years, above 80 is bullish extreme, below 20 is bearish extreme
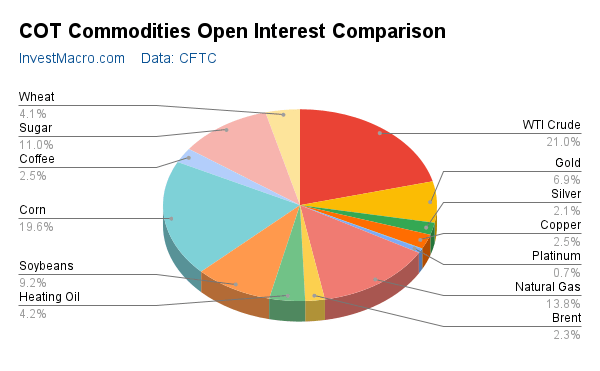
Apr-19-2022 | OI | OI-Index | Spec-Net | Spec-Index | Com-Net | COM-Index | Smalls-Net | Smalls-Index |
|---|---|---|---|---|---|---|---|---|
| WTI Crude | 1,740,300 | 0 | 307,697 | 1 | -351,252 | 100 | 43,555 | 76 |
| Corn | 1,625,198 | 42 | 500,612 | 94 | -456,269 | 7 | -44,343 | 18 |
| Natural Gas | 1,144,047 | 14 | -130,006 | 40 | 82,113 | 57 | 47,893 | 100 |
| Sugar | 909,622 | 21 | 239,515 | 86 | -295,470 | 12 | 55,955 | 77 |
| Soybeans | 762,855 | 36 | 200,098 | 80 | -174,873 | 25 | -25,225 | 28 |
| Gold | 575,202 | 40 | 239,757 | 60 | -275,525 | 37 | 35,768 | 66 |
| Heating Oil | 349,618 | 31 | 6,455 | 52 | -32,434 | 37 | 25,979 | 88 |
| Wheat | 337,038 | 1 | 23,245 | 67 | -20,425 | 21 | -2,820 | 98 |
| Coffee | 209,410 | 0 | 41,803 | 79 | -45,447 | 24 | 3,644 | 15 |
| Copper | 203,896 | 29 | 18,840 | 56 | -28,307 | 40 | 9,467 | 80 |
| Brent | 191,883 | 33 | -40,102 | 44 | 37,663 | 56 | 2,439 | 42 |
| Silver | 170,577 | 35 | 46,429 | 69 | -63,288 | 37 | 16,859 | 41 |
| Platinum | 61,603 | 24 | 7,537 | 13 | -13,812 | 89 | 6,275 | 50 |
| Palladium | 6,435 | 0 | -2,182 | 9 | 1,560 | 85 | 622 | 80 |
Gold Comex Futures:
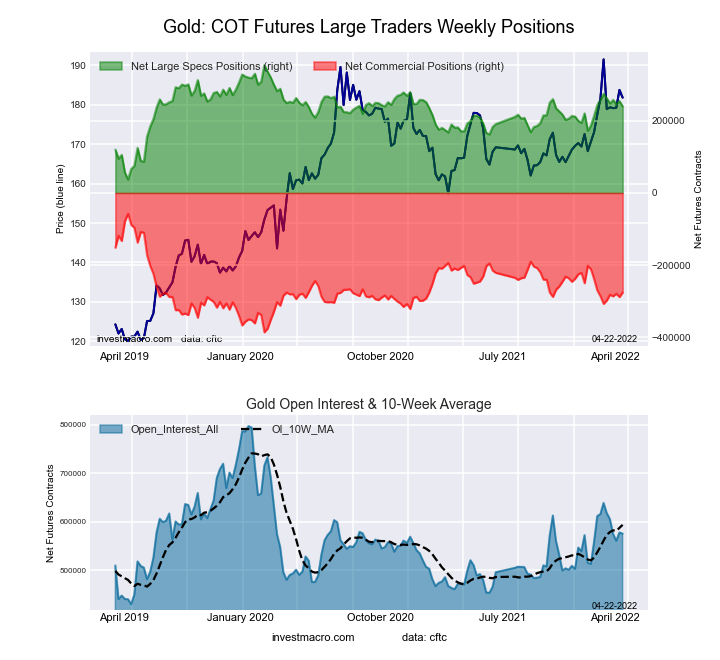 The Gold Comex Futures large speculator standing this week was a net position of 239,757 contracts in the data reported through Tuesday. This was a weekly decline of -14,530 contracts from the previous week which had a total of 254,287 net contracts.
This week’s current strength score (the trader positioning range over the past three years, measured from 0 to 100) shows the speculators are currently Bullish with a score of 60.4 percent. The commercials are Bearish with a score of 37.0 percent and the small traders (not shown in chart) are Bullish with a score of 65.7 percent.
| Gold Futures Statistics | SPECULATORS | COMMERCIALS | SMALL TRADERS |
| – Percent of Open Interest Longs: | 57.5 | 22.5 | 9.6 |
| – Percent of Open Interest Shorts: | 15.8 | 70.4 | 3.3 |
| – Net Position: | 239,757 | -275,525 | 35,768 |
| – Gross Longs: | 330,745 | 129,157 | 55,032 |
| – Gross Shorts: | 90,988 | 404,682 | 19,264 |
| – Long to Short Ratio: | 3.6 to 1 | 0.3 to 1 | 2.9 to 1 |
| NET POSITION TREND: | |||
| – Strength Index Score (3 Year Range Pct): | 60.4 | 37.0 | 65.7 |
| – Strength Index Reading (3 Year Range): | Bullish | Bearish | Bullish |
| NET POSITION MOVEMENT INDEX: | |||
| – 6-Week Change in Strength Index: | -12.0 | 10.6 | 9.1 |
Silver Comex Futures:
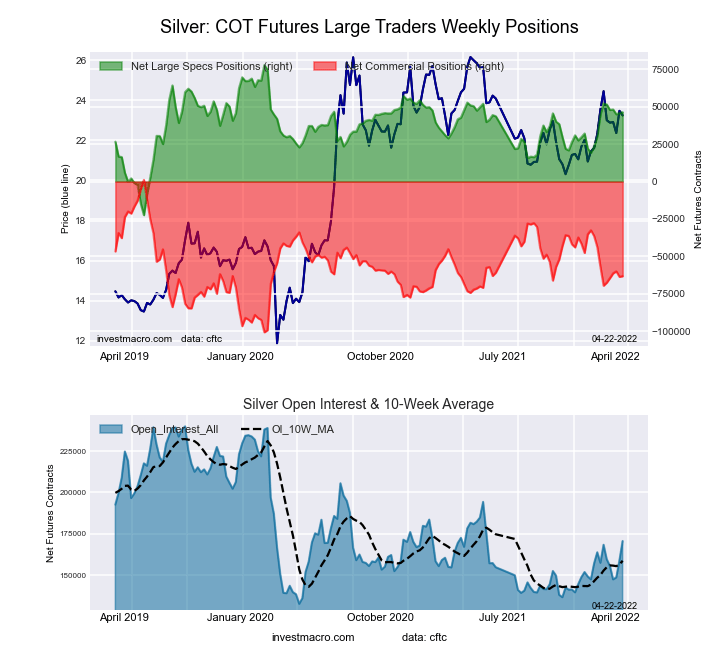 The Silver Comex Futures large speculator standing this week was a net position of 46,429 contracts in the data reported through Tuesday. This was a weekly increase of 443 contracts from the previous week which had a total of 45,986 net contracts.
This week’s current strength score (the trader positioning range over the past three years, measured from 0 to 100) shows the speculators are currently Bullish with a score of 68.6 percent. The commercials are Bearish with a score of 36.8 percent and the small traders (not shown in chart) are Bearish with a score of 41.0 percent.
| Silver Futures Statistics | SPECULATORS | COMMERCIALS | SMALL TRADERS |
| – Percent of Open Interest Longs: | 40.5 | 32.1 | 16.7 |
| – Percent of Open Interest Shorts: | 13.3 | 69.2 | 6.8 |
| – Net Position: | 46,429 | -63,288 | 16,859 |
| – Gross Longs: | 69,088 | 54,719 | 28,471 |
| – Gross Shorts: | 22,659 | 118,007 | 11,612 |
| – Long to Short Ratio: | 3.0 to 1 | 0.5 to 1 | 2.5 to 1 |
| NET POSITION TREND: | |||
| – Strength Index Score (3 Year Range Pct): | 68.6 | 36.8 | 41.0 |
| – Strength Index Reading (3 Year Range): | Bullish | Bearish | Bearish |
| NET POSITION MOVEMENT INDEX: | |||
| – 6-Week Change in Strength Index: | -5.9 | 6.2 | -2.6 |
Copper Grade #1 Futures:
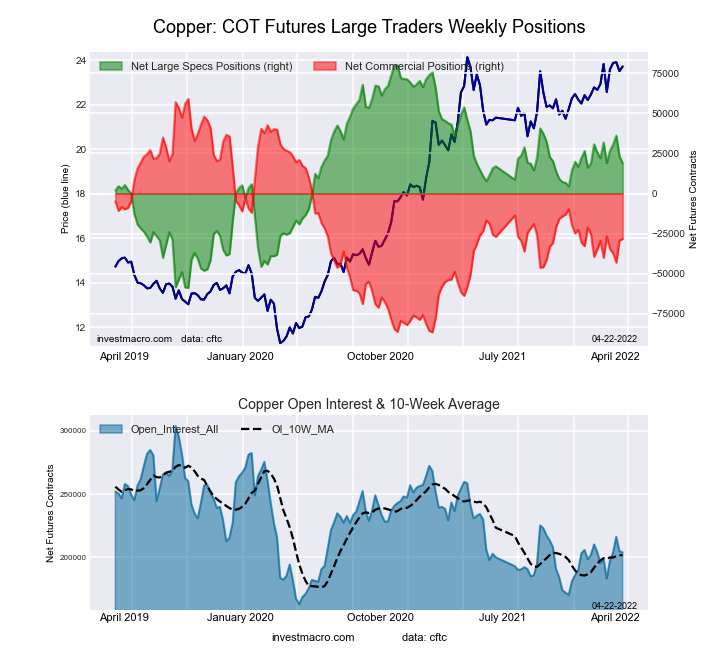 The Copper Grade #1 Futures large speculator standing this week was a net position of 18,840 contracts in the data reported through Tuesday. This was a weekly fall of -4,510 contracts from the previous week which had a total of 23,350 net contracts.
This week’s current strength score (the trader positioning range over the past three years, measured from 0 to 100) shows the speculators are currently Bullish with a score of 55.9 percent. The commercials are Bearish with a score of 40.0 percent and the small traders (not shown in chart) are Bullish-Extreme with a score of 80.0 percent.
| Copper Futures Statistics | SPECULATORS | COMMERCIALS | SMALL TRADERS |
| – Percent of Open Interest Longs: | 40.8 | 39.4 | 10.1 |
| – Percent of Open Interest Shorts: | 31.6 | 53.3 | 5.4 |
| – Net Position: | 18,840 | -28,307 | 9,467 |
| – Gross Longs: | 83,261 | 80,280 | 20,538 |
| – Gross Shorts: | 64,421 | 108,587 | 11,071 |
| – Long to Short Ratio: | 1.3 to 1 | 0.7 to 1 | 1.9 to 1 |
| NET POSITION TREND: | |||
| – Strength Index Score (3 Year Range Pct): | 55.9 | 40.0 | 80.0 |
| – Strength Index Reading (3 Year Range): | Bullish | Bearish | Bullish-Extreme |
| NET POSITION MOVEMENT INDEX: | |||
| – 6-Week Change in Strength Index: | -9.3 | 8.1 | 7.0 |
Platinum Futures:
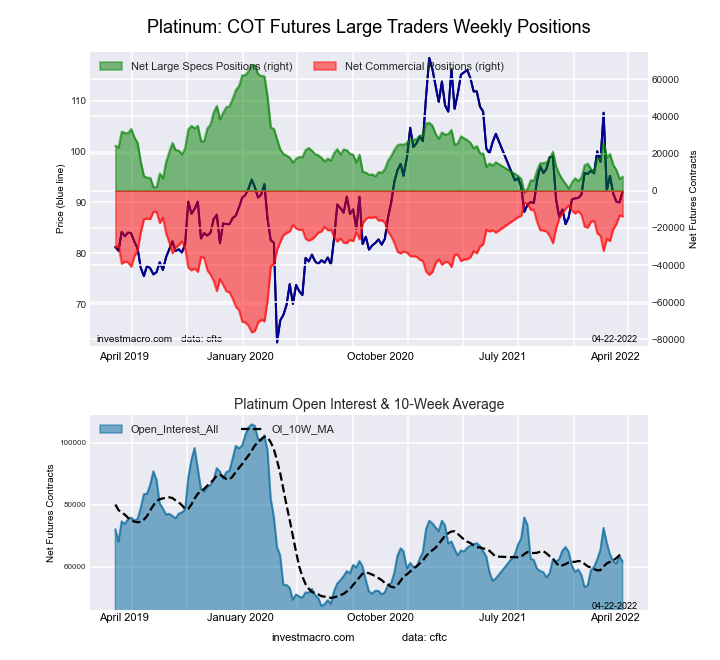 The Platinum Futures large speculator standing this week was a net position of 7,537 contracts in the data reported through Tuesday. This was a weekly increase of 1,122 contracts from the previous week which had a total of 6,415 net contracts.
This week’s current strength score (the trader positioning range over the past three years, measured from 0 to 100) shows the speculators are currently Bearish-Extreme with a score of 12.5 percent. The commercials are Bullish-Extreme with a score of 89.3 percent and the small traders (not shown in chart) are Bearish with a score of 49.6 percent.
| Platinum Futures Statistics | SPECULATORS | COMMERCIALS | SMALL TRADERS |
| – Percent of Open Interest Longs: | 45.9 | 35.1 | 15.0 |
| – Percent of Open Interest Shorts: | 33.7 | 57.5 | 4.8 |
| – Net Position: | 7,537 | -13,812 | 6,275 |
| – Gross Longs: | 28,293 | 21,617 | 9,250 |
| – Gross Shorts: | 20,756 | 35,429 | 2,975 |
| – Long to Short Ratio: | 1.4 to 1 | 0.6 to 1 | 3.1 to 1 |
| NET POSITION TREND: | |||
| – Strength Index Score (3 Year Range Pct): | 12.5 | 89.3 | 49.6 |
| – Strength Index Reading (3 Year Range): | Bearish-Extreme | Bullish-Extreme | Bearish |
| NET POSITION MOVEMENT INDEX: | |||
| – 6-Week Change in Strength Index: | -26.6 | 26.6 | -3.5 |
Palladium Futures:
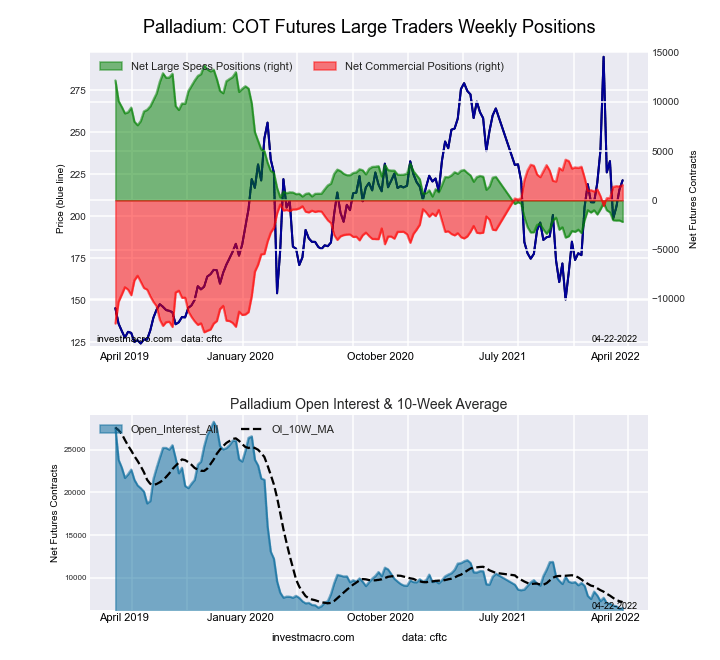 The Palladium Futures large speculator standing this week was a net position of -2,182 contracts in the data reported through Tuesday. This was a weekly reduction of -149 contracts from the previous week which had a total of -2,033 net contracts.
This week’s current strength score (the trader positioning range over the past three years, measured from 0 to 100) shows the speculators are currently Bearish-Extreme with a score of 9.1 percent. The commercials are Bullish-Extreme with a score of 85.4 percent and the small traders (not shown in chart) are Bullish with a score of 79.9 percent.
| Palladium Futures Statistics | SPECULATORS | COMMERCIALS | SMALL TRADERS |
| – Percent of Open Interest Longs: | 22.9 | 55.5 | 21.0 |
| – Percent of Open Interest Shorts: | 56.8 | 31.3 | 11.3 |
| – Net Position: | -2,182 | 1,560 | 622 |
| – Gross Longs: | 1,475 | 3,573 | 1,349 |
| – Gross Shorts: | 3,657 | 2,013 | 727 |
| – Long to Short Ratio: | 0.4 to 1 | 1.8 to 1 | 1.9 to 1 |
| NET POSITION TREND: | |||
| – Strength Index Score (3 Year Range Pct): | 9.1 | 85.4 | 79.9 |
| – Strength Index Reading (3 Year Range): | Bearish-Extreme | Bullish-Extreme | Bullish |
| NET POSITION MOVEMENT INDEX: | |||
| – 6-Week Change in Strength Index: | -10.9 | 12.1 | -12.3 |
Article By InvestMacro – Receive our weekly COT Reports by Email
*COT Report: The COT data, released weekly to the public each Friday, is updated through the most recent Tuesday (data is 3 days old) and shows a quick view of how large speculators or non-commercials (for-profit traders) were positioned in the futures markets.
The CFTC categorizes trader positions according to commercial hedgers (traders who use futures contracts for hedging as part of the business), non-commercials (large traders who speculate to realize trading profits) and nonreportable traders (usually small traders/speculators) as well as their open interest (contracts open in the market at time of reporting).See CFTC criteria here.

- It Looks Like Its a Good Time To Buy This Gold Stock Mar 28, 2025
- Copper Co. Should Be Up Way Higher Mar 28, 2025
- Banxico cut the rate by 0.5%. The global auto market is under pressure from the introduction of tariffs. Mar 28, 2025
- The Pound Stands Strong Amid Global Trade Tensions Mar 28, 2025
- Uncertainty over the scope and impact of tariffs increased market volatility Mar 27, 2025
- EUR/USD Faces Further Decline Amid Market Jitters and Trump’s Tariff Threat Mar 27, 2025
- Australia’s inflation rate is at a 3-month low. Oil prices are approaching $70 again Mar 26, 2025
- USD/JPY Rises Again: Yen Lacks Support as Bulls Take Control Mar 26, 2025
- Oil prices rise amid a new OPEC+ plan to cut production. Inflation in Singapore continues to weaken. Mar 24, 2025
- SNB cut the interest rate to 0.25%. Inflationary pressures are easing in Hong Kong and Malaysia Mar 21, 2025