
It was another volatile day for financial markets as geopolitical developments influenced global risk sentiment.
Stocks rallied, the dollar softened and oil prices weakened on the prospects of peace talks between Russia and Ukraine. There was plenty of action in the FX space as major currency pairs reacted to a weakening dollar, while gold and other safe-haven assets struggled to shine amid the improving market mood. Later this evening, the Federal Reserve is widely expected to raise interest rates for the first time since 2018 which could lend some support to the greenback.
Today, our focus will be on G10 currencies. As you have already figured out, our tool of choice is technical analysis.
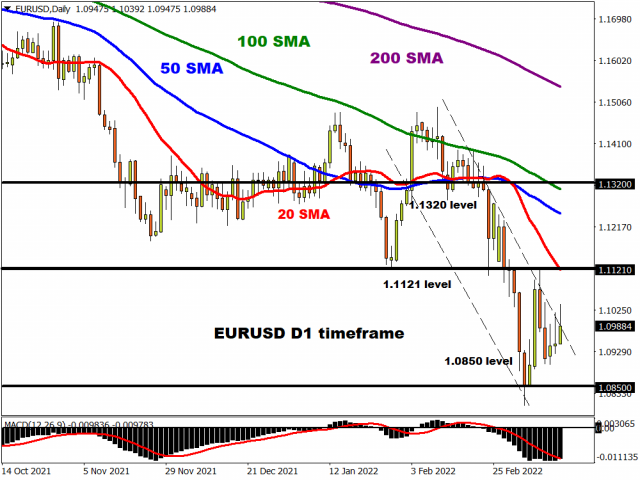
EURUSD experiencing a pullback?
The EURUSD remains in a downtrend on the daily charts. There have been consistently lower lows and lower highs while the MACD trades below zero. Price action suggests that the currency could be experiencing a minor pullback before bears target 1.0850 and lower. A breakout above 1.1121 could signal an incline towards 1.1320.
Free Reports:
 Get our Weekly Commitment of Traders Reports - See where the biggest traders (Hedge Funds and Commercial Hedgers) are positioned in the futures markets on a weekly basis.
 Sign Up for Our Stock Market Newsletter – Get updated on News, Charts & Rankings of Public Companies when you join our Stocks Newsletter
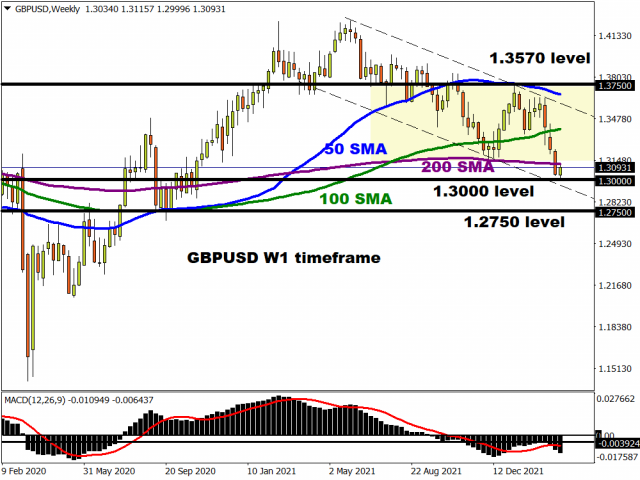
GBPUSD remains bearish on weekly
Pound bears remain in control on the weekly charts with prices respecting a bearish channel. The currency could experience a technical rebound from the 1.3000 support level before resuming the current downtrend. Bulls also need to overcome the 200-week Simple Moving Average which can be found around 1.3120. Fundamental factors in the form of the Fed & BoE policy meeting could play a role in where the currency pair concludes this week. Should 1.3000 prove to be unreliable support, a decline back towards 1.2750 could be on the cards.
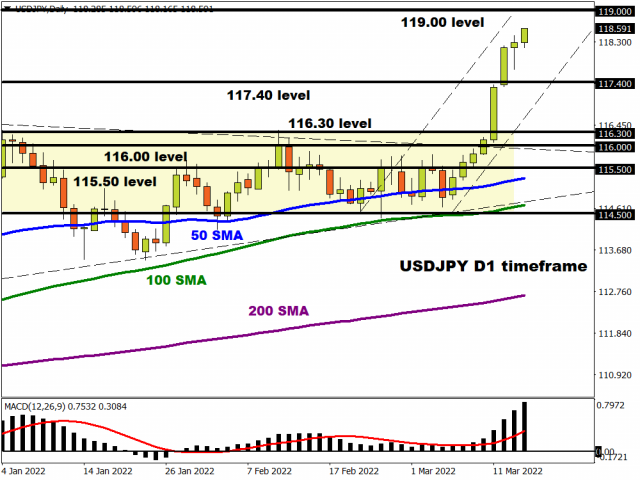
USDJPY hits fresh 5-year highs
A weaker Yen propelled the USDJPYto a fresh 5 year high today with prices approaching the 119.00 level. Prices a heavily bullish on the daily charts with the path of least resistance pointing north. A solid break above 119.00 could inspire a move towards levels not seen since February 2016 around 121.00. If the upside momentum runs of out steam, prices may decline back towards 117.40.
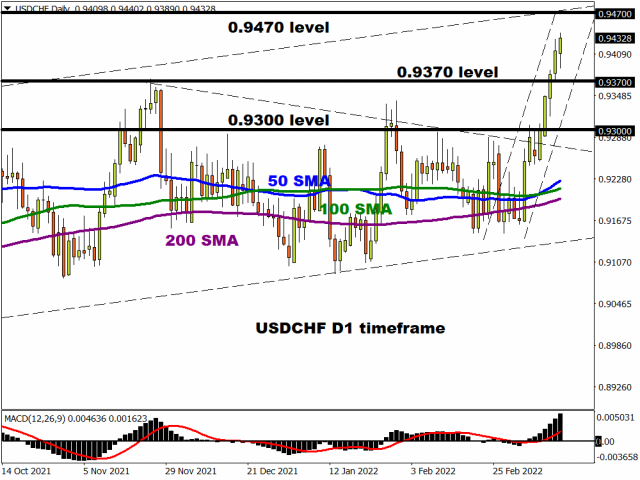
USDCHF bulls in the building
A chart can say 1000 words. Taking a look at the USDCHF, bulls are clearly in control and are eyeing 0.9470. Beyond this level, key points of interest can be found at 0.9500 and 0.9620. Should 0.9470 prove to be reliable resistance, prices could slip back towards 0.9370 and 0.9300.
Disclaimer: The content in this article comprises personal opinions and should not be construed as containing personal and/or other investment advice and/or an offer of and/or solicitation for any transactions in financial instruments and/or a guarantee and/or prediction of future performance. ForexTime (FXTM), its affiliates, agents, directors, officers or employees do not guarantee the accuracy, validity, timeliness or completeness, of any information or data made available and assume no liability as to any loss arising from any investment based on the same.
![]() Article by ForexTime
Article by ForexTime
ForexTime Ltd (FXTM) is an award winning international online forex broker regulated by CySEC 185/12 www.forextime.com

- The US introduces new import tariffs for 60 countries. Brent crude surpasses $100 per barrel Jul 24, 2026
- USD/JPY Breaks Records: Nothing Slows the Yen’s Decline Jul 24, 2026
- Oil prices reached a 6‑week high. The AUD strengthened on the back of a strong labor‑market report Jul 23, 2026
- EUR/USD Recovers as Dollar Weakens Jul 23, 2026
- Bitcoin rose to $66,000. The New Zealand dollar continues to strengthen Jul 22, 2026
- Inflationary pressure is easing in Canada. In New Zealand, on the contrary, inflation is rising Jul 21, 2026
- GBP/USD Falls After Cabinet Changes Jul 21, 2026
- Geopolitical and macroeconomic conditions continue to pressure market sentiment Jul 20, 2026
- USD/JPY Poised to Continue Gains as Expensive Oil and Lack of Support Weigh on Yen Jul 20, 2026
- COT Metals Charts: Weekly Speculator Bets led by Copper & Steel Jul 18, 2026