
By InvestMacro | COT | Data Tables | COT Leaders | Downloads | COT Newsletter
Here are the latest charts and statistics for the Commitment of Traders (COT) data published by the Commodities Futures Trading Commission (CFTC).
The latest COT data is updated through Tuesday March 22nd and shows a quick view of how large traders (for-profit speculators and commercial entities) were positioned in the futures markets.
Highlighting the COT metals data is the recent rise in the Copper futures bets. The speculative net position in the Copper futures gained by over +7,700 contracts this week and pushed the current standing back above the +20,000 contract level for the fifth time in the past six weeks. The speculator position had retreated last week by over -12,000 contracts and dropped the standing below the +20,000 contract threshold for the first time since the beginning of February. Copper speculator positioning has now been in a continuous bullish level since June 6th of 2020, a span of ninety-four consecutive weeks. The Copper strength index (the current positioning compared to the speculator positioning of the past three years) has a score slightly above the middle of its range at a 61.7 percent and shows that Copper sentiment is bullish but not currently near the top of its range.
Joining Copper (7,782 contracts) in rising this week was just Platinum (1,883 contracts) while Gold (-13,756 contracts), Silver (-3,607 contracts) and Palladium (-199 contracts) all saw speculator contracts decline for the week.
| Mar-22-2022 | OI | OI-Index | Spec-Net | Spec-Index | Com-Net | COM-Index | Smalls-Net | Smalls-Index |
|---|---|---|---|---|---|---|---|---|
| WTI Crude | 1,788,211 | 0 | 339,969 | 3 | -380,080 | 91 | 40,111 | 72 |
| Gold | 605,191 | 48 | 248,032 | 67 | -281,595 | 32 | 33,563 | 59 |
| Silver | 155,456 | 21 | 47,947 | 70 | -64,557 | 36 | 16,610 | 40 |
| Copper | 197,244 | 24 | 26,812 | 62 | -34,604 | 36 | 7,792 | 70 |
| Palladium | 6,948 | 2 | -1,208 | 15 | 238 | 78 | 970 | 100 |
| Platinum | 64,000 | 29 | 19,815 | 30 | -27,047 | 70 | 7,232 | 63 |
| Natural Gas | 1,085,676 | 1 | -149,337 | 34 | 107,446 | 65 | 41,891 | 85 |
| Brent | 191,138 | 32 | -24,666 | 70 | 22,639 | 31 | 2,027 | 37 |
| Heating Oil | 349,618 | 31 | 6,455 | 52 | -32,434 | 37 | 25,979 | 88 |
| Soybeans | 754,382 | 34 | 218,636 | 84 | -193,646 | 20 | -24,990 | 29 |
| Corn | 1,526,201 | 25 | 519,356 | 96 | -470,715 | 5 | -48,641 | 15 |
| Coffee | 222,172 | 1 | 41,851 | 79 | -45,824 | 24 | 3,973 | 16 |
| Sugar | 817,462 | 0 | 155,796 | 69 | -194,333 | 31 | 38,537 | 55 |
| Wheat | 345,345 | 5 | 9,490 | 55 | -7,030 | 34 | -2,460 | 100 |
Free Reports:
 Download Our Metatrader 4 Indicators – Put Our Free MetaTrader 4 Custom Indicators on your charts when you join our Weekly Newsletter
 Get our Weekly Commitment of Traders Reports - See where the biggest traders (Hedge Funds and Commercial Hedgers) are positioned in the futures markets on a weekly basis.
Gold Comex Futures:
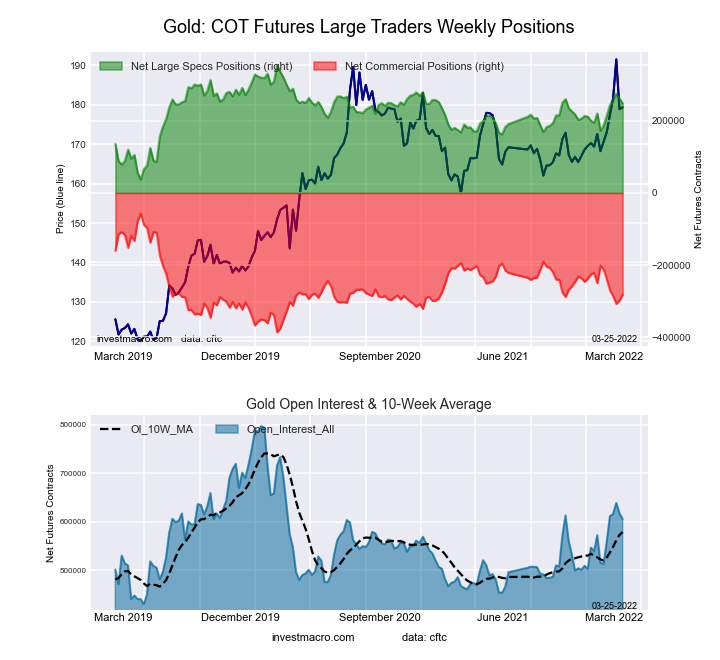 The Gold Comex Futures large speculator standing this week was a net position of 248,032 contracts in the data reported through Tuesday. This was a weekly decrease of -13,756 contracts from the previous week which had a total of 261,788 net contracts.
This week’s current strength score (the trader positioning range over the past three years, measured from 0 to 100) shows the speculators are currently Bullish with a score of 66.6 percent. The commercials are Bearish with a score of 31.7 percent and the small traders (not shown in chart) are Bullish with a score of 59.5 percent.
| Gold Futures Statistics | SPECULATORS | COMMERCIALS | SMALL TRADERS |
| – Percent of Open Interest Longs: | 54.3 | 25.6 | 8.8 |
| – Percent of Open Interest Shorts: | 13.3 | 72.1 | 3.3 |
| – Net Position: | 248,032 | -281,595 | 33,563 |
| – Gross Longs: | 328,660 | 155,039 | 53,441 |
| – Gross Shorts: | 80,628 | 436,634 | 19,878 |
| – Long to Short Ratio: | 4.1 to 1 | 0.4 to 1 | 2.7 to 1 |
| NET POSITION TREND: | |||
| – Strength Index Score (3 Year Range Pct): | 66.6 | 31.7 | 59.5 |
| – Strength Index Reading (3 Year Range): | Bullish | Bearish | Bullish |
| NET POSITION MOVEMENT INDEX: | |||
| – 6-Week Change in Strength Index: | 19.4 | -21.4 | 25.1 |
Silver Comex Futures:
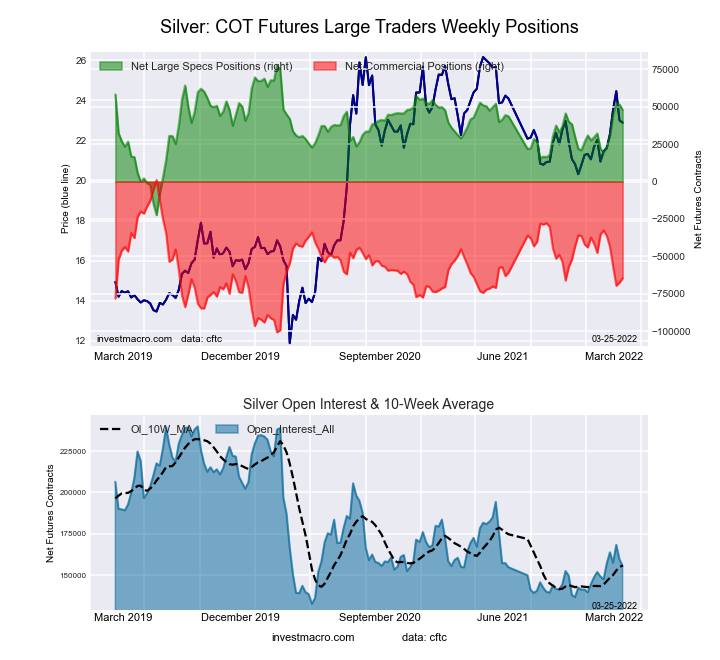 The Silver Comex Futures large speculator standing this week was a net position of 47,947 contracts in the data reported through Tuesday. This was a weekly fall of -3,607 contracts from the previous week which had a total of 51,554 net contracts.
This week’s current strength score (the trader positioning range over the past three years, measured from 0 to 100) shows the speculators are currently Bullish with a score of 70.2 percent. The commercials are Bearish with a score of 35.5 percent and the small traders (not shown in chart) are Bearish with a score of 39.6 percent.
| Silver Futures Statistics | SPECULATORS | COMMERCIALS | SMALL TRADERS |
| – Percent of Open Interest Longs: | 44.6 | 28.5 | 17.3 |
| – Percent of Open Interest Shorts: | 13.7 | 70.0 | 6.6 |
| – Net Position: | 47,947 | -64,557 | 16,610 |
| – Gross Longs: | 69,279 | 44,270 | 26,925 |
| – Gross Shorts: | 21,332 | 108,827 | 10,315 |
| – Long to Short Ratio: | 3.2 to 1 | 0.4 to 1 | 2.6 to 1 |
| NET POSITION TREND: | |||
| – Strength Index Score (3 Year Range Pct): | 70.2 | 35.5 | 39.6 |
| – Strength Index Reading (3 Year Range): | Bullish | Bearish | Bearish |
| NET POSITION MOVEMENT INDEX: | |||
| – 6-Week Change in Strength Index: | 28.6 | -31.4 | 19.4 |
Copper Grade #1 Futures:
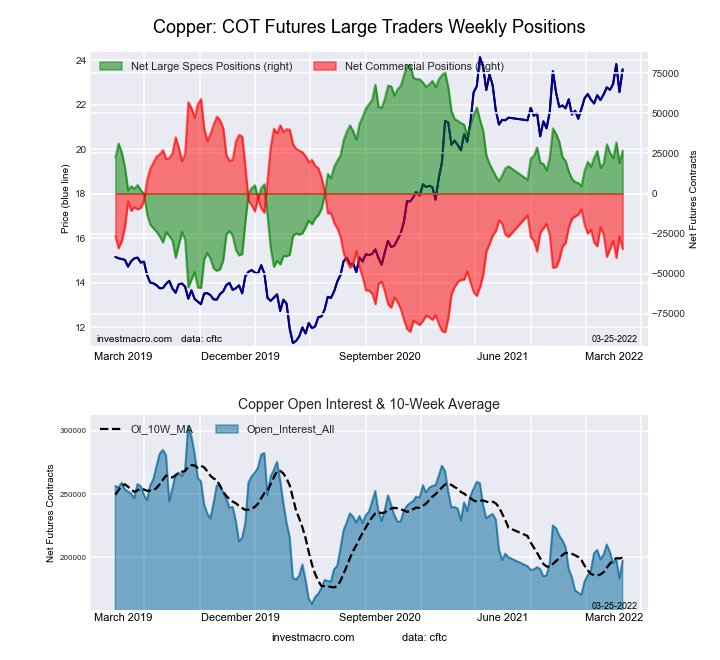 The Copper Grade #1 Futures large speculator standing this week was a net position of 26,812 contracts in the data reported through Tuesday. This was a weekly advance of 7,782 contracts from the previous week which had a total of 19,030 net contracts.
This week’s current strength score (the trader positioning range over the past three years, measured from 0 to 100) shows the speculators are currently Bullish with a score of 61.7 percent. The commercials are Bearish with a score of 35.7 percent and the small traders (not shown in chart) are Bullish with a score of 70.3 percent.
| Copper Futures Statistics | SPECULATORS | COMMERCIALS | SMALL TRADERS |
| – Percent of Open Interest Longs: | 41.3 | 41.5 | 9.4 |
| – Percent of Open Interest Shorts: | 27.7 | 59.1 | 5.5 |
| – Net Position: | 26,812 | -34,604 | 7,792 |
| – Gross Longs: | 81,523 | 81,894 | 18,568 |
| – Gross Shorts: | 54,711 | 116,498 | 10,776 |
| – Long to Short Ratio: | 1.5 to 1 | 0.7 to 1 | 1.7 to 1 |
| NET POSITION TREND: | |||
| – Strength Index Score (3 Year Range Pct): | 61.7 | 35.7 | 70.3 |
| – Strength Index Reading (3 Year Range): | Bullish | Bearish | Bullish |
| NET POSITION MOVEMENT INDEX: | |||
| – 6-Week Change in Strength Index: | 5.7 | -6.2 | 6.5 |
Platinum Futures:
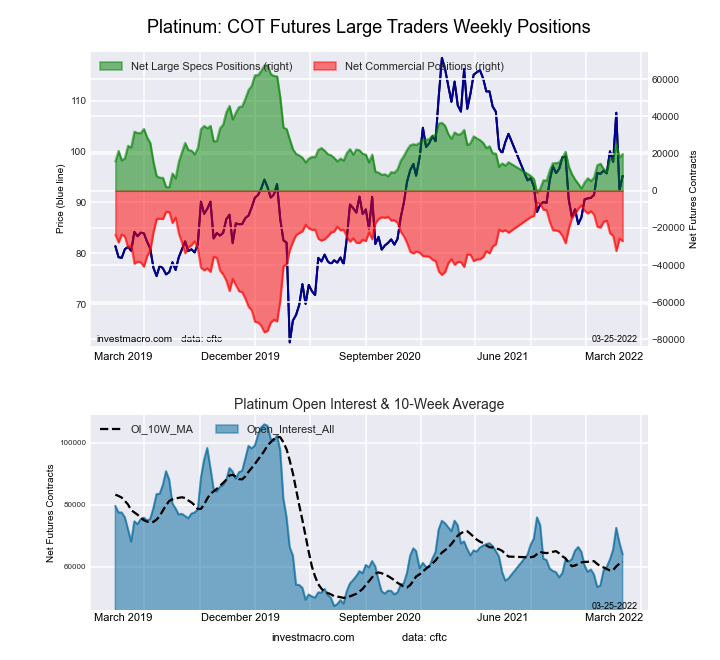 The Platinum Futures large speculator standing this week was a net position of 19,815 contracts in the data reported through Tuesday. This was a weekly advance of 1,883 contracts from the previous week which had a total of 17,932 net contracts.
This week’s current strength score (the trader positioning range over the past three years, measured from 0 to 100) shows the speculators are currently Bearish with a score of 30.4 percent. The commercials are Bullish with a score of 70.3 percent and the small traders (not shown in chart) are Bullish with a score of 62.9 percent.
| Platinum Futures Statistics | SPECULATORS | COMMERCIALS | SMALL TRADERS |
| – Percent of Open Interest Longs: | 50.3 | 30.0 | 15.4 |
| – Percent of Open Interest Shorts: | 19.3 | 72.3 | 4.2 |
| – Net Position: | 19,815 | -27,047 | 7,232 |
| – Gross Longs: | 32,184 | 19,220 | 9,888 |
| – Gross Shorts: | 12,369 | 46,267 | 2,656 |
| – Long to Short Ratio: | 2.6 to 1 | 0.4 to 1 | 3.7 to 1 |
| NET POSITION TREND: | |||
| – Strength Index Score (3 Year Range Pct): | 30.4 | 70.3 | 62.9 |
| – Strength Index Reading (3 Year Range): | Bearish | Bullish | Bullish |
| NET POSITION MOVEMENT INDEX: | |||
| – 6-Week Change in Strength Index: | 11.7 | -14.9 | 32.9 |
Palladium Futures:
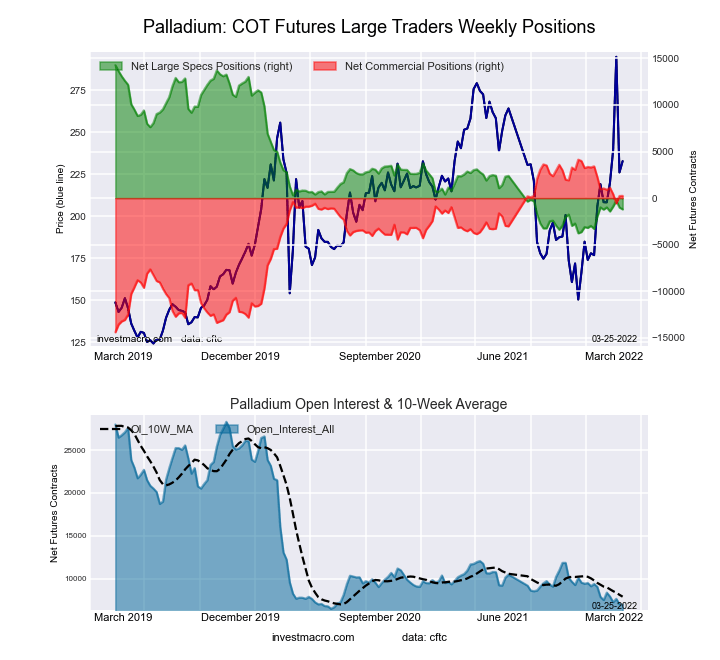 The Palladium Futures large speculator standing this week was a net position of -1,208 contracts in the data reported through Tuesday. This was a weekly reduction of -199 contracts from the previous week which had a total of -1,009 net contracts.
This week’s current strength score (the trader positioning range over the past three years, measured from 0 to 100) shows the speculators are currently Bearish-Extreme with a score of 14.7 percent. The commercials are Bullish with a score of 77.8 percent and the small traders (not shown in chart) are Bullish-Extreme with a score of 100.0 percent.
| Palladium Futures Statistics | SPECULATORS | COMMERCIALS | SMALL TRADERS |
| – Percent of Open Interest Longs: | 28.4 | 46.3 | 24.0 |
| – Percent of Open Interest Shorts: | 45.8 | 42.8 | 10.0 |
| – Net Position: | -1,208 | 238 | 970 |
| – Gross Longs: | 1,973 | 3,214 | 1,665 |
| – Gross Shorts: | 3,181 | 2,976 | 695 |
| – Long to Short Ratio: | 0.6 to 1 | 1.1 to 1 | 2.4 to 1 |
| NET POSITION TREND: | |||
| – Strength Index Score (3 Year Range Pct): | 14.7 | 77.8 | 100.0 |
| – Strength Index Reading (3 Year Range): | Bearish-Extreme | Bullish | Bullish-Extreme |
| NET POSITION MOVEMENT INDEX: | |||
| – 6-Week Change in Strength Index: | 0.1 | -4.6 | 44.8 |
Article By InvestMacro – Receive our weekly COT Reports by Email
*COT Report: The COT data, released weekly to the public each Friday, is updated through the most recent Tuesday (data is 3 days old) and shows a quick view of how large speculators or non-commercials (for-profit traders) were positioned in the futures markets.
The CFTC categorizes trader positions according to commercial hedgers (traders who use futures contracts for hedging as part of the business), non-commercials (large traders who speculate to realize trading profits) and nonreportable traders (usually small traders/speculators) as well as their open interest (contracts open in the market at time of reporting).See CFTC criteria here.

- COT Metals Charts: Weekly Speculator Bets led by Copper & Steel Jul 18, 2026
- COT Bonds Charts: Weekly Speculator Bets led by 2-Year, SOFR 3M & 5-Year Bonds Jul 18, 2026
- COT Energy Charts: Weekly Speculator Bets led by Brent Oil & Heating Oil Jul 18, 2026
- COT Soft Commodities Charts: Weekly Speculator Bets led by Wheat, Corn & Soybean Meal Jul 18, 2026
- The Bank of Canada kept its interest rate unchanged. Platinum prices reached a three‑week high Jul 16, 2026
- Stock indices rose after the release of US inflation data. China’s GDP slowed sharply Jul 15, 2026
- GBP/USD Awaits Political News: What Will Happen Next Jul 15, 2026
- USD/JPY Holds at Highs: Pressure Lingers on Yen Jul 14, 2026
- Oil prices jumped 4% amid a new wave of escalation between the US and Iran Jul 13, 2026
- EUR/USD: US Inflation Will Determine Everything Jul 13, 2026