
By Orbex
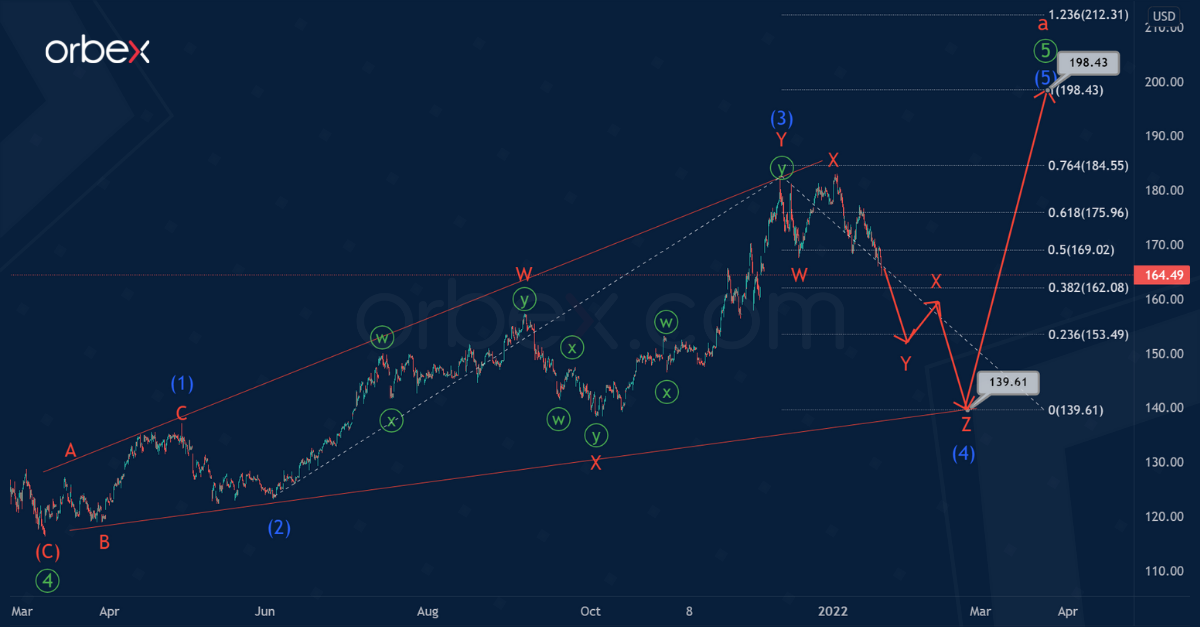
The current AAPL structure shows the construction of a primary fifth wave. This takes the form of an ending diagonal (1)-(2)-(3)-(4)-(5) of the intermediate degree. The wave ⑤ is the final part in the cycle impulse a.
It is likely that we are now in the initial part of a bearish correction wave (4).
There is a possibility that the price within the correction (4) will fall to the support level of 137.18, located on the lower red line. This could take the form of a minor triple zigzag, as shown on the chart.
After reaching the specified price mark, the market can push off and start moving in the opposite direction in the intermediate wave (5) in the direction of the 198.43 level. At that level, intermediate waves (3) and (5) will be equal.
Free Reports:
 Sign Up for Our Stock Market Newsletter – Get updated on News, Charts & Rankings of Public Companies when you join our Stocks Newsletter
 Get our Weekly Commitment of Traders Reports - See where the biggest traders (Hedge Funds and Commercial Hedgers) are positioned in the futures markets on a weekly basis.
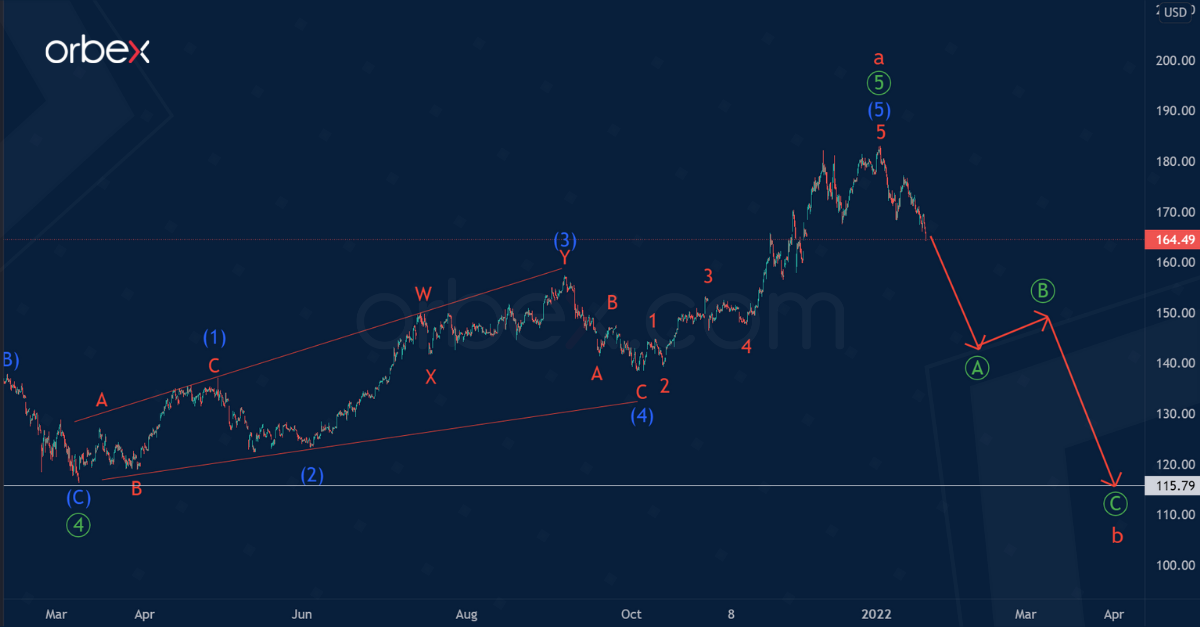
An alternative scenario shows the ending diagonal has fully completed its pattern, and with it, the entire cycle wave a.
In this case, prices could then lower in a cycle correction b, which could take the form of a standard zigzag Ⓐ-Ⓑ-Ⓒ to 115.79. Its approximate structure is shown by red trend lines.
![]() Article by Orbex
Article by Orbex
Orbex is a fully licensed broker that was established in 2011. Founded with a mission to serve its traders responsibly and provides traders with access to the world’s largest and most liquid financial markets. www.orbex.com

- COT Metals Charts: Weekly Speculator Bets led by Copper & Steel Jul 18, 2026
- COT Bonds Charts: Weekly Speculator Bets led by 2-Year, SOFR 3M & 5-Year Bonds Jul 18, 2026
- COT Energy Charts: Weekly Speculator Bets led by Brent Oil & Heating Oil Jul 18, 2026
- COT Soft Commodities Charts: Weekly Speculator Bets led by Wheat, Corn & Soybean Meal Jul 18, 2026
- The Bank of Canada kept its interest rate unchanged. Platinum prices reached a three‑week high Jul 16, 2026
- Stock indices rose after the release of US inflation data. China’s GDP slowed sharply Jul 15, 2026
- GBP/USD Awaits Political News: What Will Happen Next Jul 15, 2026
- USD/JPY Holds at Highs: Pressure Lingers on Yen Jul 14, 2026
- Oil prices jumped 4% amid a new wave of escalation between the US and Iran Jul 13, 2026
- EUR/USD: US Inflation Will Determine Everything Jul 13, 2026