By InvestMacro | COT | Data Tables | COT Leaders | Downloads | COT Newsletter
Here are the latest charts and statistics for the Commitment of Traders (COT) data published by the Commodities Futures Trading Commission (CFTC).
The latest COT data is updated through Tuesday December 7th 2021 and shows a quick view of how large traders (for-profit speculators and commercial entities) were positioned in the futures markets.
Highlighting this week’s COT bonds data is the gains in the 2-Year Bond that brings speculator positioning to the highest level in seventeen weeks. The speculative position in the 2-Year has risen for two consecutive weeks and for six out of the past seven weeks as well. This bullishness has brought the net position out of bearish territory for a second week and pushed the current net position to the best level since August 10th. This week’s net positioning is also the second highest level of the past three years which equates to a 99.5 percent strength score (current level compared to past three years of data).
Joining the 2-Year Bond (16,935 contracts) in gaining this week are 10-Year (46,365 contracts), Ultra 10-Year (4,727 contracts), Long US Bond (3,118 contracts), Ultra US Bond (20,142 contracts) while the declining positions this week were in the FedFunds (-14,841 contracts), 5-Year (-19,699 contracts) and the Eurodollar (-253,207 contracts).
Dec-07-2021 | OI | OI-Index | Spec-Net | Spec-Index | Com-Net | COM-Index | Smalls-Net | Smalls-Index |
|---|---|---|---|---|---|---|---|---|
| Eurodollar | 12,241,710 | 71 | -1,374,863 | 18 | 1,849,419 | 82 | -474,556 | 15 |
| 10-Year | 3,788,362 | 50 | -267,006 | 31 | 538,925 | 89 | -271,919 | 15 |
| 5-Year | 3,532,357 | 23 | -387,531 | 12 | 626,885 | 99 | -239,354 | 15 |
| 2-Year | 1,887,954 | 4 | 32,605 | 100 | 21,757 | 25 | -54,362 | 2 |
| FedFunds | 1,338,244 | 26 | -113,319 | 26 | 119,740 | 74 | -6,421 | 47 |
| Long T-Bond | 1,211,685 | 51 | -46,522 | 77 | 25,038 | 28 | 21,484 | 70 |
Free Reports:
 Download Our Metatrader 4 Indicators – Put Our Free MetaTrader 4 Custom Indicators on your charts when you join our Weekly Newsletter
 Get our Weekly Commitment of Traders Reports - See where the biggest traders (Hedge Funds and Commercial Hedgers) are positioned in the futures markets on a weekly basis.
3-Month Eurodollars Futures:
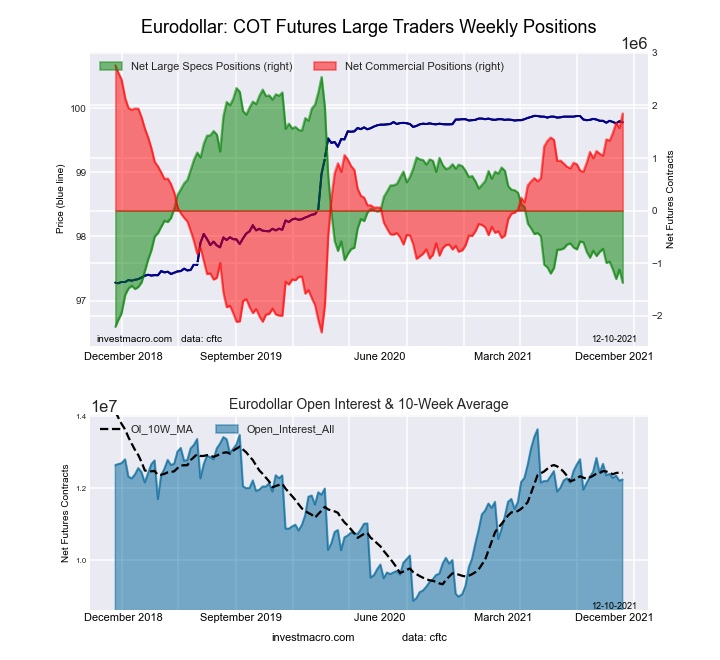 The 3-Month Eurodollars large speculator standing this week recorded a net position of -1,374,863 contracts in the data reported through Tuesday. This was a weekly fall of -253,207 contracts from the previous week which had a total of -1,121,656 net contracts.
This week’s current strength score (the trader positioning range over the past three years, measured from 0 to 100) shows the speculators are currently Bearish-Extreme with a score of 17.6 percent. The commercials are Bullish-Extreme with a score of 82.0 percent and the small traders (not shown in chart) are Bearish-Extreme with a score of 15.2 percent.
| 3-Month Eurodollars Statistics | SPECULATORS | COMMERCIALS | SMALL TRADERS |
| – Percent of Open Interest Longs: | 11.0 | 67.7 | 3.6 |
| – Percent of Open Interest Shorts: | 22.2 | 52.6 | 7.5 |
| – Net Position: | -1,374,863 | 1,849,419 | -474,556 |
| – Gross Longs: | 1,347,006 | 8,286,582 | 442,408 |
| – Gross Shorts: | 2,721,869 | 6,437,163 | 916,964 |
| – Long to Short Ratio: | 0.5 to 1 | 1.3 to 1 | 0.5 to 1 |
| NET POSITION TREND: | |||
| – Strength Index Score (3 Year Range Pct): | 17.6 | 82.0 | 15.2 |
| – Strength Index Reading (3 Year Range): | Bearish-Extreme | Bullish-Extreme | Bearish-Extreme |
| NET POSITION MOVEMENT INDEX: | |||
| – 6-Week Change in Strength Index: | -13.7 | 15.8 | -28.7 |
30-Day Federal Funds Futures:
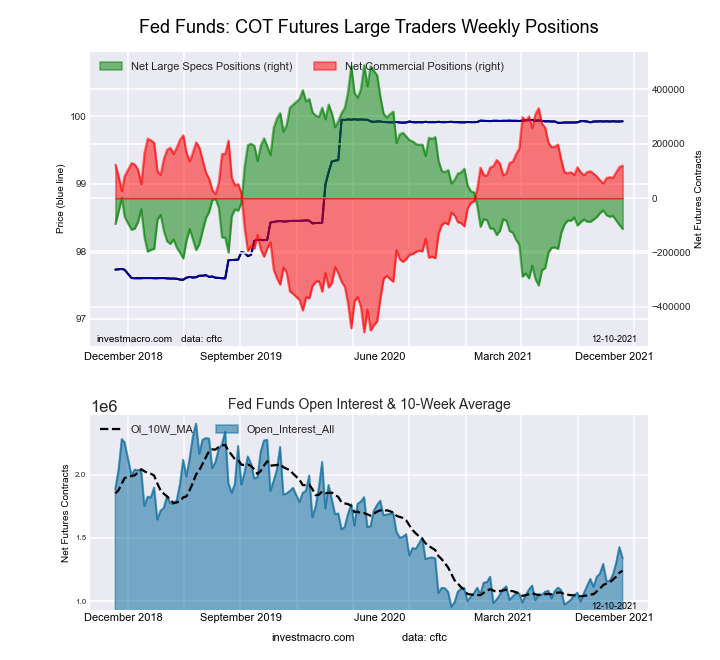 The 30-Day Federal Funds large speculator standing this week recorded a net position of -113,319 contracts in the data reported through Tuesday. This was a weekly reduction of -14,841 contracts from the previous week which had a total of -98,478 net contracts.
This week’s current strength score (the trader positioning range over the past three years, measured from 0 to 100) shows the speculators are currently Bearish with a score of 25.6 percent. The commercials are Bullish with a score of 74.4 percent and the small traders (not shown in chart) are Bearish with a score of 47.4 percent.
| 30-Day Federal Funds Statistics | SPECULATORS | COMMERCIALS | SMALL TRADERS |
| – Percent of Open Interest Longs: | 3.6 | 81.2 | 1.6 |
| – Percent of Open Interest Shorts: | 12.1 | 72.2 | 2.1 |
| – Net Position: | -113,319 | 119,740 | -6,421 |
| – Gross Longs: | 48,763 | 1,086,342 | 22,027 |
| – Gross Shorts: | 162,082 | 966,602 | 28,448 |
| – Long to Short Ratio: | 0.3 to 1 | 1.1 to 1 | 0.8 to 1 |
| NET POSITION TREND: | |||
| – Strength Index Score (3 Year Range Pct): | 25.6 | 74.4 | 47.4 |
| – Strength Index Reading (3 Year Range): | Bearish | Bullish | Bearish |
| NET POSITION MOVEMENT INDEX: | |||
| – 6-Week Change in Strength Index: | -8.5 | 7.9 | 8.0 |
2-Year Treasury Note Futures:
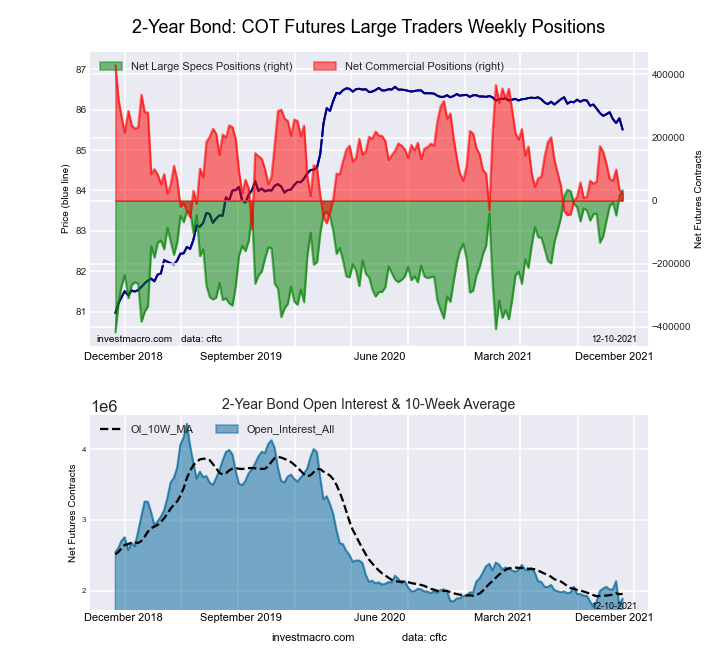 The 2-Year Treasury Note large speculator standing this week recorded a net position of 32,605 contracts in the data reported through Tuesday. This was a weekly advance of 16,935 contracts from the previous week which had a total of 15,670 net contracts.
This week’s current strength score (the trader positioning range over the past three years, measured from 0 to 100) shows the speculators are currently Bullish-Extreme with a score of 99.5 percent. The commercials are Bearish with a score of 24.6 percent and the small traders (not shown in chart) are Bearish-Extreme with a score of 2.0 percent.
| 2-Year Treasury Note Statistics | SPECULATORS | COMMERCIALS | SMALL TRADERS |
| – Percent of Open Interest Longs: | 17.6 | 70.6 | 6.8 |
| – Percent of Open Interest Shorts: | 15.9 | 69.5 | 9.7 |
| – Net Position: | 32,605 | 21,757 | -54,362 |
| – Gross Longs: | 332,992 | 1,333,598 | 128,768 |
| – Gross Shorts: | 300,387 | 1,311,841 | 183,130 |
| – Long to Short Ratio: | 1.1 to 1 | 1.0 to 1 | 0.7 to 1 |
| NET POSITION TREND: | |||
| – Strength Index Score (3 Year Range Pct): | 99.5 | 24.6 | 2.0 |
| – Strength Index Reading (3 Year Range): | Bullish-Extreme | Bearish | Bearish-Extreme |
| NET POSITION MOVEMENT INDEX: | |||
| – 6-Week Change in Strength Index: | 32.8 | -29.1 | -6.6 |
5-Year Treasury Note Futures:
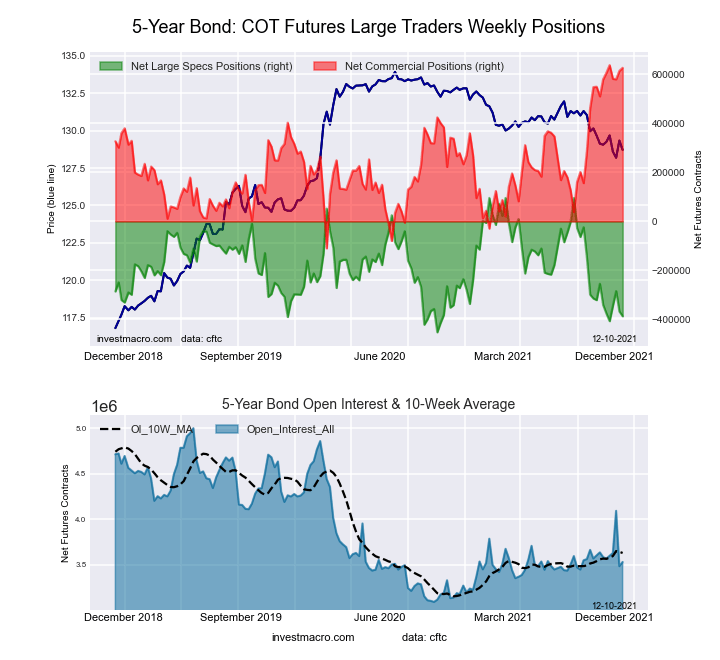 The 5-Year Treasury Note large speculator standing this week recorded a net position of -387,531 contracts in the data reported through Tuesday. This was a weekly decrease of -19,699 contracts from the previous week which had a total of -367,832 net contracts.
This week’s current strength score (the trader positioning range over the past three years, measured from 0 to 100) shows the speculators are currently Bearish-Extreme with a score of 11.9 percent. The commercials are Bullish-Extreme with a score of 98.6 percent and the small traders (not shown in chart) are Bearish-Extreme with a score of 15.3 percent.
| 5-Year Treasury Note Statistics | SPECULATORS | COMMERCIALS | SMALL TRADERS |
| – Percent of Open Interest Longs: | 5.8 | 83.6 | 7.1 |
| – Percent of Open Interest Shorts: | 16.8 | 65.9 | 13.9 |
| – Net Position: | -387,531 | 626,885 | -239,354 |
| – Gross Longs: | 206,116 | 2,953,732 | 252,310 |
| – Gross Shorts: | 593,647 | 2,326,847 | 491,664 |
| – Long to Short Ratio: | 0.3 to 1 | 1.3 to 1 | 0.5 to 1 |
| NET POSITION TREND: | |||
| – Strength Index Score (3 Year Range Pct): | 11.9 | 98.6 | 15.3 |
| – Strength Index Reading (3 Year Range): | Bearish-Extreme | Bullish-Extreme | Bearish-Extreme |
| NET POSITION MOVEMENT INDEX: | |||
| – 6-Week Change in Strength Index: | -8.4 | 6.3 | -0.3 |
10-Year Treasury Note Futures:
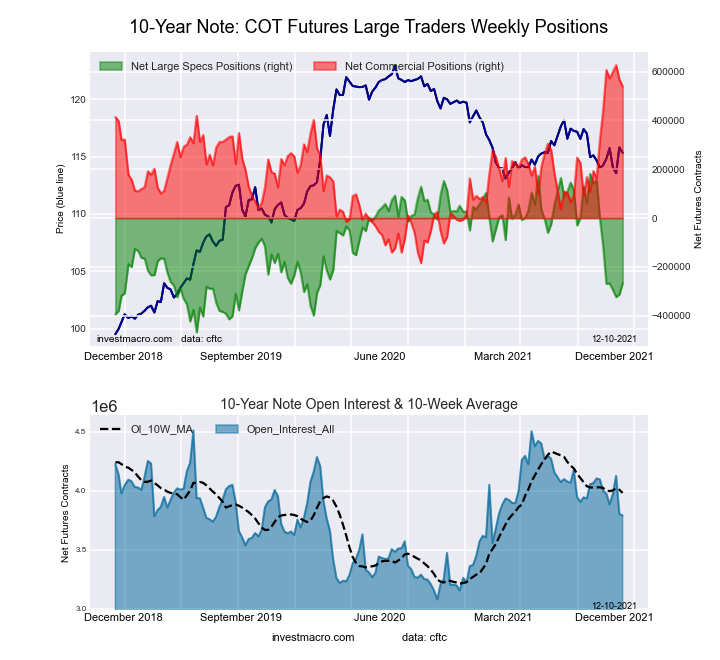 The 10-Year Treasury Note large speculator standing this week recorded a net position of -267,006 contracts in the data reported through Tuesday. This was a weekly increase of 46,365 contracts from the previous week which had a total of -313,371 net contracts.
This week’s current strength score (the trader positioning range over the past three years, measured from 0 to 100) shows the speculators are currently Bearish with a score of 30.9 percent. The commercials are Bullish-Extreme with a score of 89.2 percent and the small traders (not shown in chart) are Bearish-Extreme with a score of 15.4 percent.
| 10-Year Treasury Note Statistics | SPECULATORS | COMMERCIALS | SMALL TRADERS |
| – Percent of Open Interest Longs: | 11.3 | 78.7 | 7.5 |
| – Percent of Open Interest Shorts: | 18.4 | 64.5 | 14.7 |
| – Net Position: | -267,006 | 538,925 | -271,919 |
| – Gross Longs: | 429,676 | 2,982,925 | 286,003 |
| – Gross Shorts: | 696,682 | 2,444,000 | 557,922 |
| – Long to Short Ratio: | 0.6 to 1 | 1.2 to 1 | 0.5 to 1 |
| NET POSITION TREND: | |||
| – Strength Index Score (3 Year Range Pct): | 30.9 | 89.2 | 15.4 |
| – Strength Index Reading (3 Year Range): | Bearish | Bullish-Extreme | Bearish-Extreme |
| NET POSITION MOVEMENT INDEX: | |||
| – 6-Week Change in Strength Index: | -23.4 | 12.0 | 12.7 |
Ultra 10-Year Notes Futures:
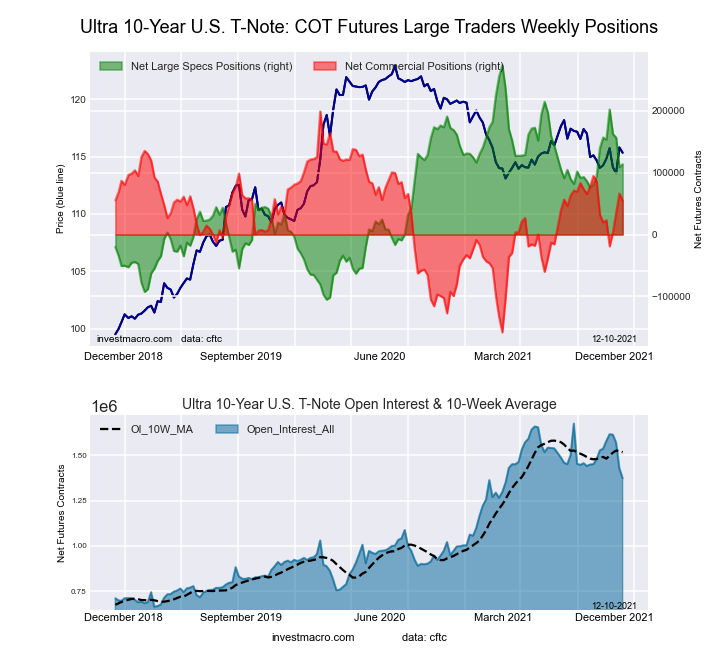 The Ultra 10-Year Notes large speculator standing this week recorded a net position of 113,607 contracts in the data reported through Tuesday. This was a weekly boost of 4,727 contracts from the previous week which had a total of 108,880 net contracts.
This week’s current strength score (the trader positioning range over the past three years, measured from 0 to 100) shows the speculators are currently Bullish with a score of 57.7 percent. The commercials are Bullish with a score of 59.5 percent and the small traders (not shown in chart) are Bearish-Extreme with a score of 14.4 percent.
| Ultra 10-Year Notes Statistics | SPECULATORS | COMMERCIALS | SMALL TRADERS |
| – Percent of Open Interest Longs: | 18.4 | 72.2 | 7.8 |
| – Percent of Open Interest Shorts: | 10.1 | 68.2 | 20.0 |
| – Net Position: | 113,607 | 54,412 | -168,019 |
| – Gross Longs: | 252,678 | 992,329 | 107,252 |
| – Gross Shorts: | 139,071 | 937,917 | 275,271 |
| – Long to Short Ratio: | 1.8 to 1 | 1.1 to 1 | 0.4 to 1 |
| NET POSITION TREND: | |||
| – Strength Index Score (3 Year Range Pct): | 57.7 | 59.5 | 14.4 |
| – Strength Index Reading (3 Year Range): | Bullish | Bullish | Bearish-Extreme |
| NET POSITION MOVEMENT INDEX: | |||
| – 6-Week Change in Strength Index: | -11.4 | 9.8 | 5.0 |
US Treasury Bonds Futures:
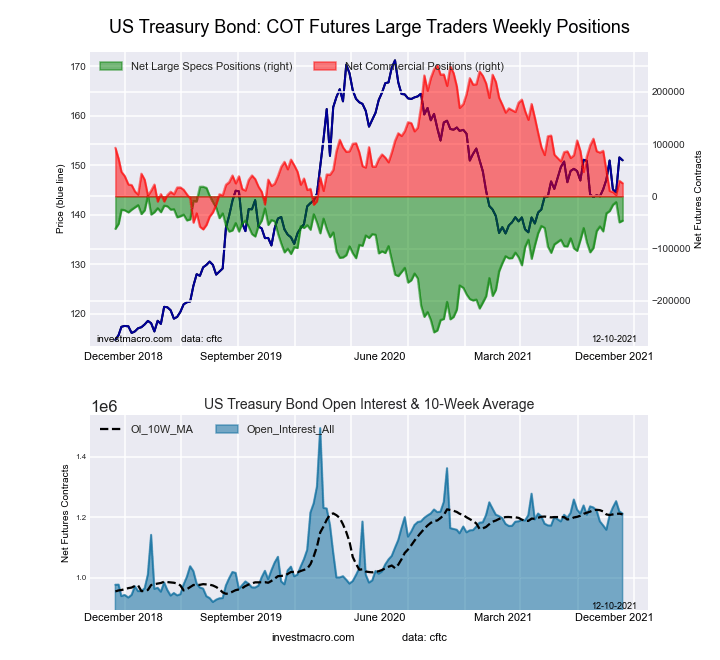 The US Treasury Bonds large speculator standing this week recorded a net position of -46,522 contracts in the data reported through Tuesday. This was a weekly advance of 3,118 contracts from the previous week which had a total of -49,640 net contracts.
This week’s current strength score (the trader positioning range over the past three years, measured from 0 to 100) shows the speculators are currently Bullish with a score of 76.7 percent. The commercials are Bearish with a score of 28.1 percent and the small traders (not shown in chart) are Bullish with a score of 69.6 percent.
| US Treasury Bonds Statistics | SPECULATORS | COMMERCIALS | SMALL TRADERS |
| – Percent of Open Interest Longs: | 10.6 | 72.1 | 15.8 |
| – Percent of Open Interest Shorts: | 14.5 | 70.1 | 14.0 |
| – Net Position: | -46,522 | 25,038 | 21,484 |
| – Gross Longs: | 128,583 | 873,875 | 191,608 |
| – Gross Shorts: | 175,105 | 848,837 | 170,124 |
| – Long to Short Ratio: | 0.7 to 1 | 1.0 to 1 | 1.1 to 1 |
| NET POSITION TREND: | |||
| – Strength Index Score (3 Year Range Pct): | 76.7 | 28.1 | 69.6 |
| – Strength Index Reading (3 Year Range): | Bullish | Bearish | Bullish |
| NET POSITION MOVEMENT INDEX: | |||
| – 6-Week Change in Strength Index: | 7.4 | -19.7 | 32.9 |
Ultra US Treasury Bonds Futures:
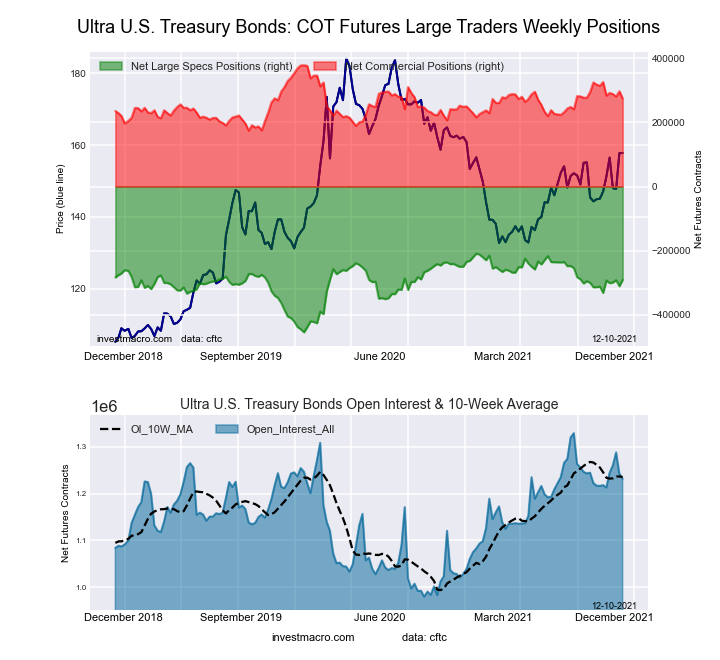 The Ultra US Treasury Bonds large speculator standing this week recorded a net position of -290,354 contracts in the data reported through Tuesday. This was a weekly advance of 20,142 contracts from the previous week which had a total of -310,496 net contracts.
This week’s current strength score (the trader positioning range over the past three years, measured from 0 to 100) shows the speculators are currently Bullish with a score of 66.8 percent. The commercials are Bearish with a score of 49.0 percent and the small traders (not shown in chart) are Bearish with a score of 40.0 percent.
| Ultra US Treasury Bonds Statistics | SPECULATORS | COMMERCIALS | SMALL TRADERS |
| – Percent of Open Interest Longs: | 6.1 | 80.1 | 12.5 |
| – Percent of Open Interest Shorts: | 29.7 | 57.8 | 11.1 |
| – Net Position: | -290,354 | 274,032 | 16,322 |
| – Gross Longs: | 75,407 | 986,451 | 153,443 |
| – Gross Shorts: | 365,761 | 712,419 | 137,121 |
| – Long to Short Ratio: | 0.2 to 1 | 1.4 to 1 | 1.1 to 1 |
| NET POSITION TREND: | |||
| – Strength Index Score (3 Year Range Pct): | 66.8 | 49.0 | 40.0 |
| – Strength Index Reading (3 Year Range): | Bullish | Bearish | Bearish |
| NET POSITION MOVEMENT INDEX: | |||
| – 6-Week Change in Strength Index: | 16.7 | -25.2 | 7.5 |
Article By InvestMacro – Receive our weekly COT Reports by Email
*COT Report: The COT data, released weekly to the public each Friday, is updated through the most recent Tuesday (data is 3 days old) and shows a quick view of how large speculators or non-commercials (for-profit traders) were positioned in the futures markets.
The CFTC categorizes trader positions according to commercial hedgers (traders who use futures contracts for hedging as part of the business), non-commercials (large traders who speculate to realize trading profits) and nonreportable traders (usually small traders/speculators) as well as their open interest (contracts open in the market at time of reporting).See CFTC criteria here.

- Tariffs on US imports come into effect today. The RBNZ expectedly lowered the rate by 0.25% Apr 9, 2025
- Volatility in financial markets is insane. Oil fell to $60.7 per barrel Apr 8, 2025
- Japanese Yen Recovers Some Losses as Investors Seek Safe-Haven Assets Apr 8, 2025
- The sell-off in risk assets intensified as tariffs took effect Apr 7, 2025
- COT Metals Charts: Speculator Bets led lower by Gold, Copper & Silver Apr 5, 2025
- COT Bonds Charts: Speculator Bets led by SOFR 1-Month & US Treasury Bonds Apr 5, 2025
- COT Soft Commodities Charts: Speculator Bets led by Soybean Oil, Cotton & Soybeans Apr 5, 2025
- COT Stock Market Charts: Speculator Bets led by S&P500 & Nasdaq Apr 5, 2025
- Today, investors focus on the Non-Farm Payrolls labor market report Apr 4, 2025
- USD/JPY collapses to a 6-month low: safe-haven assets in demand Apr 4, 2025
