
By CountingPips.com COT Home | Data Tables | Data Downloads | Newsletter
Here are the latest charts and statistics for the Commitment of Traders (COT) data published by the Commodities Futures Trading Commission (CFTC).
The latest COT data is updated through Tuesday August 31 2021 and shows a quick view of how large traders (for-profit speculators and commercial entities) were positioned in the futures markets.
CORN Futures:
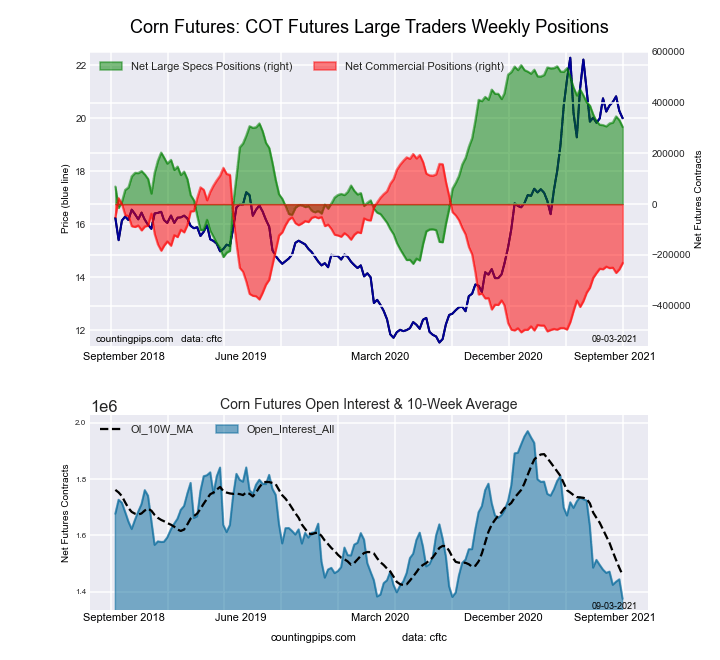 The CORN large speculator standing this week resulted in a net position of 304,172 contracts in the data reported through Tuesday. This was a weekly fall of -26,795 contracts from the previous week which had a total of 330,967 net contracts.
This week’s current strength score (the trader positioning range over the past three years, measured from 0 to 100) shows the speculators are currently Bullish with a score of 68.9 percent. The commercials are Bearish with a score of 38.9 percent and the small traders (not shown in chart) are Bearish-Extreme with a score of 1.5 percent.
| CORN Futures Statistics | SPECULATORS | COMMERCIALS | SMALL TRADERS |
| – Percent of Open Interest Longs: | 29.2 | 48.9 | 7.8 |
| – Percent of Open Interest Shorts: | 7.0 | 65.8 | 13.0 |
| – Net Position: | 304,172 | -231,861 | -72,311 |
| – Gross Longs: | 400,723 | 671,977 | 106,901 |
| – Gross Shorts: | 96,551 | 903,838 | 179,212 |
| – Long to Short Ratio: | 4.2 to 1 | 0.7 to 1 | 0.6 to 1 |
| NET POSITION TREND: | |||
| – COT Index Score (3 Year Range Pct): | 68.9 | 38.9 | 1.5 |
| – COT Index Reading (3 Year Range): | Bullish | Bearish | Bearish-Extreme |
| NET POSITION MOVEMENT INDEX: | |||
| – 6-Week Change in Strength Index: | -0.9 | 3.5 | -9.9 |
Free Reports:
 Sign Up for Our Stock Market Newsletter – Get updated on News, Charts & Rankings of Public Companies when you join our Stocks Newsletter
 Get our Weekly Commitment of Traders Reports - See where the biggest traders (Hedge Funds and Commercial Hedgers) are positioned in the futures markets on a weekly basis.
SUGAR Futures:
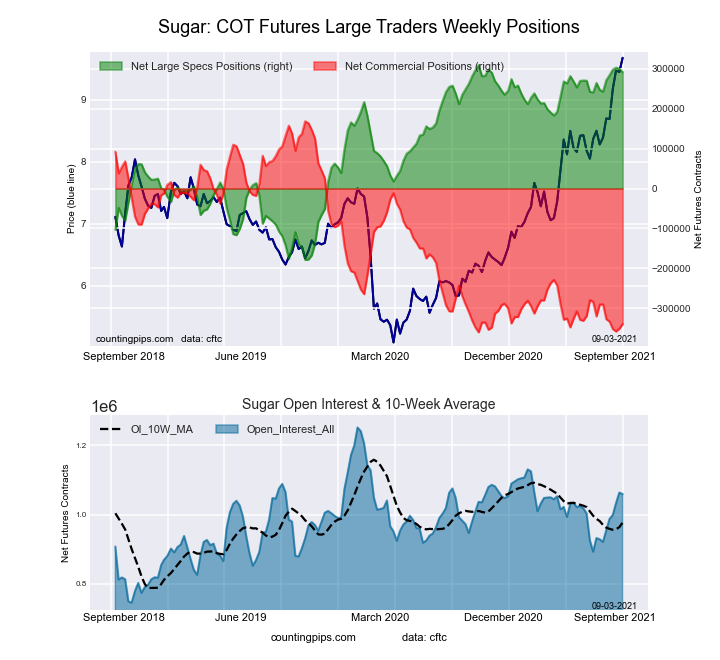 The SUGAR large speculator standing this week resulted in a net position of 291,432 contracts in the data reported through Tuesday. This was a weekly decrease of -7,645 contracts from the previous week which had a total of 299,077 net contracts.
This week’s current strength score (the trader positioning range over the past three years, measured from 0 to 100) shows the speculators are currently Bullish-Extreme with a score of 96.5 percent. The commercials are Bearish-Extreme with a score of 3.9 percent and the small traders (not shown in chart) are Bullish with a score of 66.4 percent.
| SUGAR Futures Statistics | SPECULATORS | COMMERCIALS | SMALL TRADERS |
| – Percent of Open Interest Longs: | 31.5 | 44.4 | 9.0 |
| – Percent of Open Interest Shorts: | 4.0 | 76.4 | 4.5 |
| – Net Position: | 291,432 | -338,795 | 47,363 |
| – Gross Longs: | 333,709 | 470,073 | 95,216 |
| – Gross Shorts: | 42,277 | 808,868 | 47,853 |
| – Long to Short Ratio: | 7.9 to 1 | 0.6 to 1 | 2.0 to 1 |
| NET POSITION TREND: | |||
| – COT Index Score (3 Year Range Pct): | 96.5 | 3.9 | 66.4 |
| – COT Index Reading (3 Year Range): | Bullish-Extreme | Bearish-Extreme | Bullish |
| NET POSITION MOVEMENT INDEX: | |||
| – 6-Week Change in Strength Index: | 10.1 | -9.3 | 0.4 |
COFFEE Futures:
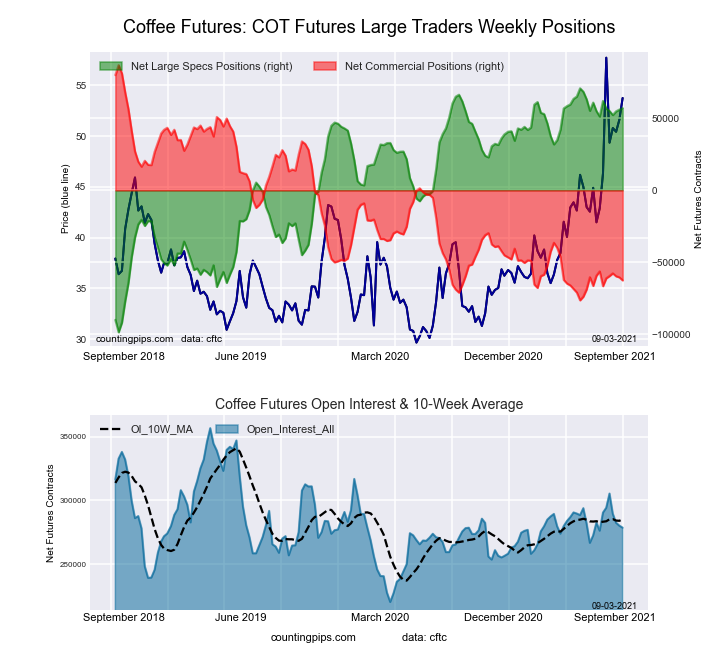 The COFFEE large speculator standing this week resulted in a net position of 57,073 contracts in the data reported through Tuesday. This was a weekly gain of 1,061 contracts from the previous week which had a total of 56,012 net contracts.
This week’s current strength score (the trader positioning range over the past three years, measured from 0 to 100) shows the speculators are currently Bullish-Extreme with a score of 91.9 percent. The commercials are Bearish-Extreme with a score of 8.5 percent and the small traders (not shown in chart) are Bearish with a score of 25.7 percent.
| COFFEE Futures Statistics | SPECULATORS | COMMERCIALS | SMALL TRADERS |
| – Percent of Open Interest Longs: | 27.2 | 44.1 | 3.8 |
| – Percent of Open Interest Shorts: | 6.7 | 66.5 | 1.9 |
| – Net Position: | 57,073 | -62,471 | 5,398 |
| – Gross Longs: | 75,669 | 122,913 | 10,593 |
| – Gross Shorts: | 18,596 | 185,384 | 5,195 |
| – Long to Short Ratio: | 4.1 to 1 | 0.7 to 1 | 2.0 to 1 |
| NET POSITION TREND: | |||
| – COT Index Score (3 Year Range Pct): | 91.9 | 8.5 | 25.7 |
| – COT Index Reading (3 Year Range): | Bullish-Extreme | Bearish-Extreme | Bearish |
| NET POSITION MOVEMENT INDEX: | |||
| – 6-Week Change in Strength Index: | -2.9 | 2.5 | 6.7 |
SOYBEANS Futures:
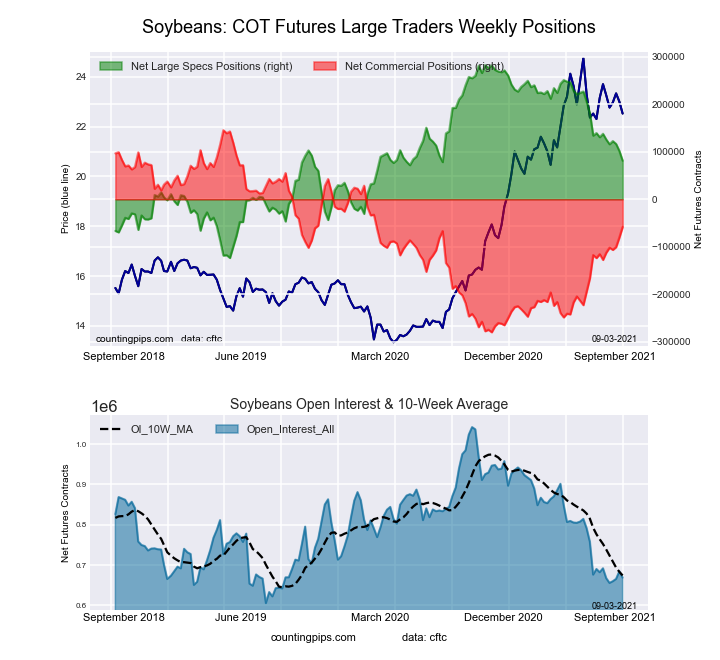 The SOYBEANS large speculator standing this week resulted in a net position of 81,135 contracts in the data reported through Tuesday. This was a weekly decline of -20,512 contracts from the previous week which had a total of 101,647 net contracts.
This week’s current strength score (the trader positioning range over the past three years, measured from 0 to 100) shows the speculators are currently Bullish with a score of 50.4 percent. The commercials are Bullish with a score of 52.1 percent and the small traders (not shown in chart) are Bearish with a score of 33.7 percent.
| SOYBEANS Futures Statistics | SPECULATORS | COMMERCIALS | SMALL TRADERS |
| – Percent of Open Interest Longs: | 23.8 | 55.9 | 6.6 |
| – Percent of Open Interest Shorts: | 11.6 | 64.6 | 10.0 |
| – Net Position: | 81,135 | -58,196 | -22,939 |
| – Gross Longs: | 158,981 | 374,153 | 44,292 |
| – Gross Shorts: | 77,846 | 432,349 | 67,231 |
| – Long to Short Ratio: | 2.0 to 1 | 0.9 to 1 | 0.7 to 1 |
| NET POSITION TREND: | |||
| – COT Index Score (3 Year Range Pct): | 50.4 | 52.1 | 33.7 |
| – COT Index Reading (3 Year Range): | Bullish | Bullish | Bearish |
| NET POSITION MOVEMENT INDEX: | |||
| – 6-Week Change in Strength Index: | -13.9 | 16.3 | -21.3 |
SOYBEAN MEAL Futures:
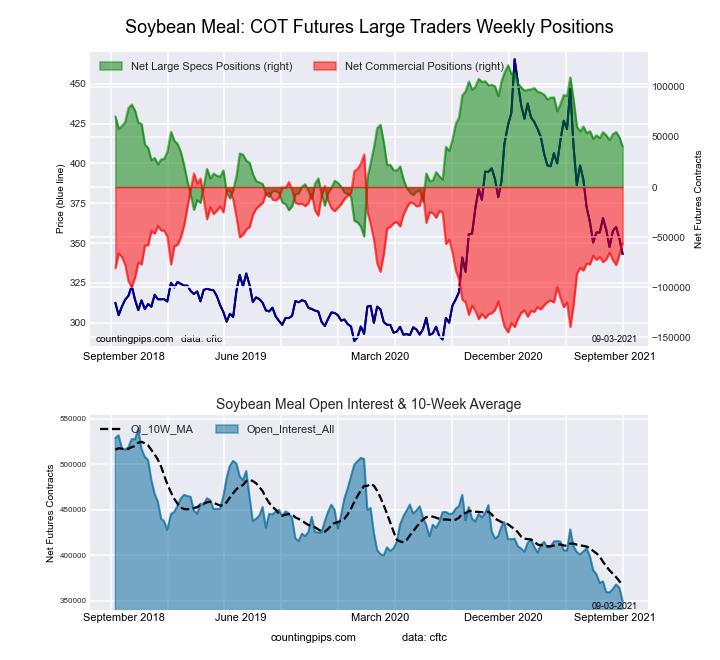 The SOYBEAN MEAL large speculator standing this week resulted in a net position of 40,508 contracts in the data reported through Tuesday. This was a weekly fall of -9,200 contracts from the previous week which had a total of 49,708 net contracts.
This week’s current strength score (the trader positioning range over the past three years, measured from 0 to 100) shows the speculators are currently Bullish with a score of 52.5 percent. The commercials are Bearish with a score of 50.0 percent and the small traders (not shown in chart) are Bearish with a score of 33.8 percent.
| SOYBEAN MEAL Futures Statistics | SPECULATORS | COMMERCIALS | SMALL TRADERS |
| – Percent of Open Interest Longs: | 24.0 | 52.3 | 12.1 |
| – Percent of Open Interest Shorts: | 12.4 | 68.4 | 7.6 |
| – Net Position: | 40,508 | -56,278 | 15,770 |
| – Gross Longs: | 83,951 | 182,811 | 42,422 |
| – Gross Shorts: | 43,443 | 239,089 | 26,652 |
| – Long to Short Ratio: | 1.9 to 1 | 0.8 to 1 | 1.6 to 1 |
| NET POSITION TREND: | |||
| – COT Index Score (3 Year Range Pct): | 52.5 | 50.0 | 33.8 |
| – COT Index Reading (3 Year Range): | Bullish | Bearish | Bearish |
| NET POSITION MOVEMENT INDEX: | |||
| – 6-Week Change in Strength Index: | -8.4 | 10.5 | -16.9 |
LIVE CATTLE Futures:
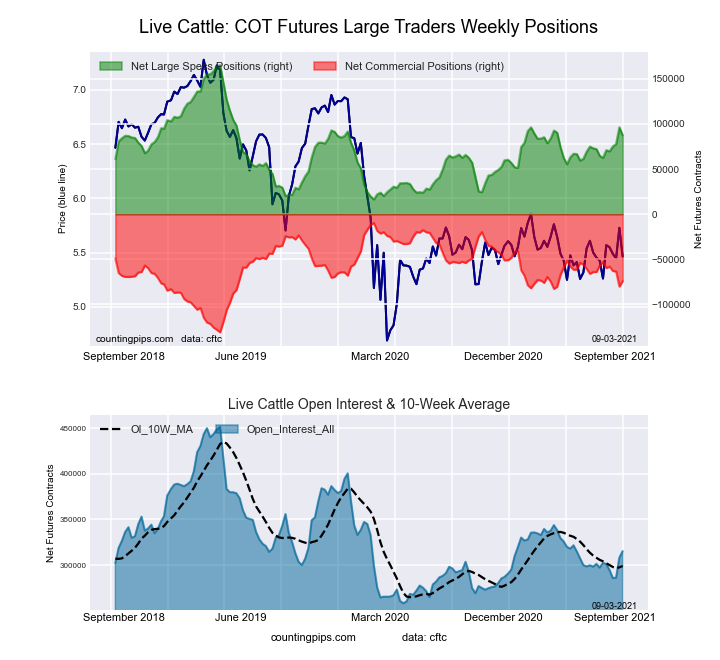 The LIVE CATTLE large speculator standing this week resulted in a net position of 87,565 contracts in the data reported through Tuesday. This was a weekly decrease of -8,653 contracts from the previous week which had a total of 96,218 net contracts.
This week’s current strength score (the trader positioning range over the past three years, measured from 0 to 100) shows the speculators are currently Bearish with a score of 47.8 percent. The commercials are Bearish with a score of 46.8 percent and the small traders (not shown in chart) are Bullish with a score of 54.4 percent.
| LIVE CATTLE Futures Statistics | SPECULATORS | COMMERCIALS | SMALL TRADERS |
| – Percent of Open Interest Longs: | 38.8 | 37.2 | 9.2 |
| – Percent of Open Interest Shorts: | 11.0 | 60.7 | 13.4 |
| – Net Position: | 87,565 | -74,129 | -13,436 |
| – Gross Longs: | 122,204 | 117,107 | 28,874 |
| – Gross Shorts: | 34,639 | 191,236 | 42,310 |
| – Long to Short Ratio: | 3.5 to 1 | 0.6 to 1 | 0.7 to 1 |
| NET POSITION TREND: | |||
| – COT Index Score (3 Year Range Pct): | 47.8 | 46.8 | 54.4 |
| – COT Index Reading (3 Year Range): | Bearish | Bearish | Bullish |
| NET POSITION MOVEMENT INDEX: | |||
| – 6-Week Change in Strength Index: | 16.9 | -17.4 | -10.0 |
LEAN HOGS Futures:
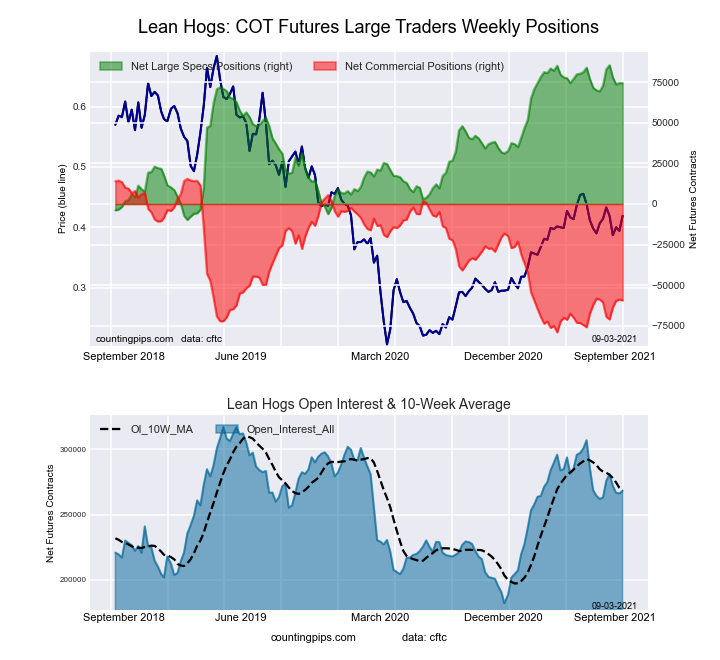 The LEAN HOGS large speculator standing this week resulted in a net position of 74,486 contracts in the data reported through Tuesday. This was a weekly decline of -144 contracts from the previous week which had a total of 74,630 net contracts.
This week’s current strength score (the trader positioning range over the past three years, measured from 0 to 100) shows the speculators are currently Bullish-Extreme with a score of 88.4 percent. The commercials are Bearish with a score of 20.8 percent and the small traders (not shown in chart) are Bearish-Extreme with a score of 6.5 percent.
| LEAN HOGS Futures Statistics | SPECULATORS | COMMERCIALS | SMALL TRADERS |
| – Percent of Open Interest Longs: | 45.1 | 31.2 | 7.3 |
| – Percent of Open Interest Shorts: | 17.4 | 53.3 | 12.9 |
| – Net Position: | 74,486 | -59,433 | -15,053 |
| – Gross Longs: | 121,091 | 83,613 | 19,463 |
| – Gross Shorts: | 46,605 | 143,046 | 34,516 |
| – Long to Short Ratio: | 2.6 to 1 | 0.6 to 1 | 0.6 to 1 |
| NET POSITION TREND: | |||
| – COT Index Score (3 Year Range Pct): | 88.4 | 20.8 | 6.5 |
| – COT Index Reading (3 Year Range): | Bullish-Extreme | Bearish | Bearish-Extreme |
| NET POSITION MOVEMENT INDEX: | |||
| – 6-Week Change in Strength Index: | 1.5 | 1.4 | -13.1 |
COTTON Futures:
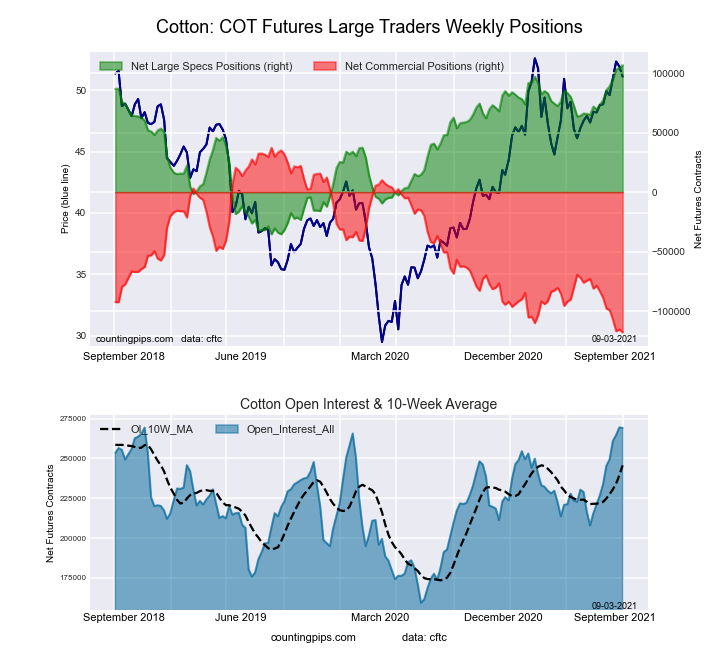 The COTTON large speculator standing this week resulted in a net position of 106,714 contracts in the data reported through Tuesday. This was a weekly lift of 2,405 contracts from the previous week which had a total of 104,309 net contracts.
This week’s current strength score (the trader positioning range over the past three years, measured from 0 to 100) shows the speculators are currently Bullish-Extreme with a score of 100.0 percent. The commercials are Bearish-Extreme with a score of 0.0 percent and the small traders (not shown in chart) are Bullish-Extreme with a score of 82.9 percent.
| COTTON Futures Statistics | SPECULATORS | COMMERCIALS | SMALL TRADERS |
| – Percent of Open Interest Longs: | 44.9 | 35.7 | 7.1 |
| – Percent of Open Interest Shorts: | 5.2 | 79.4 | 3.0 |
| – Net Position: | 106,714 | -117,829 | 11,115 |
| – Gross Longs: | 120,766 | 95,982 | 19,089 |
| – Gross Shorts: | 14,052 | 213,811 | 7,974 |
| – Long to Short Ratio: | 8.6 to 1 | 0.4 to 1 | 2.4 to 1 |
| NET POSITION TREND: | |||
| – COT Index Score (3 Year Range Pct): | 100.0 | 0.0 | 82.9 |
| – COT Index Reading (3 Year Range): | Bullish-Extreme | Bearish-Extreme | Bullish-Extreme |
| NET POSITION MOVEMENT INDEX: | |||
| – 6-Week Change in Strength Index: | 20.7 | -18.6 | -3.4 |
COCOA Futures:
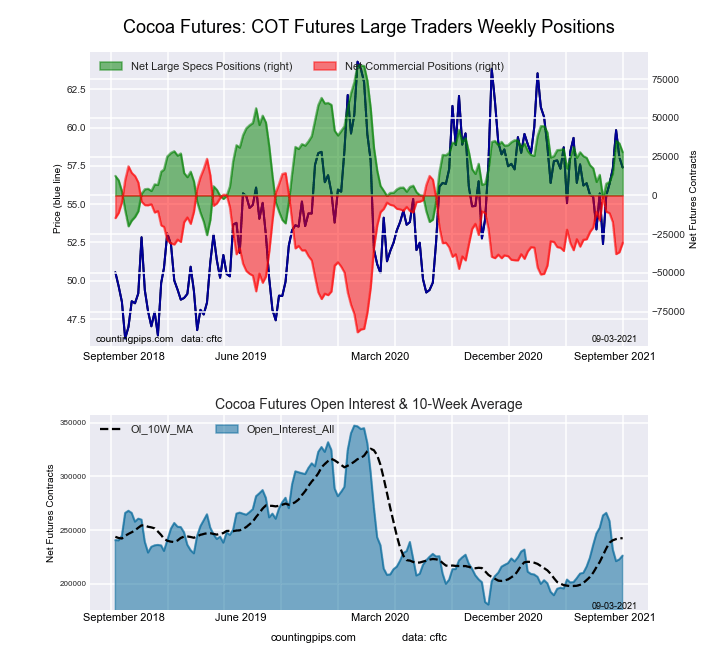 The COCOA large speculator standing this week resulted in a net position of 27,909 contracts in the data reported through Tuesday. This was a weekly decrease of -5,746 contracts from the previous week which had a total of 33,655 net contracts.
This week’s current strength score (the trader positioning range over the past three years, measured from 0 to 100) shows the speculators are currently Bearish with a score of 48.8 percent. The commercials are Bullish with a score of 51.6 percent and the small traders (not shown in chart) are Bearish with a score of 39.0 percent.
| COCOA Futures Statistics | SPECULATORS | COMMERCIALS | SMALL TRADERS |
| – Percent of Open Interest Longs: | 28.7 | 54.5 | 5.0 |
| – Percent of Open Interest Shorts: | 16.4 | 68.0 | 3.8 |
| – Net Position: | 27,909 | -30,595 | 2,686 |
| – Gross Longs: | 64,948 | 123,250 | 11,365 |
| – Gross Shorts: | 37,039 | 153,845 | 8,679 |
| – Long to Short Ratio: | 1.8 to 1 | 0.8 to 1 | 1.3 to 1 |
| NET POSITION TREND: | |||
| – COT Index Score (3 Year Range Pct): | 48.8 | 51.6 | 39.0 |
| – COT Index Reading (3 Year Range): | Bearish | Bullish | Bearish |
| NET POSITION MOVEMENT INDEX: | |||
| – 6-Week Change in Strength Index: | 27.1 | -26.6 | 0.2 |
WHEAT Futures:
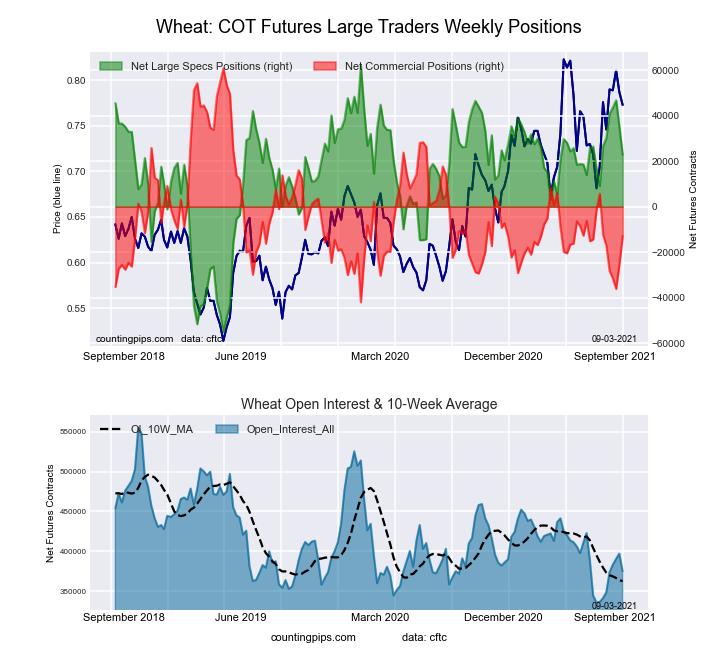 The WHEAT large speculator standing this week resulted in a net position of 22,805 contracts in the data reported through Tuesday. This was a weekly reduction of -12,243 contracts from the previous week which had a total of 35,048 net contracts.
This week’s current strength score (the trader positioning range over the past three years, measured from 0 to 100) shows the speculators are currently Bullish with a score of 66.4 percent. The commercials are Bearish with a score of 28.2 percent and the small traders (not shown in chart) are Bullish with a score of 54.5 percent.
| WHEAT Futures Statistics | SPECULATORS | COMMERCIALS | SMALL TRADERS |
| – Percent of Open Interest Longs: | 29.9 | 39.3 | 7.5 |
| – Percent of Open Interest Shorts: | 23.8 | 42.7 | 10.1 |
| – Net Position: | 22,805 | -12,943 | -9,862 |
| – Gross Longs: | 112,124 | 147,230 | 27,952 |
| – Gross Shorts: | 89,319 | 160,173 | 37,814 |
| – Long to Short Ratio: | 1.3 to 1 | 0.9 to 1 | 0.7 to 1 |
| NET POSITION TREND: | |||
| – COT Index Score (3 Year Range Pct): | 66.4 | 28.2 | 54.5 |
| – COT Index Reading (3 Year Range): | Bullish | Bearish | Bullish |
| NET POSITION MOVEMENT INDEX: | |||
| – 6-Week Change in Strength Index: | -3.4 | -0.6 | 22.0 |
Article By CountingPips.com – Receive our weekly COT Reports by Email
*COT Report: The COT data, released weekly to the public each Friday, is updated through the most recent Tuesday (data is 3 days old) and shows a quick view of how large speculators or non-commercials (for-profit traders) were positioned in the futures markets.
The CFTC categorizes trader positions according to commercial hedgers (traders who use futures contracts for hedging as part of the business), non-commercials (large traders who speculate to realize trading profits) and nonreportable traders (usually small traders/speculators).
Find CFTC criteria here: (http://www.cftc.gov/MarketReports/CommitmentsofTraders/ExplanatoryNotes/index.htm).

- Geopolitical and macroeconomic conditions continue to pressure market sentiment Jul 20, 2026
- USD/JPY Poised to Continue Gains as Expensive Oil and Lack of Support Weigh on Yen Jul 20, 2026
- COT Metals Charts: Weekly Speculator Bets led by Copper & Steel Jul 18, 2026
- COT Bonds Charts: Weekly Speculator Bets led by 2-Year, SOFR 3M & 5-Year Bonds Jul 18, 2026
- COT Energy Charts: Weekly Speculator Bets led by Brent Oil & Heating Oil Jul 18, 2026
- COT Soft Commodities Charts: Weekly Speculator Bets led by Wheat, Corn & Soybean Meal Jul 18, 2026
- The Bank of Canada kept its interest rate unchanged. Platinum prices reached a three‑week high Jul 16, 2026
- Stock indices rose after the release of US inflation data. China’s GDP slowed sharply Jul 15, 2026
- GBP/USD Awaits Political News: What Will Happen Next Jul 15, 2026
- USD/JPY Holds at Highs: Pressure Lingers on Yen Jul 14, 2026