By CountingPips.com COT Home | Data Tables | Data Downloads | Newsletter
Here are the latest charts and statistics for the Commitment of Traders (COT) data published by the Commodities Futures Trading Commission (CFTC).
The latest COT data is updated through Tuesday August 17 2021 and shows a quick view of how large traders (for-profit speculators and commercial entities) were positioned in the futures markets.
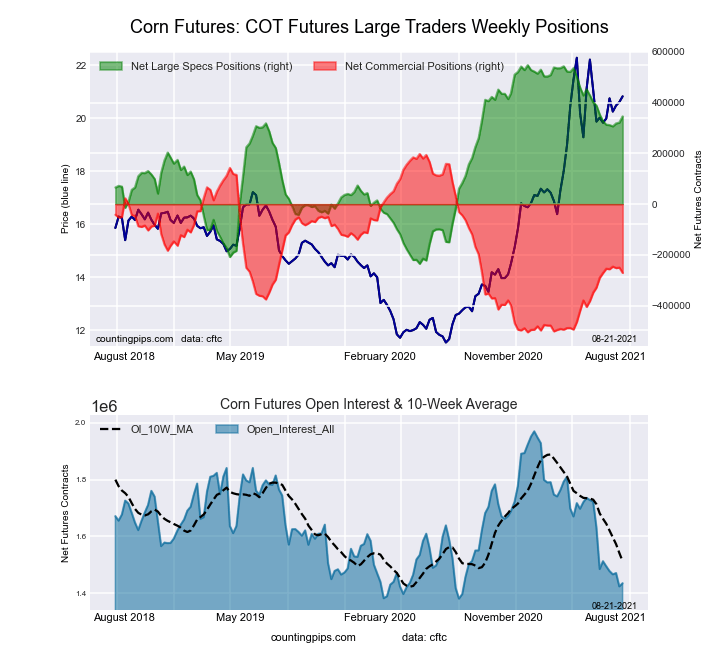
This week’s current strength score (the trader positioning range over the past three years, measured from 0 to 100) shows the speculators are currently Bullish with a score of 74.2 percent. The commercials are Bearish with a score of 33.3 percent and the small traders (not shown in chart) are Bearish-Extreme with a score of 0.0 percent.
| CORN Futures Statistics | SPECULATORS | COMMERCIALS | SMALL TRADERS |
| – Percent of Open Interest Longs: | 30.1 | 47.6 | 8.4 |
| – Percent of Open Interest Shorts: | 6.0 | 66.5 | 13.6 |
| – Net Position: | 345,846 | -270,993 | -74,853 |
| – Gross Longs: | 432,298 | 683,412 | 119,894 |
| – Gross Shorts: | 86,452 | 954,405 | 194,747 |
| – Long to Short Ratio: | 5.0 to 1 | 0.7 to 1 | 0.6 to 1 |
| NET POSITION TREND: | |||
| – COT Index Score (3 Year Range Pct): | 74.2 | 33.3 | 0.0 |
| – COT Index Reading (3 Year Range): | Bullish | Bearish | Bearish-Extreme |
| NET POSITION MOVEMENT INDEX: | |||
| – 6-Week Change in Strength Index: | 2.4 | 0.1 | -11.2 |
Free Reports:
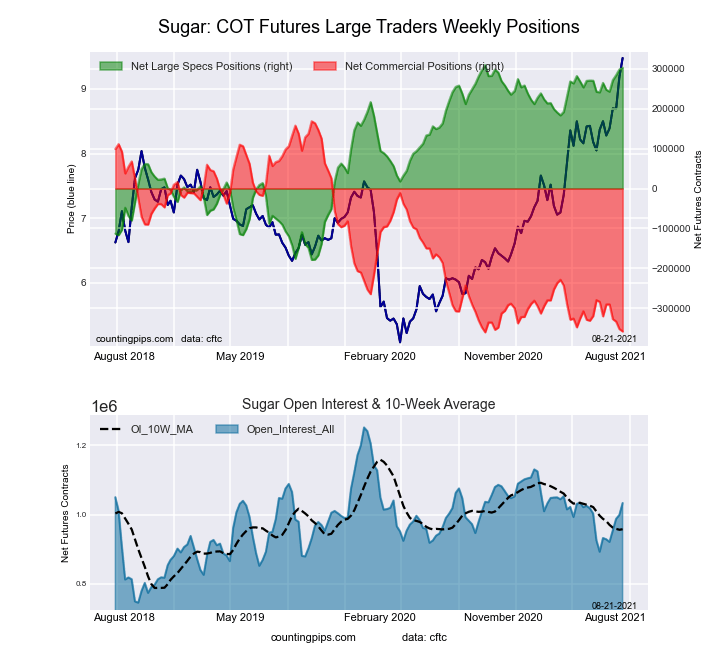
This week’s current strength score (the trader positioning range over the past three years, measured from 0 to 100) shows the speculators are currently Bullish-Extreme with a score of 98.7 percent. The commercials are Bearish-Extreme with a score of 0.4 percent and the small traders (not shown in chart) are Bullish with a score of 76.0 percent.
| SUGAR Futures Statistics | SPECULATORS | COMMERCIALS | SMALL TRADERS |
| – Percent of Open Interest Longs: | 32.9 | 42.8 | 9.3 |
| – Percent of Open Interest Shorts: | 3.6 | 77.4 | 3.9 |
| – Net Position: | 302,267 | -357,406 | 55,139 |
| – Gross Longs: | 339,414 | 442,141 | 95,926 |
| – Gross Shorts: | 37,147 | 799,547 | 40,787 |
| – Long to Short Ratio: | 9.1 to 1 | 0.6 to 1 | 2.4 to 1 |
| NET POSITION TREND: | |||
| – COT Index Score (3 Year Range Pct): | 98.7 | 0.4 | 76.0 |
| – COT Index Reading (3 Year Range): | Bullish-Extreme | Bearish-Extreme | Bullish |
| NET POSITION MOVEMENT INDEX: | |||
| – 6-Week Change in Strength Index: | 7.9 | -7.2 | -0.6 |
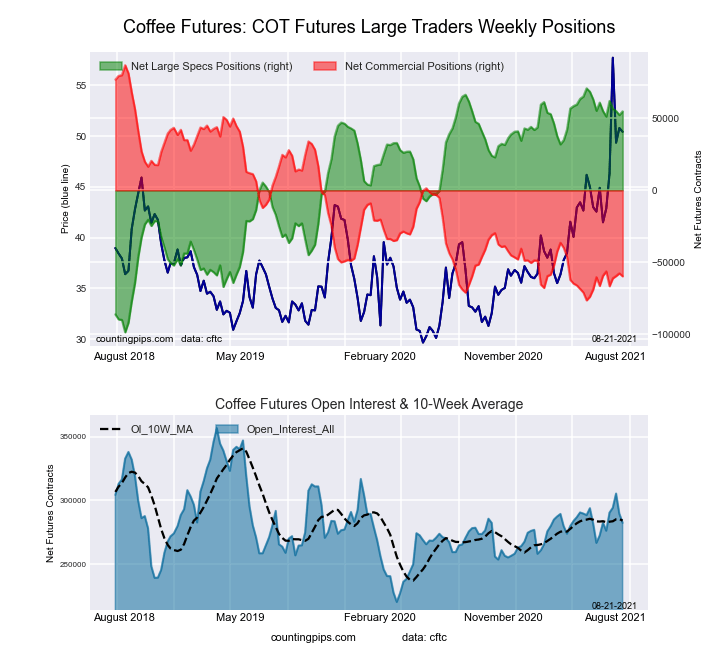
This week’s current strength score (the trader positioning range over the past three years, measured from 0 to 100) shows the speculators are currently Bullish-Extreme with a score of 90.6 percent. The commercials are Bearish-Extreme with a score of 10.2 percent and the small traders (not shown in chart) are Bearish with a score of 21.9 percent.
| COFFEE Futures Statistics | SPECULATORS | COMMERCIALS | SMALL TRADERS |
| – Percent of Open Interest Longs: | 26.3 | 46.0 | 3.9 |
| – Percent of Open Interest Shorts: | 6.9 | 67.1 | 2.2 |
| – Net Position: | 54,797 | -59,643 | 4,846 |
| – Gross Longs: | 74,249 | 129,838 | 11,124 |
| – Gross Shorts: | 19,452 | 189,481 | 6,278 |
| – Long to Short Ratio: | 3.8 to 1 | 0.7 to 1 | 1.8 to 1 |
| NET POSITION TREND: | |||
| – COT Index Score (3 Year Range Pct): | 90.6 | 10.2 | 21.9 |
| – COT Index Reading (3 Year Range): | Bullish-Extreme | Bearish-Extreme | Bearish |
| NET POSITION MOVEMENT INDEX: | |||
| – 6-Week Change in Strength Index: | -0.1 | -0.2 | 3.8 |
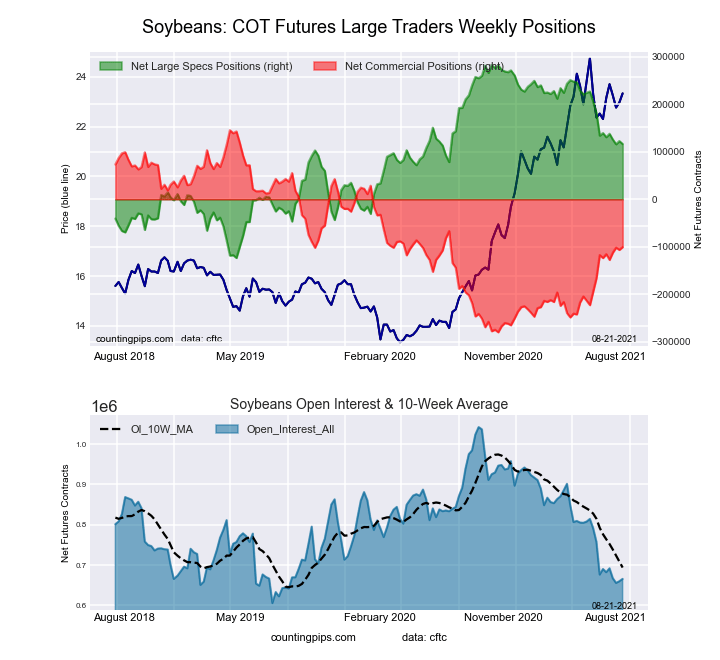
This week’s current strength score (the trader positioning range over the past three years, measured from 0 to 100) shows the speculators are currently Bullish with a score of 59.1 percent. The commercials are Bearish with a score of 42.2 percent and the small traders (not shown in chart) are Bearish with a score of 45.5 percent.
| SOYBEANS Futures Statistics | SPECULATORS | COMMERCIALS | SMALL TRADERS |
| – Percent of Open Interest Longs: | 27.4 | 51.6 | 6.9 |
| – Percent of Open Interest Shorts: | 9.9 | 66.7 | 9.3 |
| – Net Position: | 116,404 | -100,593 | -15,811 |
| – Gross Longs: | 182,539 | 343,275 | 45,953 |
| – Gross Shorts: | 66,135 | 443,868 | 61,764 |
| – Long to Short Ratio: | 2.8 to 1 | 0.8 to 1 | 0.7 to 1 |
| NET POSITION TREND: | |||
| – COT Index Score (3 Year Range Pct): | 59.1 | 42.2 | 45.5 |
| – COT Index Reading (3 Year Range): | Bullish | Bearish | Bearish |
| NET POSITION MOVEMENT INDEX: | |||
| – 6-Week Change in Strength Index: | -5.6 | 5.4 | -0.3 |
This week’s current strength score (the trader positioning range over the past three years, measured from 0 to 100) shows the speculators are currently Bullish with a score of 61.3 percent. The commercials are Bearish with a score of 40.4 percent and the small traders (not shown in chart) are Bearish with a score of 47.7 percent.
| SOYBEAN OIL Futures Statistics | SPECULATORS | COMMERCIALS | SMALL TRADERS |
| – Percent of Open Interest Longs: | 19.8 | 50.9 | 7.2 |
| – Percent of Open Interest Shorts: | 7.4 | 65.2 | 5.3 |
| – Net Position: | 59,517 | -68,690 | 9,173 |
| – Gross Longs: | 95,068 | 243,983 | 34,536 |
| – Gross Shorts: | 35,551 | 312,673 | 25,363 |
| – Long to Short Ratio: | 2.7 to 1 | 0.8 to 1 | 1.4 to 1 |
| NET POSITION TREND: | |||
| – COT Index Score (3 Year Range Pct): | 61.3 | 40.4 | 47.7 |
| – COT Index Reading (3 Year Range): | Bullish | Bearish | Bearish |
| NET POSITION MOVEMENT INDEX: | |||
| – 6-Week Change in Strength Index: | -14.1 | 17.1 | -32.9 |
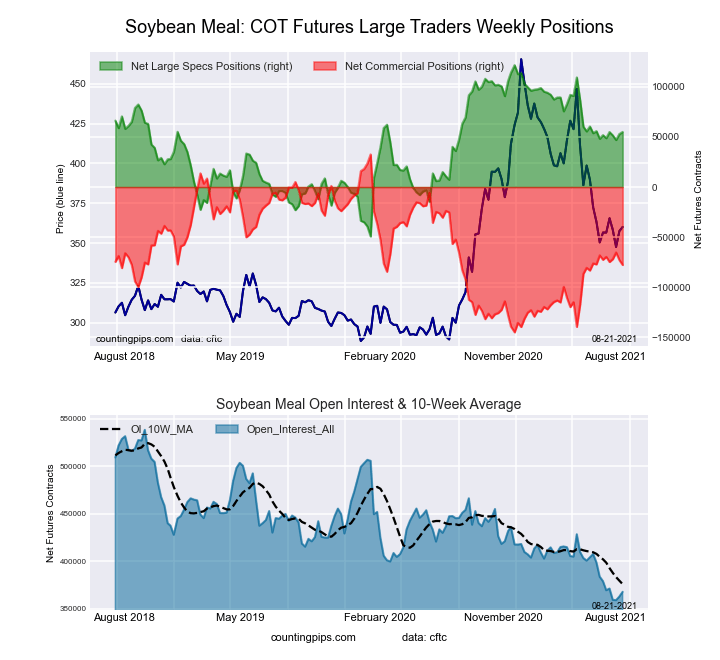
This week’s current strength score (the trader positioning range over the past three years, measured from 0 to 100) shows the speculators are currently Bullish with a score of 61.0 percent. The commercials are Bearish with a score of 37.9 percent and the small traders (not shown in chart) are Bullish with a score of 62.2 percent.
| SOYBEAN MEAL Futures Statistics | SPECULATORS | COMMERCIALS | SMALL TRADERS |
| – Percent of Open Interest Longs: | 22.9 | 51.5 | 12.8 |
| – Percent of Open Interest Shorts: | 8.0 | 72.7 | 6.6 |
| – Net Position: | 54,947 | -77,800 | 22,853 |
| – Gross Longs: | 84,323 | 189,483 | 47,117 |
| – Gross Shorts: | 29,376 | 267,283 | 24,264 |
| – Long to Short Ratio: | 2.9 to 1 | 0.7 to 1 | 1.9 to 1 |
| NET POSITION TREND: | |||
| – COT Index Score (3 Year Range Pct): | 61.0 | 37.9 | 62.2 |
| – COT Index Reading (3 Year Range): | Bullish | Bearish | Bullish |
| NET POSITION MOVEMENT INDEX: | |||
| – 6-Week Change in Strength Index: | 1.9 | -2.9 | 8.0 |
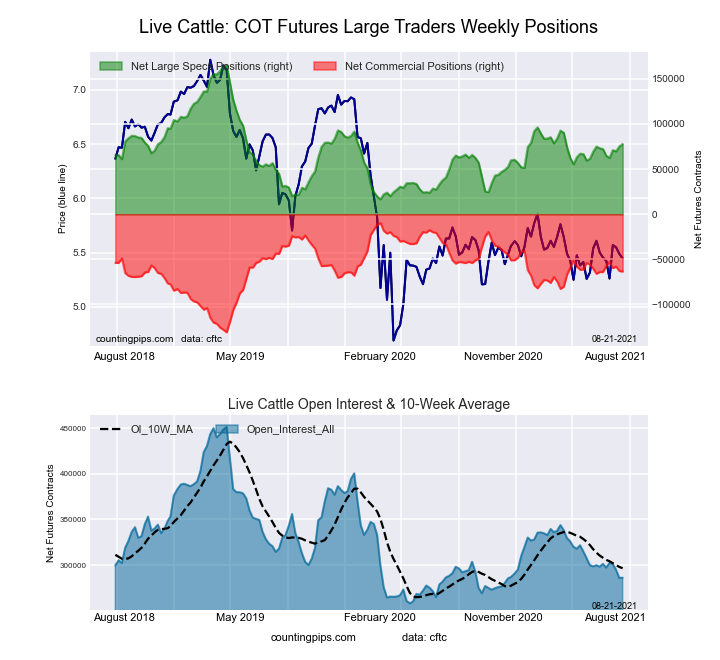
This week’s current strength score (the trader positioning range over the past three years, measured from 0 to 100) shows the speculators are currently Bearish with a score of 41.3 percent. The commercials are Bullish with a score of 55.6 percent and the small traders (not shown in chart) are Bullish with a score of 52.2 percent.
| LIVE CATTLE Futures Statistics | SPECULATORS | COMMERCIALS | SMALL TRADERS |
| – Percent of Open Interest Longs: | 39.2 | 39.8 | 9.5 |
| – Percent of Open Interest Shorts: | 12.0 | 62.0 | 14.5 |
| – Net Position: | 77,785 | -63,483 | -14,302 |
| – Gross Longs: | 112,252 | 113,928 | 27,221 |
| – Gross Shorts: | 34,467 | 177,411 | 41,523 |
| – Long to Short Ratio: | 3.3 to 1 | 0.6 to 1 | 0.7 to 1 |
| NET POSITION TREND: | |||
| – COT Index Score (3 Year Range Pct): | 41.3 | 55.6 | 52.2 |
| – COT Index Reading (3 Year Range): | Bearish | Bullish | Bullish |
| NET POSITION MOVEMENT INDEX: | |||
| – 6-Week Change in Strength Index: | 3.8 | 0.4 | -15.0 |
This week’s current strength score (the trader positioning range over the past three years, measured from 0 to 100) shows the speculators are currently Bullish-Extreme with a score of 87.9 percent. The commercials are Bearish-Extreme with a score of 18.3 percent and the small traders (not shown in chart) are Bearish-Extreme with a score of 10.7 percent.
| LEAN HOGS Futures Statistics | SPECULATORS | COMMERCIALS | SMALL TRADERS |
| – Percent of Open Interest Longs: | 44.5 | 30.4 | 7.3 |
| – Percent of Open Interest Shorts: | 16.9 | 52.7 | 12.6 |
| – Net Position: | 73,725 | -59,577 | -14,148 |
| – Gross Longs: | 118,725 | 81,135 | 19,482 |
| – Gross Shorts: | 45,000 | 140,712 | 33,630 |
| – Long to Short Ratio: | 2.6 to 1 | 0.6 to 1 | 0.6 to 1 |
| NET POSITION TREND: | |||
| – COT Index Score (3 Year Range Pct): | 87.9 | 18.3 | 10.7 |
| – COT Index Reading (3 Year Range): | Bullish-Extreme | Bearish-Extreme | Bearish-Extreme |
| NET POSITION MOVEMENT INDEX: | |||
| – 6-Week Change in Strength Index: | 3.8 | -1.2 | -11.4 |
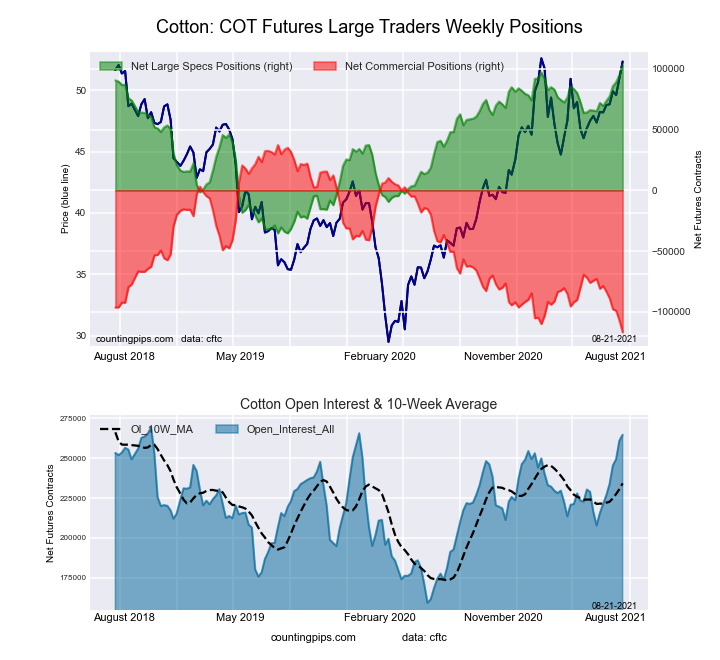
This week’s current strength score (the trader positioning range over the past three years, measured from 0 to 100) shows the speculators are currently Bullish-Extreme with a score of 100.0 percent. The commercials are Bearish-Extreme with a score of 0.0 percent and the small traders (not shown in chart) are Bullish-Extreme with a score of 100.0 percent.
| COTTON Futures Statistics | SPECULATORS | COMMERCIALS | SMALL TRADERS |
| – Percent of Open Interest Longs: | 44.4 | 35.7 | 7.9 |
| – Percent of Open Interest Shorts: | 5.5 | 79.9 | 2.6 |
| – Net Position: | 103,031 | -116,881 | 13,850 |
| – Gross Longs: | 117,526 | 94,528 | 20,808 |
| – Gross Shorts: | 14,495 | 211,409 | 6,958 |
| – Long to Short Ratio: | 8.1 to 1 | 0.4 to 1 | 3.0 to 1 |
| NET POSITION TREND: | |||
| – COT Index Score (3 Year Range Pct): | 100.0 | 0.0 | 100.0 |
| – COT Index Reading (3 Year Range): | Bullish-Extreme | Bearish-Extreme | Bullish-Extreme |
| NET POSITION MOVEMENT INDEX: | |||
| – 6-Week Change in Strength Index: | 24.2 | -24.8 | 29.3 |
This week’s current strength score (the trader positioning range over the past three years, measured from 0 to 100) shows the speculators are currently Bearish with a score of 35.5 percent. The commercials are Bullish with a score of 64.5 percent and the small traders (not shown in chart) are Bearish with a score of 39.9 percent.
| COCOA Futures Statistics | SPECULATORS | COMMERCIALS | SMALL TRADERS |
| – Percent of Open Interest Longs: | 27.3 | 48.2 | 4.7 |
| – Percent of Open Interest Shorts: | 22.0 | 54.6 | 3.6 |
| – Net Position: | 13,326 | -16,092 | 2,766 |
| – Gross Longs: | 68,772 | 121,390 | 11,767 |
| – Gross Shorts: | 55,446 | 137,482 | 9,001 |
| – Long to Short Ratio: | 1.2 to 1 | 0.9 to 1 | 1.3 to 1 |
| NET POSITION TREND: | |||
| – COT Index Score (3 Year Range Pct): | 35.5 | 64.5 | 39.9 |
| – COT Index Reading (3 Year Range): | Bearish | Bullish | Bearish |
| NET POSITION MOVEMENT INDEX: | |||
| – 6-Week Change in Strength Index: | -13.3 | 15.1 | -26.6 |
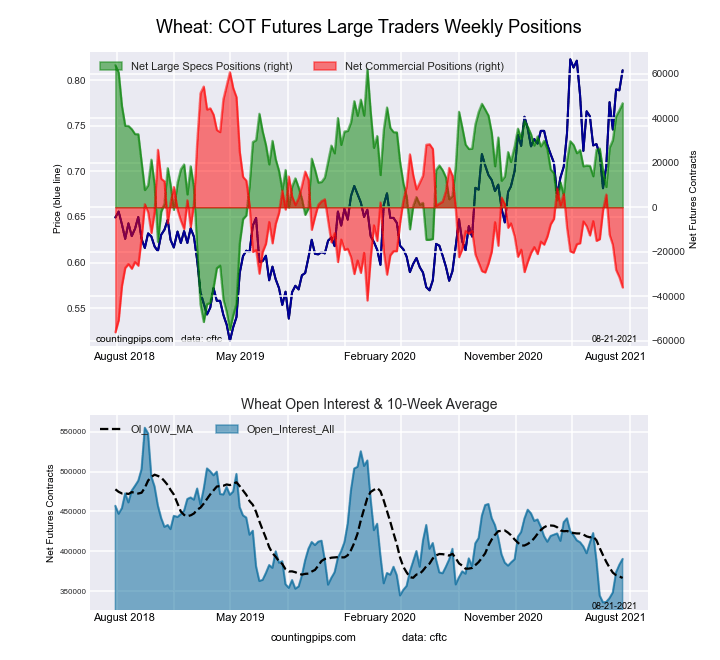
This week’s current strength score (the trader positioning range over the past three years, measured from 0 to 100) shows the speculators are currently Bullish-Extreme with a score of 85.6 percent. The commercials are Bearish-Extreme with a score of 17.2 percent and the small traders (not shown in chart) are Bullish with a score of 50.4 percent.
| WHEAT Futures Statistics | SPECULATORS | COMMERCIALS | SMALL TRADERS |
| – Percent of Open Interest Longs: | 35.2 | 35.5 | 7.7 |
| – Percent of Open Interest Shorts: | 23.2 | 44.7 | 10.5 |
| – Net Position: | 46,794 | -36,088 | -10,706 |
| – Gross Longs: | 137,475 | 138,516 | 30,181 |
| – Gross Shorts: | 90,681 | 174,604 | 40,887 |
| – Long to Short Ratio: | 1.5 to 1 | 0.8 to 1 | 0.7 to 1 |
| NET POSITION TREND: | |||
| – COT Index Score (3 Year Range Pct): | 85.6 | 17.2 | 50.4 |
| – COT Index Reading (3 Year Range): | Bullish-Extreme | Bearish-Extreme | Bullish |
| NET POSITION MOVEMENT INDEX: | |||
| – 6-Week Change in Strength Index: | 25.4 | -29.7 | 21.6 |
Article By CountingPips.com – Receive our weekly COT Reports by Email
*COT Report: The COT data, released weekly to the public each Friday, is updated through the most recent Tuesday (data is 3 days old) and shows a quick view of how large speculators or non-commercials (for-profit traders) were positioned in the futures markets.
The CFTC categorizes trader positions according to commercial hedgers (traders who use futures contracts for hedging as part of the business), non-commercials (large traders who speculate to realize trading profits) and nonreportable traders (usually small traders/speculators).
Find CFTC criteria here: (http://www.cftc.gov/MarketReports/CommitmentsofTraders/ExplanatoryNotes/index.htm).
By ForexTime FXTM’s USDInd ↑ 2% MTD Dollar best performing G10 currency MTD Geopolitical risk…
By JustMarkets The US stock market concluded Thursday’s session in the red as the escalating…
By Analytical Department RoboForex EUR/USD is holding near 1.1620 on Friday, with the US dollar…
By JustMarkets The US stock market rose on Wednesday. By the end of the day,…
By Daniele D'Alvia, Queen Mary University of London When a conflict escalates, financial markets respond…
By Analytical Department RoboForex GBP/USD contracted to 1.3350 on Thursday, with the pound remaining under…
This website uses cookies.