By Dmitriy Gurkovskiy, Chief Analyst at RoboForex
Early in the final week of April, EUR/USD is falling a little bit but still remains close to its seven-week highs. The asset is trading mostly at 1.2091.
The USD remains weak despite the stable statistics from the USA and the US 10-year bond yield. At the same time, the European currency is supported by the attitude of global investors to risks. The number from the Euro Area published last Friday showed that the April PMI reports in the region turned out to be better than expected, thus providing support to the Euro.
This week, market players will be focused on the US Federal Reserve System Meeting. Most likely, the Fed Chairman Jerome Powell will hint at the fact that expectations of earlier reduction of the regulator’s stimulus programs have no grounds. It may put some additional pressure on the “greenback”.
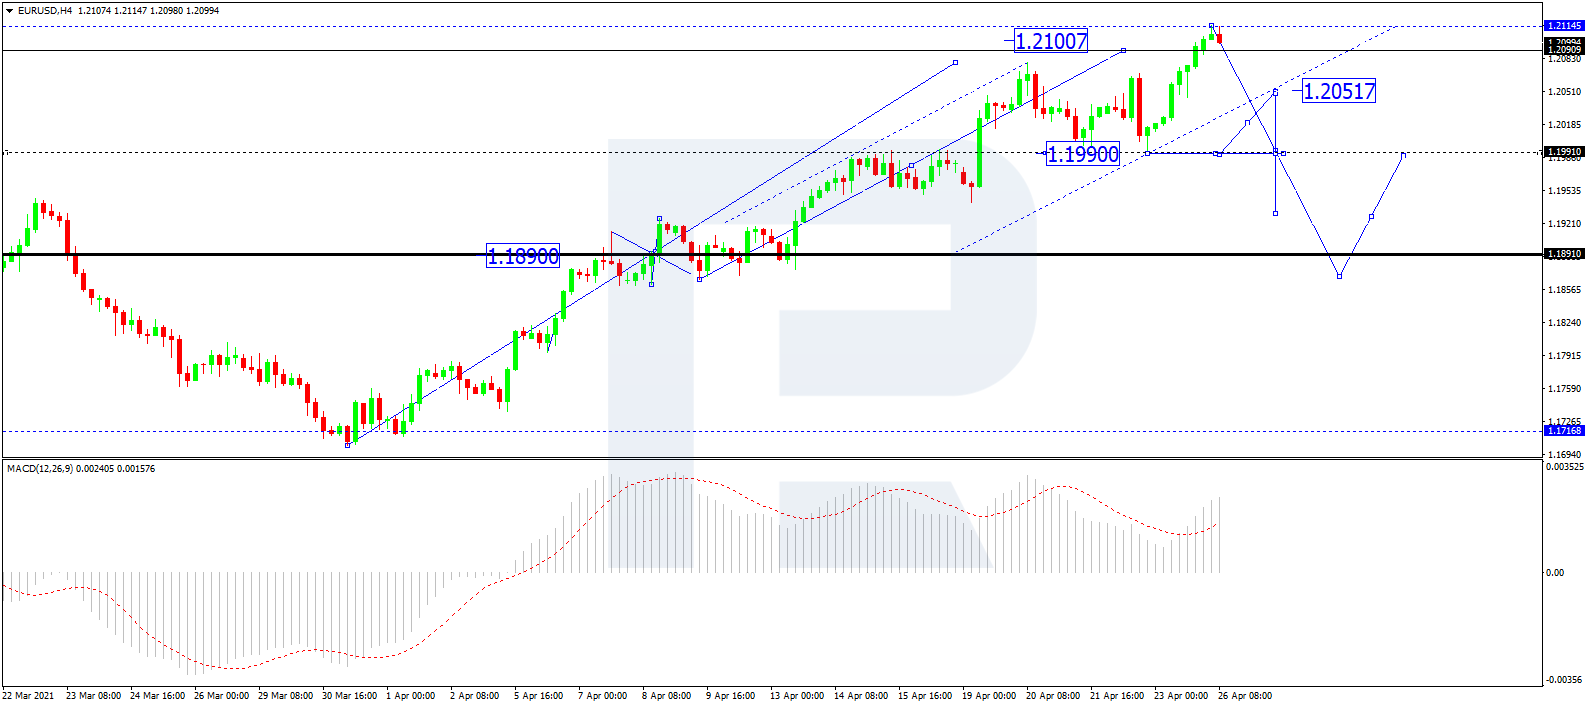
In the H4 chart, after completing the ascending wave at 1.2120, EUR/USD is consolidating at its top. If the price breaks this range to the downside, the market may resume trading downwards with the first target at 1.1890. From the technical point of view, this scenario is confirmed by MACD Oscillator: its signal line is moving above 0 outside the histogram area so far. Later, the line is expected to break leave the area and continue falling towards 0, a breakout of which will result in further decline.
Free Reports:
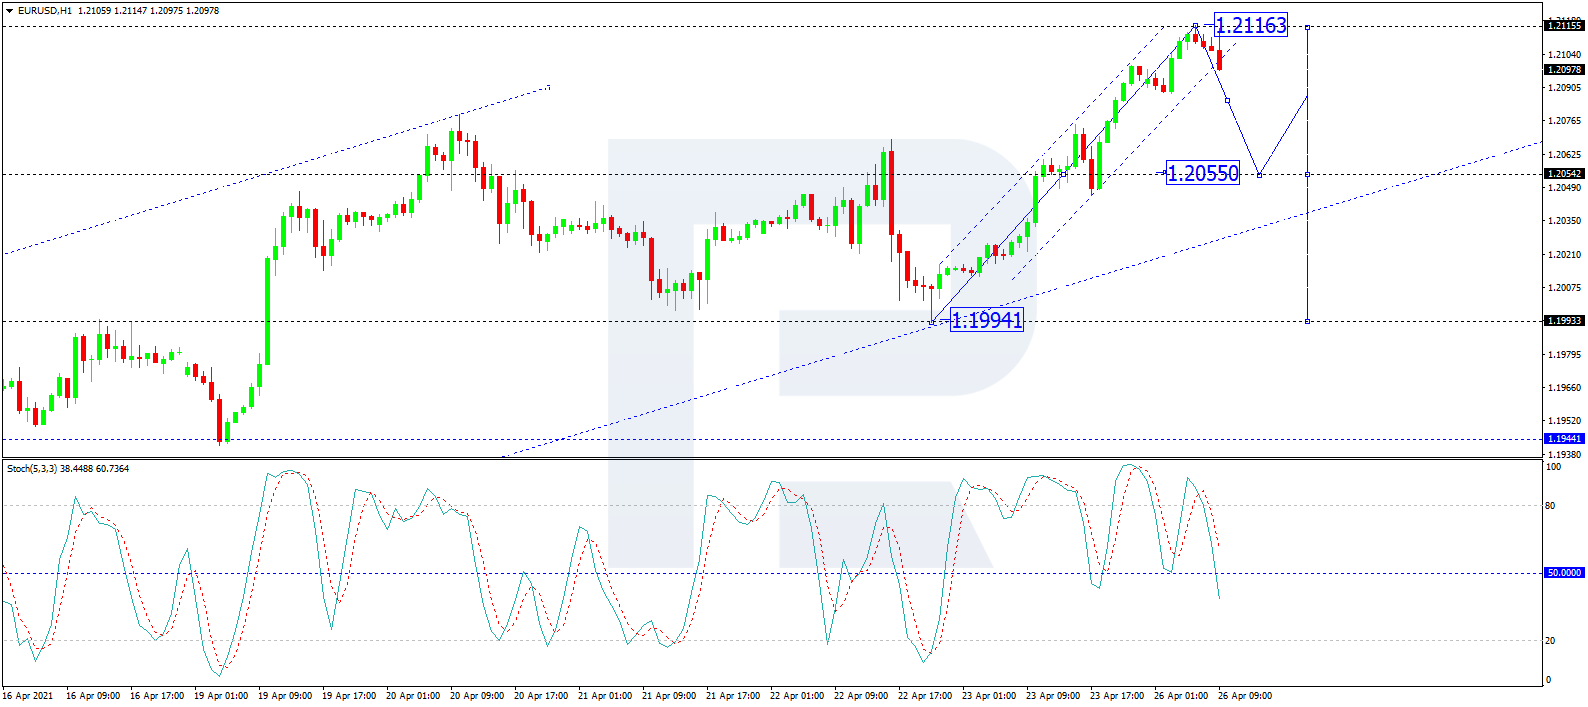
As we can see in the H1 chart, EUR/USD is forming a descending impulse towards 1.2055. After that, the instrument may correct to reach 1.12085 to complete the correction. Later, the market may fall to break 1.2055 and then continue trading downwards with the target at 1.1994. From the technical point of view, this scenario is confirmed by the Stochastic Oscillator: after breaking 50 to the downside, its signal line is steadily falling towards 20.
Disclaimer
Any forecasts contained herein are based on the author’s particular opinion. This analysis may not be treated as trading advice. RoboForex bears no responsibility for trading results based on trading recommendations and reviews contained herein.
By Jeffrey Young, Georgia Institute of Technology You’ve probably heard artificial intelligence models described as…
Source: Barry Dawes (7/23/26) Barry Dawes of Martin Place Securities shares his analysis of the…
By JustMarkets The US stock indices ended Thursday’s session with a notable decline amid a…
By Analytical Department RoboForex USD/JPY soared to 163.81 on Friday, marking a new 40-year high.…
By JustMarkets The US equities ended Wednesday’s session lower amid investor caution ahead of the…
By Analytical Department RoboForex EUR/USD rose to 1.1429 on Thursday, with the US dollar continuing…
This website uses cookies.