Author: Dmitriy Gurkovskiy, Chief Analyst at RoboForex
On Monday, March 22nd, Brent remains under pressure after losing almost 8% at a time last week. The asset is trading at $64.00 and bears are still quite active.
So, what happened? At first, a bearish signal came from Asia when Chinese and Japanese consumers reduced their demand for energies. There were rumors on the market that Asia was getting illegal oil from Iran, and that’s a trigger for the US-Iran conflict. In addition to that, after the March meeting of the US Federal Reserve System, there was a sale of securities on American markets, which resulted in the US bond yield growth. The “greenback” quickly rose, thus putting pressure on different assets, including oil.
On top of that, oil was trading quite high without any reasons except for expectations. The uncertainty about the stability of such a movement led to a large-scale closure of long positions, which made the players who were rather neutral earlier join it. Eventually, it resulted in a galloping selling.
Right now, Brent remains weak and may yet continue slowly falling in medium volumes based on the above-mentioned factors.
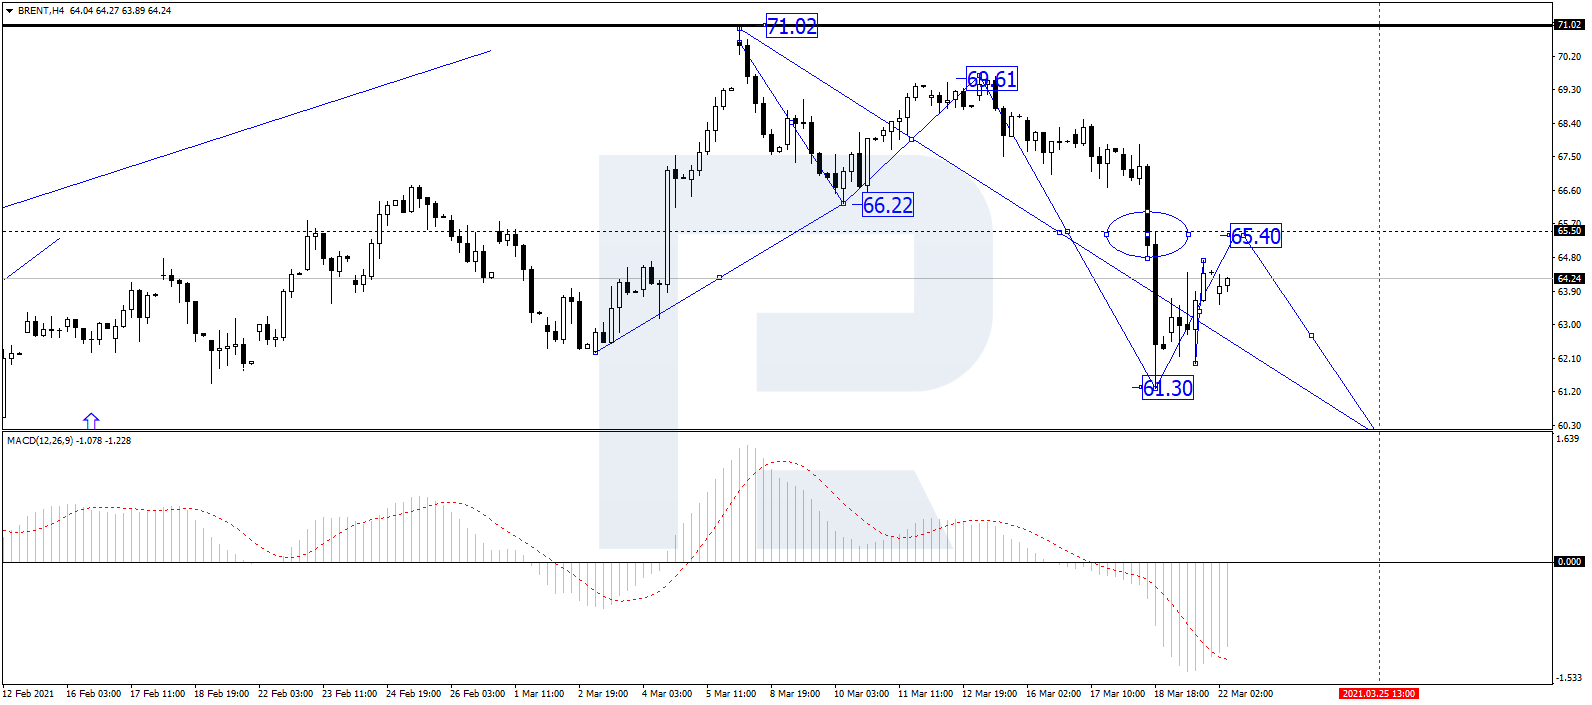
In the H4 chart, after rebounding from 61.30, Brent is forming another ascending wave to reach 65.40. In fact, the asset is correcting with the first target at 60.00. After that, the instrument may start another growth towards 65.40. From the technical point of view, this scenario is confirmed by MACD Oscillator: its signal line is moving outside the histogram area to grow and reach 0.
Free Reports:
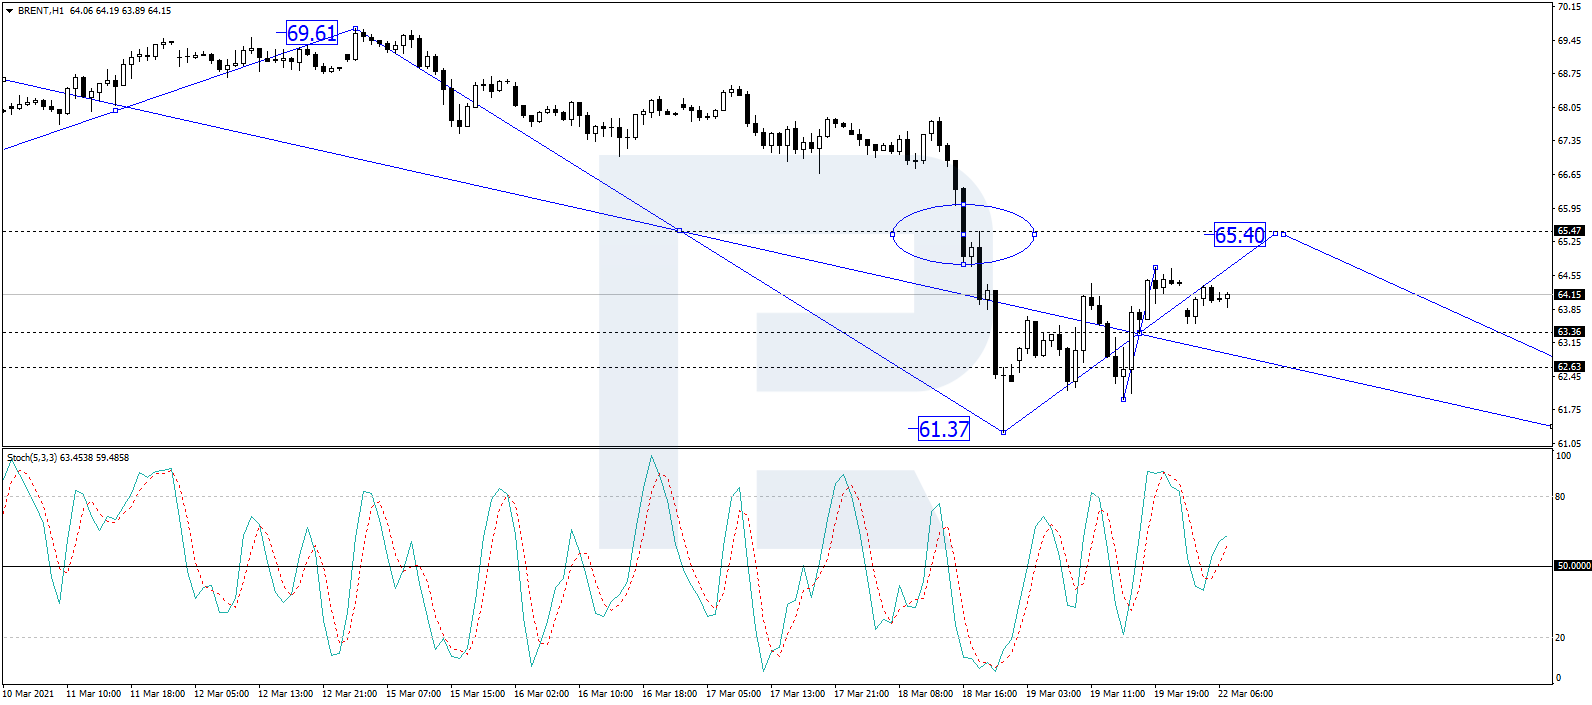
As we can see in the H1 chart, Brent is growing towards 65.40. Possibly, today the asset may reach this level and then form a new descending wave with the first target at 60.00. From the technical point of view, this idea is confirmed by the Stochastic Oscillator: its signal line growing towards 80 and may later resume falling to reach 80, thus confirming a further downtrend on the price chart.
Disclaimer
Any forecasts contained herein are based on the author’s particular opinion. This analysis may not be treated as trading advice. RoboForex bears no responsibility for trading results based on trading recommendations and reviews contained herein.
By ForexTime FXTM’s USDInd ↑ 2% MTD Dollar best performing G10 currency MTD Geopolitical risk…
By JustMarkets The US stock market concluded Thursday’s session in the red as the escalating…
By Analytical Department RoboForex EUR/USD is holding near 1.1620 on Friday, with the US dollar…
By JustMarkets The US stock market rose on Wednesday. By the end of the day,…
By Daniele D'Alvia, Queen Mary University of London When a conflict escalates, financial markets respond…
By Analytical Department RoboForex GBP/USD contracted to 1.3350 on Thursday, with the pound remaining under…
This website uses cookies.