By CountingPips.com – Receive our weekly COT Reports by Email
Here are the latest charts and statistics for the Commitment of Traders (COT) data published by the Commodities Futures Trading Commission (CFTC).
The latest COT data is updated through Tuesday March 16 2021 and shows a quick view of how large traders (for-profit speculators and commercial entities) were positioned in the futures markets.
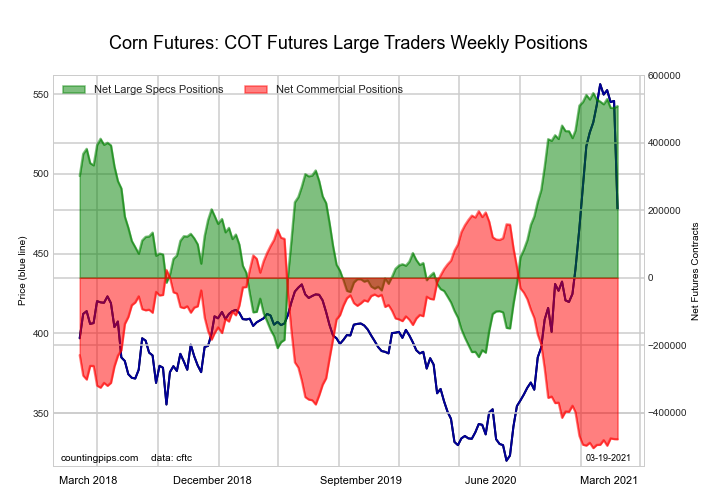
| CORN Futures Statistics | SPECULATORS | COMMERCIALS | SMALL TRADERS |
| – Percent of Open Interest Longs: | 32.6 | 46.8 | 8.3 |
| – Percent of Open Interest Shorts: | 4.1 | 73.6 | 10.0 |
| – Net Position: | 509,084 | -478,665 | -30,419 |
| – Gross Longs: | 583,279 | 838,502 | 149,310 |
| – Gross Shorts: | 74,195 | 1,317,167 | 179,729 |
| – Long to Short Ratio: | 7.9 to 1 | 0.6 to 1 | 0.8 to 1 |
| NET POSITION TREND: | |||
| – COT Index Score (3 Year Range Pct): | 95.1 | 3.8 | 30.1 |
| – COT Index Reading (3 Year Range): | Bullish-Extreme | Bearish-Extreme | Bearish |
| NET POSITION MOVEMENT INDEX: | |||
| – 6-Week Change in Strength Index: | -2.5 | 2.4 | 1.4 |
Free Reports:
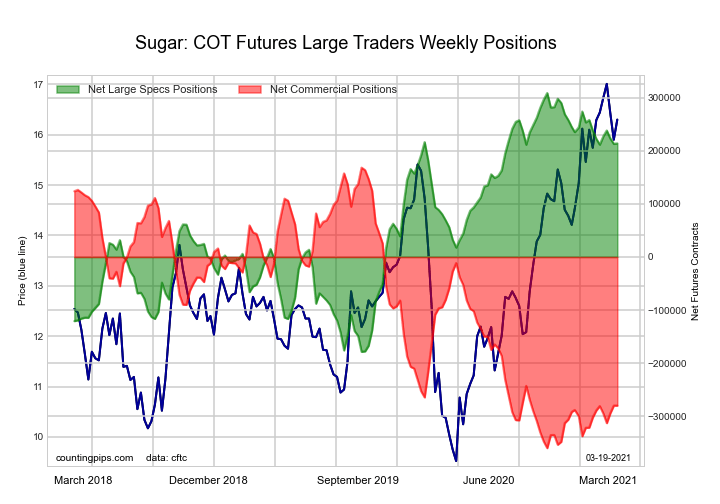
| SUGAR Futures Statistics | SPECULATORS | COMMERCIALS | SMALL TRADERS |
| – Percent of Open Interest Longs: | 26.1 | 49.6 | 10.2 |
| – Percent of Open Interest Shorts: | 5.7 | 76.2 | 3.9 |
| – Net Position: | 213,767 | -279,633 | 65,866 |
| – Gross Longs: | 273,487 | 519,254 | 106,364 |
| – Gross Shorts: | 59,720 | 798,887 | 40,498 |
| – Long to Short Ratio: | 4.6 to 1 | 0.6 to 1 | 2.6 to 1 |
| NET POSITION TREND: | |||
| – COT Index Score (3 Year Range Pct): | 80.5 | 15.1 | 89.4 |
| – COT Index Reading (3 Year Range): | Bullish-Extreme | Bearish-Extreme | Bullish-Extreme |
| NET POSITION MOVEMENT INDEX: | |||
| – 6-Week Change in Strength Index: | -1.8 | 1.8 | -0.7 |
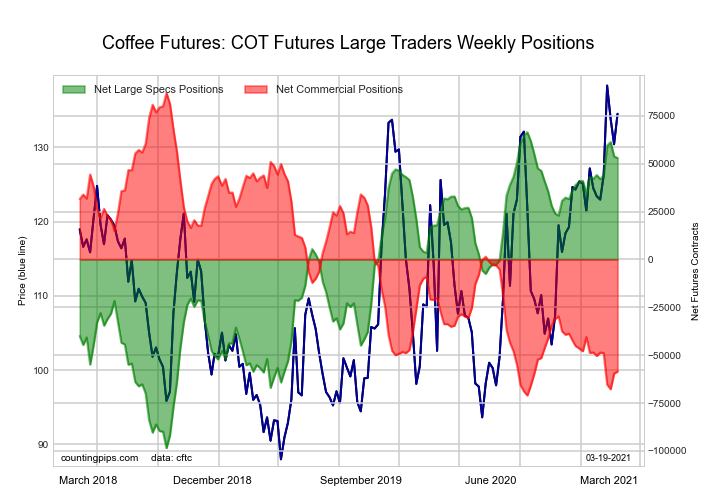
| COFFEE Futures Statistics | SPECULATORS | COMMERCIALS | SMALL TRADERS |
| – Percent of Open Interest Longs: | 27.0 | 45.0 | 4.1 |
| – Percent of Open Interest Shorts: | 8.0 | 65.9 | 2.1 |
| – Net Position: | 52,943 | -58,502 | 5,559 |
| – Gross Longs: | 75,413 | 125,745 | 11,530 |
| – Gross Shorts: | 22,470 | 184,247 | 5,971 |
| – Long to Short Ratio: | 3.4 to 1 | 0.7 to 1 | 1.9 to 1 |
| NET POSITION TREND: | |||
| – COT Index Score (3 Year Range Pct): | 91.9 | 7.9 | 26.8 |
| – COT Index Reading (3 Year Range): | Bullish-Extreme | Bearish-Extreme | Bearish |
| NET POSITION MOVEMENT INDEX: | |||
| – 6-Week Change in Strength Index: | 5.4 | -5.2 | -5.1 |
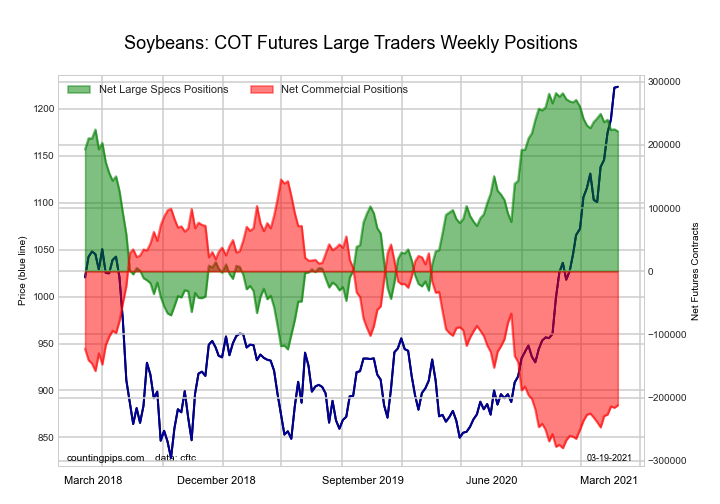
| SOYBEANS Futures Statistics | SPECULATORS | COMMERCIALS | SMALL TRADERS |
| – Percent of Open Interest Longs: | 31.0 | 45.7 | 7.9 |
| – Percent of Open Interest Shorts: | 5.1 | 70.5 | 9.0 |
| – Net Position: | 221,531 | -212,051 | -9,480 |
| – Gross Longs: | 265,531 | 391,676 | 67,451 |
| – Gross Shorts: | 44,000 | 603,727 | 76,931 |
| – Long to Short Ratio: | 6.0 to 1 | 0.6 to 1 | 0.9 to 1 |
| NET POSITION TREND: | |||
| – COT Index Score (3 Year Range Pct): | 85.1 | 15.9 | 69.7 |
| – COT Index Reading (3 Year Range): | Bullish-Extreme | Bearish-Extreme | Bullish |
| NET POSITION MOVEMENT INDEX: | |||
| – 6-Week Change in Strength Index: | -5.1 | 6.3 | -6.7 |
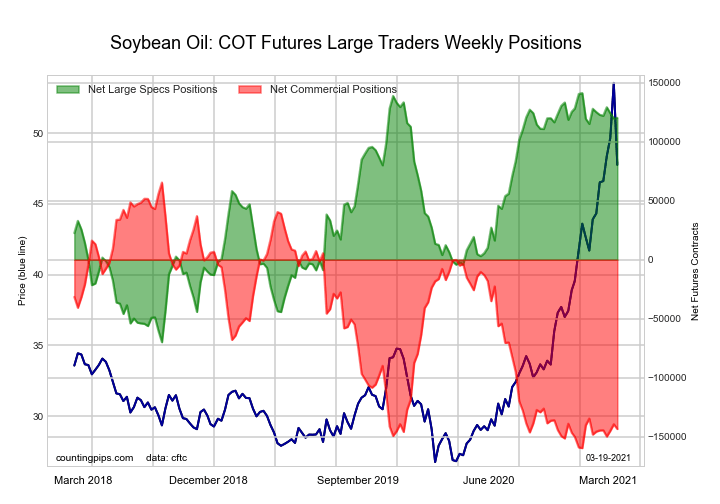
| SOYBEAN OIL Futures Statistics | SPECULATORS | COMMERCIALS | SMALL TRADERS |
| – Percent of Open Interest Longs: | 30.8 | 41.6 | 10.0 |
| – Percent of Open Interest Shorts: | 6.6 | 70.5 | 5.3 |
| – Net Position: | 120,152 | -143,351 | 23,199 |
| – Gross Longs: | 152,943 | 206,802 | 49,602 |
| – Gross Shorts: | 32,791 | 350,153 | 26,403 |
| – Long to Short Ratio: | 4.7 to 1 | 0.6 to 1 | 1.9 to 1 |
| NET POSITION TREND: | |||
| – COT Index Score (3 Year Range Pct): | 90.0 | 7.2 | 100.0 |
| – COT Index Reading (3 Year Range): | Bullish-Extreme | Bearish-Extreme | Bullish-Extreme |
| NET POSITION MOVEMENT INDEX: | |||
| – 6-Week Change in Strength Index: | -2.3 | 1.0 | 9.8 |
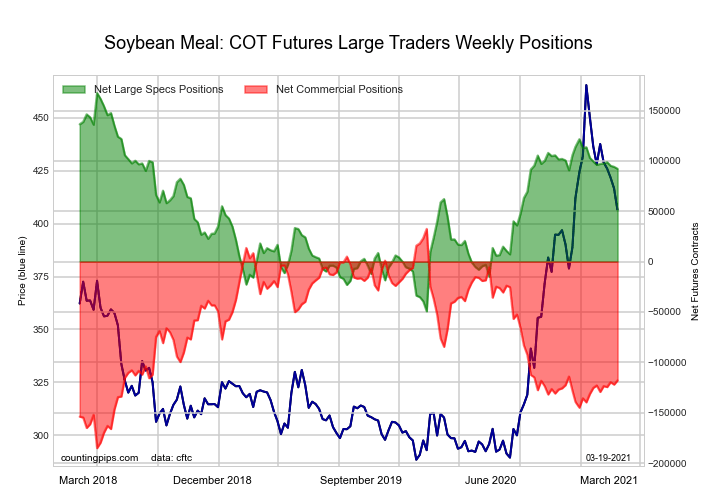
| SOYBEAN MEAL Futures Statistics | SPECULATORS | COMMERCIALS | SMALL TRADERS |
| – Percent of Open Interest Longs: | 26.1 | 48.4 | 12.8 |
| – Percent of Open Interest Shorts: | 3.8 | 76.9 | 6.6 |
| – Net Position: | 92,181 | -117,934 | 25,753 |
| – Gross Longs: | 107,983 | 200,737 | 52,925 |
| – Gross Shorts: | 15,802 | 318,671 | 27,172 |
| – Long to Short Ratio: | 6.8 to 1 | 0.6 to 1 | 1.9 to 1 |
| NET POSITION TREND: | |||
| – COT Index Score (3 Year Range Pct): | 65.3 | 30.9 | 73.8 |
| – COT Index Reading (3 Year Range): | Bullish | Bearish | Bullish |
| NET POSITION MOVEMENT INDEX: | |||
| – 6-Week Change in Strength Index: | -1.9 | 2.3 | -3.9 |
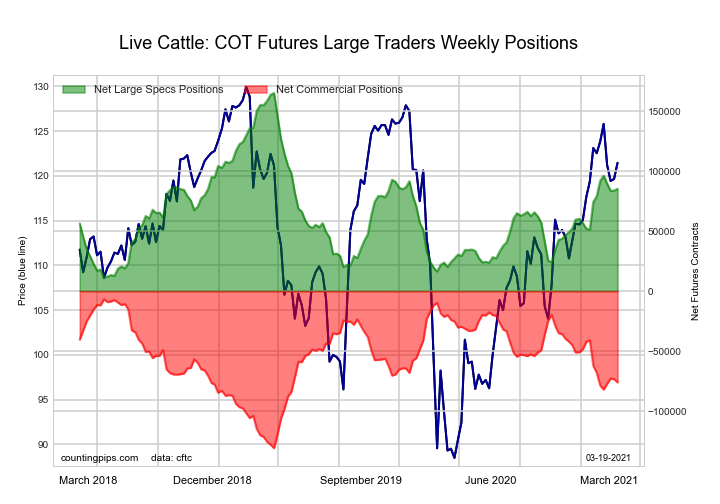
| LIVE CATTLE Futures Statistics | SPECULATORS | COMMERCIALS | SMALL TRADERS |
| – Percent of Open Interest Longs: | 36.2 | 35.9 | 10.0 |
| – Percent of Open Interest Shorts: | 11.1 | 58.3 | 12.7 |
| – Net Position: | 85,285 | -76,008 | -9,277 |
| – Gross Longs: | 123,037 | 121,864 | 33,844 |
| – Gross Shorts: | 37,752 | 197,872 | 43,121 |
| – Long to Short Ratio: | 3.3 to 1 | 0.6 to 1 | 0.8 to 1 |
| NET POSITION TREND: | |||
| – COT Index Score (3 Year Range Pct): | 48.1 | 44.2 | 64.5 |
| – COT Index Reading (3 Year Range): | Bearish | Bearish | Bullish |
| NET POSITION MOVEMENT INDEX: | |||
| – 6-Week Change in Strength Index: | 4.0 | -6.4 | 4.4 |
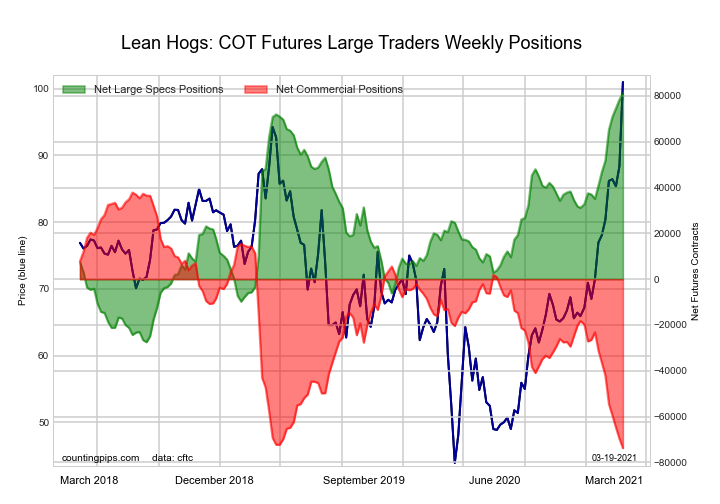
| LEAN HOGS Futures Statistics | SPECULATORS | COMMERCIALS | SMALL TRADERS |
| – Percent of Open Interest Longs: | 42.6 | 30.8 | 9.1 |
| – Percent of Open Interest Shorts: | 12.6 | 57.9 | 11.9 |
| – Net Position: | 81,267 | -73,742 | -7,525 |
| – Gross Longs: | 115,538 | 83,469 | 24,637 |
| – Gross Shorts: | 34,271 | 157,211 | 32,162 |
| – Long to Short Ratio: | 3.4 to 1 | 0.5 to 1 | 0.8 to 1 |
| NET POSITION TREND: | |||
| – COT Index Score (3 Year Range Pct): | 100.0 | 0.0 | 42.0 |
| – COT Index Reading (3 Year Range): | Bullish-Extreme | Bearish-Extreme | Bearish |
| NET POSITION MOVEMENT INDEX: | |||
| – 6-Week Change in Strength Index: | 31.6 | -33.4 | 13.3 |
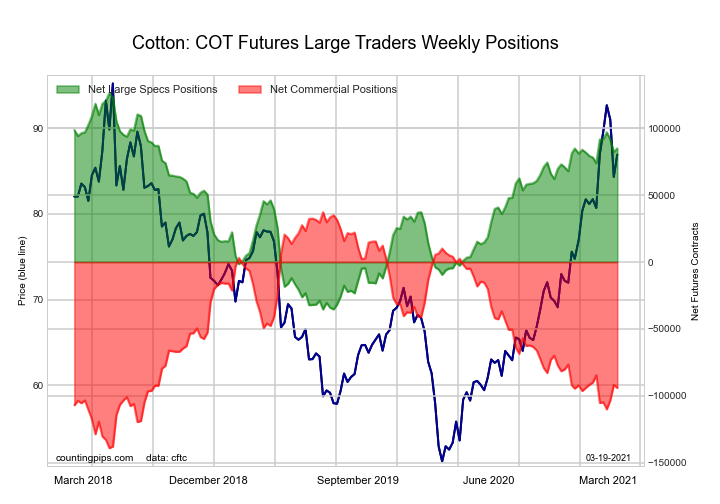
| COTTON Futures Statistics | SPECULATORS | COMMERCIALS | SMALL TRADERS |
| – Percent of Open Interest Longs: | 40.2 | 41.1 | 7.1 |
| – Percent of Open Interest Shorts: | 3.6 | 81.6 | 3.1 |
| – Net Position: | 84,949 | -94,117 | 9,168 |
| – Gross Longs: | 93,354 | 95,370 | 16,432 |
| – Gross Shorts: | 8,405 | 189,487 | 7,264 |
| – Long to Short Ratio: | 11.1 to 1 | 0.5 to 1 | 2.3 to 1 |
| NET POSITION TREND: | |||
| – COT Index Score (3 Year Range Pct): | 74.4 | 25.5 | 66.1 |
| – COT Index Reading (3 Year Range): | Bullish | Bearish | Bullish |
| NET POSITION MOVEMENT INDEX: | |||
| – 6-Week Change in Strength Index: | 6.8 | -5.4 | -9.1 |
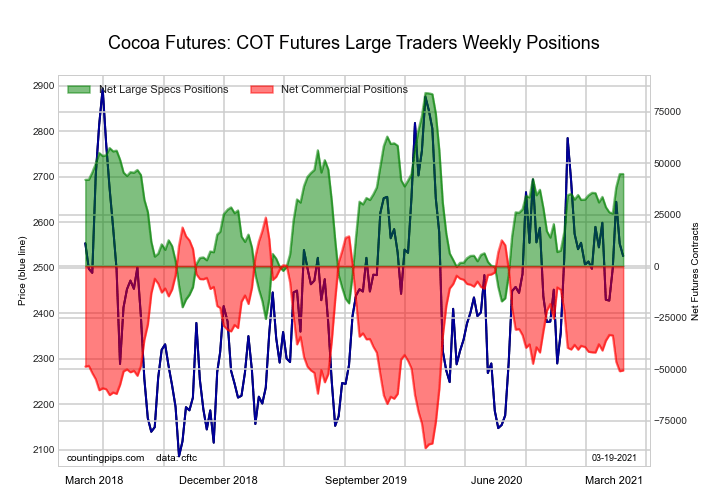
| COCOA Futures Statistics | SPECULATORS | COMMERCIALS | SMALL TRADERS |
| – Percent of Open Interest Longs: | 37.1 | 37.4 | 5.6 |
| – Percent of Open Interest Shorts: | 15.1 | 62.3 | 2.8 |
| – Net Position: | 44,756 | -50,579 | 5,823 |
| – Gross Longs: | 75,411 | 76,055 | 11,434 |
| – Gross Shorts: | 30,655 | 126,634 | 5,611 |
| – Long to Short Ratio: | 2.5 to 1 | 0.6 to 1 | 2.0 to 1 |
| NET POSITION TREND: | |||
| – COT Index Score (3 Year Range Pct): | 64.1 | 33.7 | 74.7 |
| – COT Index Reading (3 Year Range): | Bullish | Bearish | Bullish |
| NET POSITION MOVEMENT INDEX: | |||
| – 6-Week Change in Strength Index: | 10.1 | -8.7 | -16.2 |
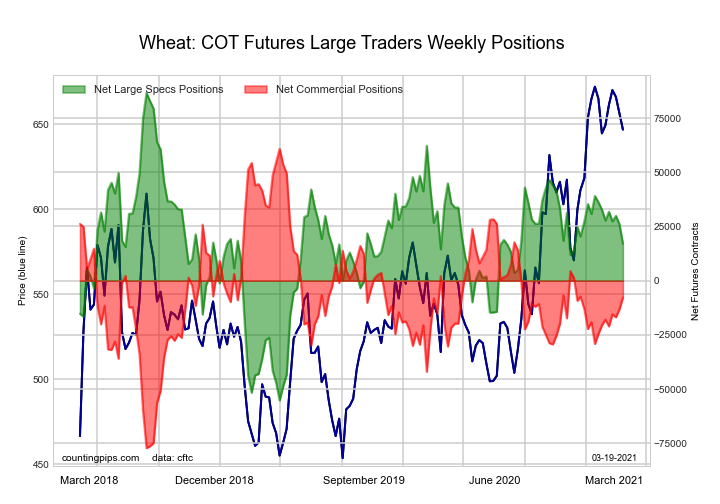
| WHEAT Futures Statistics | SPECULATORS | COMMERCIALS | SMALL TRADERS |
| – Percent of Open Interest Longs: | 28.2 | 37.7 | 8.0 |
| – Percent of Open Interest Shorts: | 24.1 | 39.6 | 10.2 |
| – Net Position: | 17,056 | -7,681 | -9,375 |
| – Gross Longs: | 118,153 | 158,201 | 33,353 |
| – Gross Shorts: | 101,097 | 165,882 | 42,728 |
| – Long to Short Ratio: | 1.2 to 1 | 1.0 to 1 | 0.8 to 1 |
| NET POSITION TREND: | |||
| – COT Index Score (3 Year Range Pct): | 51.0 | 50.4 | 56.8 |
| – COT Index Reading (3 Year Range): | Bullish | Bullish | Bullish |
| NET POSITION MOVEMENT INDEX: | |||
| – 6-Week Change in Strength Index: | -11.1 | 9.3 | 13.8 |
Article By CountingPips.com – Receive our weekly COT Reports by Email
*COT Report: The COT data, released weekly to the public each Friday, is updated through the most recent Tuesday (data is 3 days old) and shows a quick view of how large speculators or non-commercials (for-profit traders) were positioned in the futures markets.
The CFTC categorizes trader positions according to commercial hedgers (traders who use futures contracts for hedging as part of the business), non-commercials (large traders who speculate to realize trading profits) and nonreportable traders (usually small traders/speculators).
Find CFTC criteria here: (http://www.cftc.gov/MarketReports/CommitmentsofTraders/ExplanatoryNotes/index.htm).
By InvestMacro Here are the latest charts and statistics for the Commitment of Traders (COT)…
By InvestMacro The latest update for the weekly Commitment of Traders (COT) report was released…
By InvestMacro Here are the latest charts and statistics for the Commitment of Traders (COT)…
By InvestMacro Here are the latest charts and statistics for the Commitment of Traders (COT)…
By InvestMacro Here are the latest charts and statistics for the Commitment of Traders (COT)…
By InvestMacro Here are the latest charts and statistics for the Commitment of Traders (COT)…
This website uses cookies.