
By Lukman Otunuga, Research Analyst, ForexTime
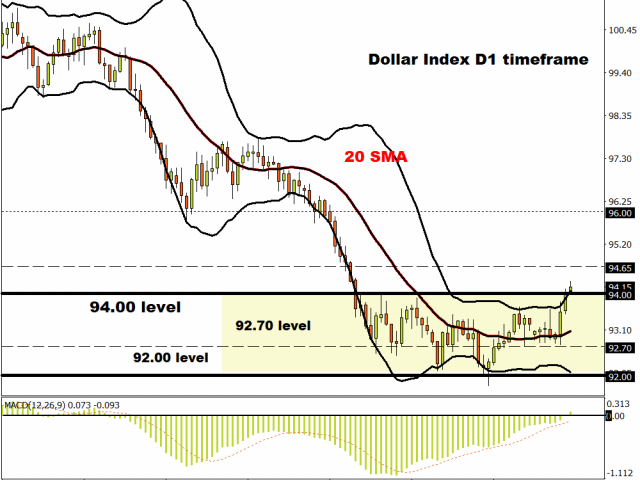
Stock markets are striving to claw back Monday’s sharp selloff after yesterday’s price action stalled the bears with the printing of an ‘inside day’ candle. This is when the trading day’s high and low lies within the boundaries of the previous day’s high and lows, and indicates indecision in the market. The Dollar has hit two-month highs this morning as US fiscal uncertainty and increasing Covid worries dominate price action.
Investors appear to have shrugged off the earlier PMI data showing that European economies were recovering at a slower pace than expected from restrictions and lockdowns. The composite reading – covering both manufacturing and services – printed at 50.1 for September, below the 51.7 expected.
Digging deeper into the surveys reveals a two-speed economy with encouraging signs of recovery buoyed by rising demand in manufacturing, from export markets and the reopening of retail. But the larger services sector has fallen back into decline, sinking from 50.5 to 47.6, as businesses revealed that the resurgence of new virus cases was an important driver of weakening activity. The UK PMI data also showed that the economy had lost some of its bounce with the initial rebound from lockdowns now fading.
RBNZ takes a step towards negative rates
Free Reports:
 Download Our Metatrader 4 Indicators – Put Our Free MetaTrader 4 Custom Indicators on your charts when you join our Weekly Newsletter
 Get our Weekly Commitment of Traders Reports - See where the biggest traders (Hedge Funds and Commercial Hedgers) are positioned in the futures markets on a weekly basis.
The Kiwi is the weakest major on the board today even as the RBNZ kept rates and new policy measures on hold as expected. The highlight in the statement was a pledge to adopt a Funding for Lending Programme by year-end which would represent one more push towards negative rates, with more stimulus announced ahead of this before the end of the year.
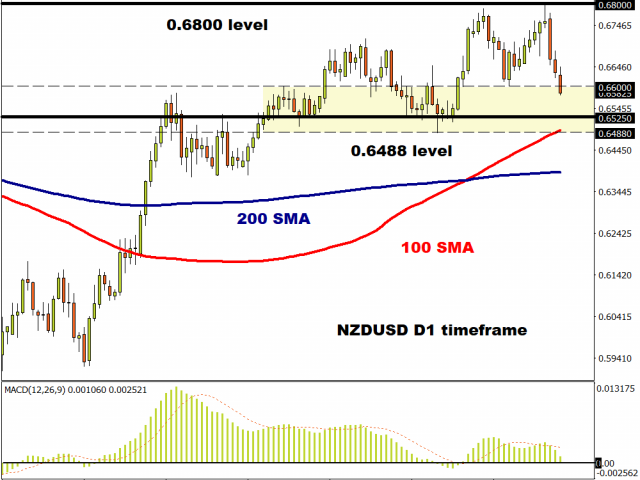
NZD/USD is currently trading at the bottom of a ‘double top’ pattern on the daily chart with momentum looking good for more downside. The weekly chart too is significant as bulls have recently been capped three times at the 200-week Moving Average, an indicator that has been fairly reliable historically in pushing the pair lower. If this does happen, the August low at 0.6488 will be the next target which coincides with the 100-day MA.
Disclaimer: The content in this article comprises personal opinions and should not be construed as containing personal and/or other investment advice and/or an offer of and/or solicitation for any transactions in financial instruments and/or a guarantee and/or prediction of future performance. ForexTime (FXTM), its affiliates, agents, directors, officers or employees do not guarantee the accuracy, validity, timeliness or completeness, of any information or data made available and assume no liability as to any loss arising from any investment based on the same.
![]() Article by ForexTime
Article by ForexTime
ForexTime Ltd (FXTM) is an award winning international online forex broker regulated by CySEC 185/12 www.forextime.com

- The Tech‑heavy NASDAQ Index jumped by more than 3.3%. The offshore yuan is trading at its highest level since 2023 Jul 31, 2026
- USD/JPY After Volatility: Multiple Events in One Day Jul 31, 2026
- The US indices sell off amid renewed US-Iran clashes. Oil jumps by 7% Jul 30, 2026
- USD/JPY Temporary in Equilibrium: Multiple Factors in Focus Jul 30, 2026
- GBP/USD at Month’s Lows: The Outlook Remains Weak Jul 29, 2026
- Crude oil falls below $80 per barrel. Australia sees inflation slowdown Jul 29, 2026
- The US Tech sector hit by sell‑off. Oil prices decline on renewed negotiations Jul 28, 2026
- Gold Declines, Focus on Fed and Falling Oil Prices Jul 28, 2026
- This week will be one of the most crowded for central‑bank meetings Jul 27, 2026
- EUR/USD Ahead of a Key Week: Holding Near Lows Jul 27, 2026