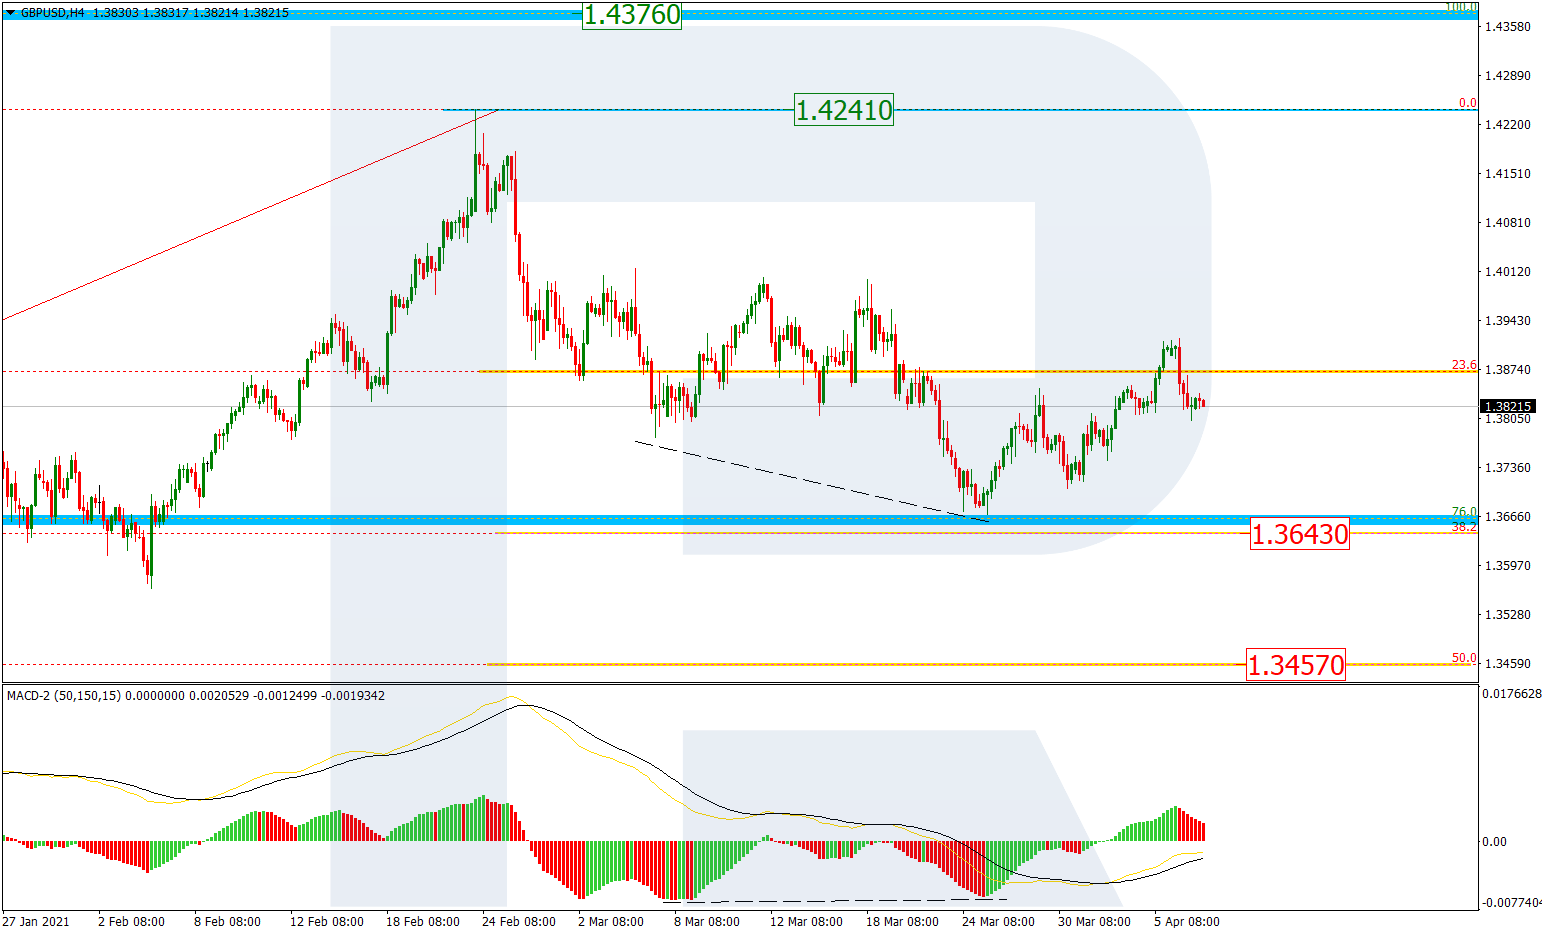
On H4, the correctional wave of growth first returned to 23.6% and now we may expect another wave of decline to 38.2% (1.3643) Fibo. The aim of further decline after a breakaway of 38.2% will be 50.0% (1.3457). A breakaway of the high of 1.4241 might let the quotations rise to the long-term fractal peak of 1.4376.
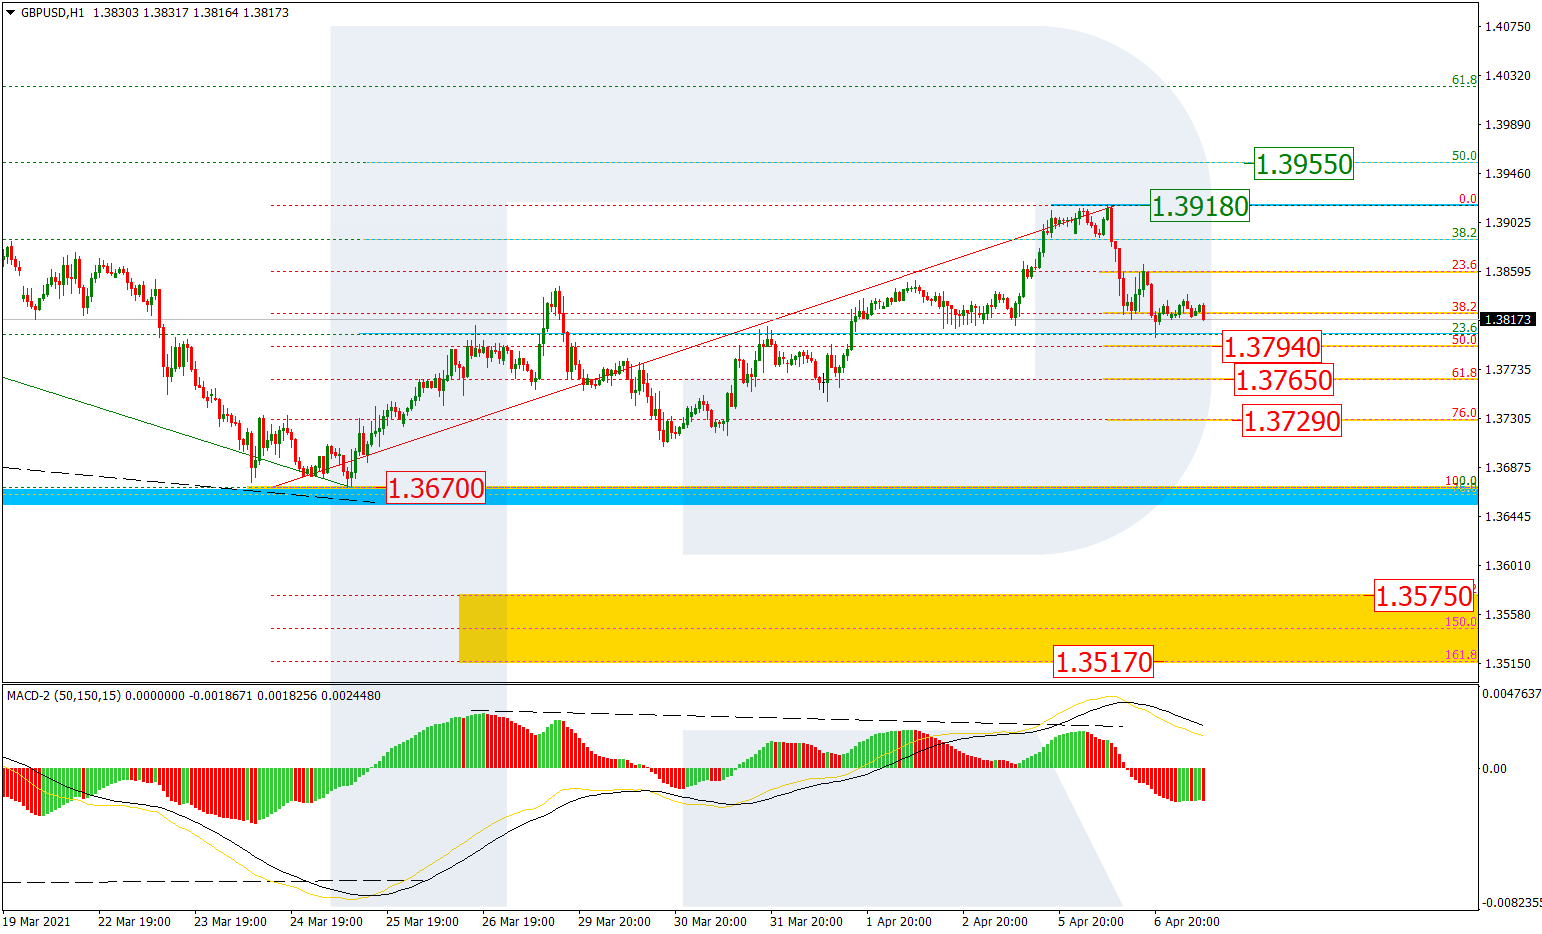
On H1, we can see a correctional wave rise to 38.2% though it failed to reach 50.0% (1.3955) Fibo. After a local divergence the trend reversed. By now, the quotations have reached 38.2% and might head for 50.0% (1.3794), 61.8% (1.3765), and 76.0% (1.3729). After a breakaway of the low of 1.3670 the quotations might head for the post-correctional extension range of 138.2-161.8% (1.3575-1.3517). A breakaway of the local resistance level of 1.3918 might let the quotations attack the medium-tetm resistance level of 1.4001.
EURJPY, “Euro vs. Japanese Yen”
On H4, there is a wave of growth approaching the high of 130.66, threatening to break it away. The breakaway of the high might let the quotations rise to the long-term level of 76.0% (131.95) Fibo. However, as previously, the quotations might bounce off the high which, in turn, will let another wave of decline form. A new wave of decline might head for 38.2% (127.20), 50.0% (126.14), and 61.8% (125.08).
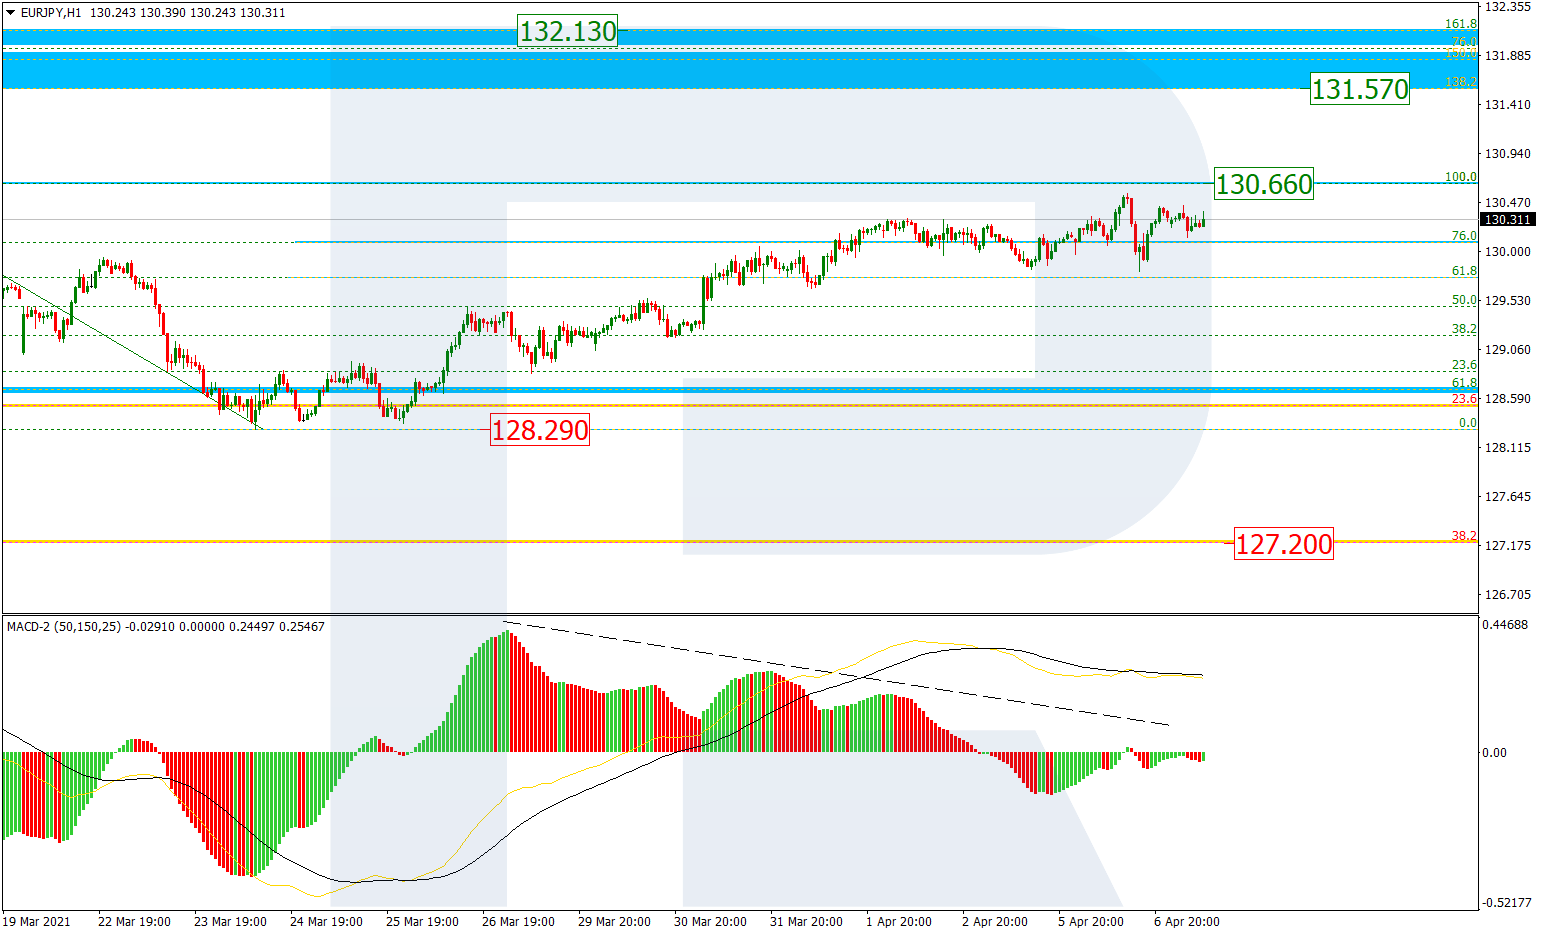
On H1, the uptrend has overcome 76.0% Fibo of the previous declining wave and is now attacking the high. Later the quotations might aim at the post-correctional extension area of 138.2-161.8% (131.57-132.13). The medium-tetm level of 76.0% is also in this area. A divergence on the MACD might mean a possible reversal and a decline to the local low of 128.29.
Attention! Forecasts presented in this section only reflect the author’s private opinion and should not be considered as guidance for trading. RoboForex LP bears no responsibility for trading results based on trading recommendations described in these analytical reviews.
– Elon Musk has democratised the stock market but to seriously grow your wealth you need both Elon’s cool and Warren Buffett’s old-school savvy, warns the CEO of one of the world’s largest independent financial advisory and fintech organisations.
The warning from Nigel Green, the deVere Group CEO and founder, comes as the surge in day-trading frenzies, triggered by so-called ‘activist investors’ on social media platforms and online forums like Reddit urging others to invest their cash into unloved stocks, appears to be fizzling out.
Many of these so-called ‘meme stocks’ jumped exorbitantly on the back of these small-scale investments. However, platforms that facilitated this are reporting a flatlining of the ‘movement.’
Mr Green says: “The first quarter of 2021 was a crazy ride in stock markets, and this was driven by online investment communities who adore the likes of the billionaire electric vehicle and space travel entrepreneur Elon Musk, amongst others.
“He’s successfully pitched himself as being both a future first, counterculture activist and part of the establishment. Small-scale day-traders can’t get enough of it and hang off his every word.
“In many respects, this is a good thing. His immense global influence has brought into focus the huge benefits of investing to millions, many of whom would have ordinarily baulked at the idea of putting their money into the hands of Wall Street traders.
“In this way, Elon has helped democratise the stock market.”
He continues: “I believe whilst the mass hype and hysteria might be fading, this phenomenon of retail investors acting as a collective and led by social media and celebrity investors, is here to stay.
“Moving forward, they are likely to be as influential as major hedge funds in moving markets.”
Mr Green goes on to say: “However, as we’re now seeing, many of these small-scale investors – typically inexperienced, younger people who might not necessarily have the financial resources to be resilient against usually highly speculative and volatile investments – are playing a potentially hugely costly game.
“I would urge them to adopt the cool of Elon Musk and the savvy of Warren Buffett.
“Elon can spot future trends like very few others, focuses on sustainability, has utter conviction, takes risks, and is a master at harnessing the power of social media for business.
“Meanwhile, Warren’s focus is on time-honoured fundamentals including diversification, cash flow and profitability.
“The instincts and skillsets of both these mega investors combined will be a powerful strategy for any investor.”
Last month, the deVere CEO noted: “If you do want the thrill or novelty of chasing big gains, you really should ensure that you have a sound, diversified, long-term plan beforehand.
“There’s a major difference between investing and gambling.”
Nigel Green concludes: “The stock market is becoming ever-more democratised. This is a good thing.
“But the leaders of this new era must exercise responsibility and investors must exercise caution.
“The future of investment is this fine line between forward-thinking drive and old-fashioned principles – and it underscores that nothing can help you create, grow and safeguard your wealth, like quality advice.”
About:
deVere Group is one of the world’s largest independent advisors of specialist global financial solutions to international, local mass affluent, and high-net-worth clients. It has a network of more than 70 offices across the world, over 80,000 clients and $12bn under advisement.
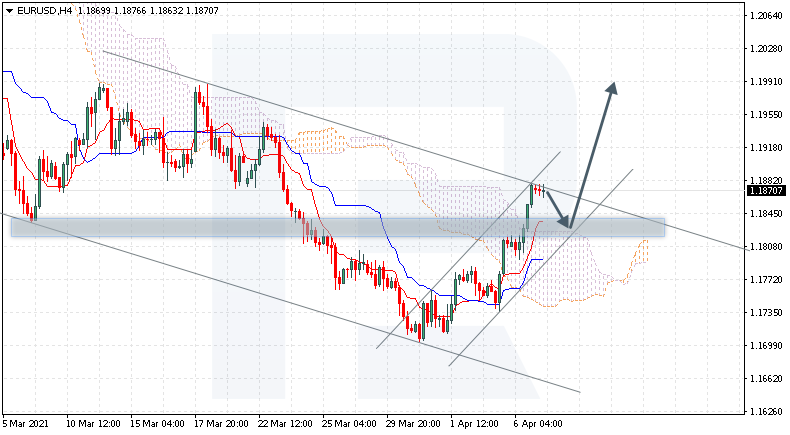
The pair is trading above the Ichimoku Cloud, suggesting an uptrend. A test of the upper border of the Cloud at 1.1825 is expected, followed by growth to 1.1995. The growth will be additionally supported by a bounce off the lower border of the ascending channel. The scenario will no longer be valid if the lower border of the Cloud is broken and the quotations close under 1.1725, which will mean further falling to 1.1635. The growth will be confirmed by a breakaway of the upper border of the bearish channel and securing above 1.1905.
AUDCAD, “Australian Dollar vs Canadian Dollar”
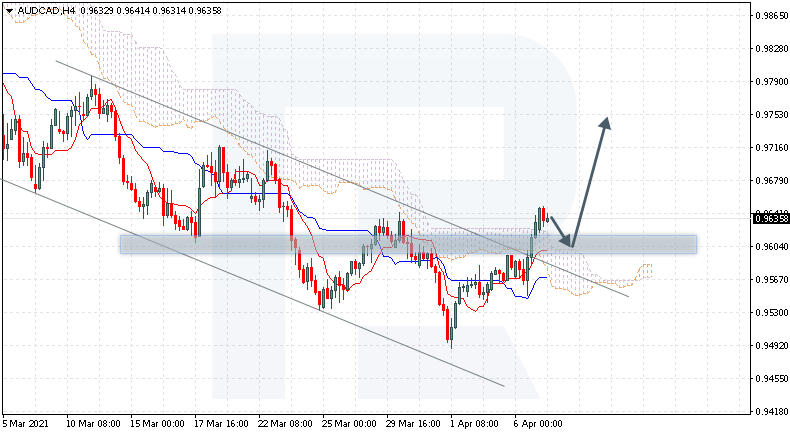
The currency pair is trading at 0.9635 above the Ichimoku Cloud, suggesting an uptrend. A test of the upper border of the Cloud at 0.9605 is expected, followed by growth to 0.9755. The growth will additionally be confirmed by a bounce off the upper border of the descending channel that the buyers have broken away upwards confidently. The scenario can be canceled by a breakaway of the lower border of the Cloud and securing under 0.9515, which will entail further falling to 0.9425.
USDCAD, “US Dollar vs Canadian Dollar”
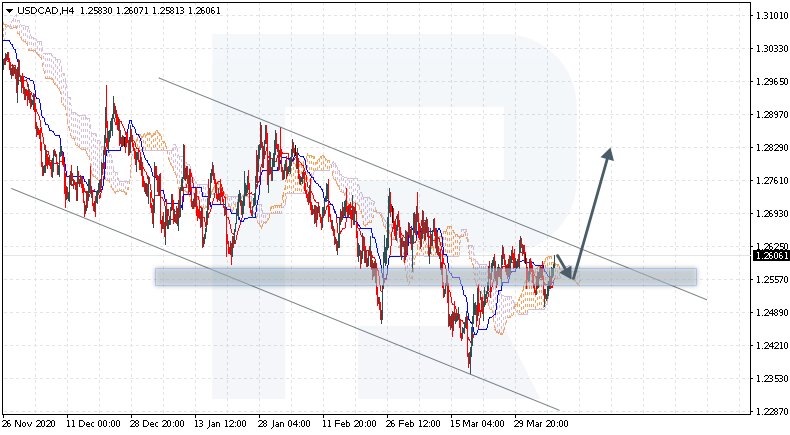
The currency pair is trading above the Ichimoku Cloud, suggesting an uptrend. A test of the upper border of the Cloud at 1.2555 is expected, followed by growth to 1.2835. The growth will be supported by a bounce off the support level. The scenario will be canceled by a breakaway of the lower border of the Cloud and securing under 1.2455, which will mean further falling to 1.2365. The growth will be confirmed by a breakaway of the upper border of the descending channel and securinh above 1.2645.
Attention! Forecasts presented in this section only reflect the author’s private opinion and should not be considered as guidance for trading. RoboForex LP bears no responsibility for trading results based on trading recommendations described in these analytical reviews.
The euro rose sharply against the US dollar amid the publication of the latest research by the Sentix Institute. A sharp rise in investor optimism about the European economy supported the bulls in the pair. The decline in the dollar index provides additional support to the growth of EUR/USD.
Trading recommendations
Support levels: 1.1704, 1.1688
Resistance levels: 1.1889, 1.1990
The main scenario for EUR/USD is buying. The MACD continues to show convergence, which indicates a high likelihood of continued growth in the pair. The ADX shows the development of the trend potential, and the price is fixed above the moving averages. Taken together, all indicators show a steady movement in the north direction.
Alternative scenario: if the price consolidates below the level of 1.1790, the pair may return to the decline to 1.1704.
News feed for 2021.04.07:
– FOMC Meeting Minutes Release at 21:00 (GMT+3).
The GBP/USD currency pair
Technical indicators of the currency pair:
Prev Open: 1.3896
Prev Close: 1.3820
% chg. over the last day: -0.55%
The sterling showed negative dynamics on Tuesday. It was the rare case when the pair moved in the opposite direction relative to the euro. The day closed in the red, completely neutralizing Monday’s growth, amid a statement by Prime Minister Boris Johnson about air travel restrictions.
Trading recommendations
Support levels: 1.3705, 1.3680
Resistance levels: 1.3848, 1.3929
The main scenario for GBP/USD is selling. The ADX doesn’t react to the fall on Tuesday, which casts doubt on a further decline. At the same time, the price has consolidated below the moving averages, and the MACD is below zero. Taken together, the technical indicators show a slow decline.
Alternative scenario: if the pair consolidates above 1.3848, the pound may move upward to 1.3929.
News feed for 2021.04.07:
– The UK Services Purchasing Managers’ Index (Mar) at 11:30 (GMT+3).
The USD/JPY currency pair
Technical indicators of the currency pair:
Prev Open: 110.18
Prev Close: 109.74
% chg. over the last day: -0.40%
The dollar-yen pair continued to decline amid mixed dynamics on stock exchanges and a drop in government bond yields. Considering the latest research by Sentix, the decline may stop soon since there are no fundamental reasons for selling risky assets.
Trading recommendations
Support levels: 109.59, 109.38
Resistance levels: 110.32, 110.98
The main scenario is selling. The price is still fixed below the moving averages, and convergence is visible on the MACD. But the ADX shows falling bearish pressure. It indicates the likely completion of the correction, and the first support level may limit the decline.
An alternative scenario implies the price fixing above 110.32. In this case, the pair may resume growth to 109.98.
News feed for 2021.04.07:
– FOMC Meeting Minutes Release at 21:00 (GMT+3).
The USD/CAD currency pair
Technical indicators of the currency pair:
Prev Open: 1.2522
Prev Close: 1.2563
% chg. over the last day: +0.33%
The pair stopped the decline on Tuesday and showed intraday gains amid declining oil prices. WTI crude oil has consolidated below $60 per barrel and is trading near the lows of early March, putting pressure on the Canadian currency.
Trading recommendations
Support levels: 1.2501, 1.2466
Resistance levels: 1.2629, 1.2646
The main scenario is buying. Specifications have changed significantly since Monday. The price confidently consolidated above the moving averages, while the MACD moved into a positive area, and convergence formed at the same time. The ADX indicates low strength of the trend potential.
Alternative scenario: if the price consolidates below 1.2550, the pair may resume its decline to 1.2501.
News feed for 2021.04.07:
– The Canada Ivey Purchasing Managers Index (PMI) at 17:00 (GMT+3);
This article reflects a personal opinion and should not be interpreted as an investment advice, and/or offer, and/or a persistent request for carrying out financial transactions, and/or a guarantee, and/or a forecast of future events.
On Tuesday, Sentix released unexpectedly positive data on investors’ expectations. Investors’ optimism about the eurozone economic recovery hit a record high in April, amid hopes that faster vaccinations would ease quarantine measures, according to the research. An indicator measuring the current situation surged to the levels that were last recorded before the pandemic – 13.1. “With significant fiscal policy softening and continued monetary support from the European Central Bank, there are significant inflationary risks to enter into the picture in the coming months,” the research company explained.
These figures supported the Common European Currency, which demonstrated the largest intraday gains among the G10 currencies. The stock market has barely reacted to the data as trading volumes have decreased significantly recently. The trading volume of the S&P 500 on US exchanges fell below 10 billion shares for the first time this year, which is roughly the same as trading volume during the pre-holiday market closure. The maximum stock trading volume was about 25 billion shares.
US labor market data showed that the vacancy rate increased to a two-year high in February, boosted by the recovery of business activities in industries that were hardest hit by the pandemic. This fact reinforces the signs of a recovery in the American economy.
There is a correction observed in the credit market after Janet Yellen’s statements about the need to maintain low interest rates in the coming years. The Treasury yield fell just below 1.64%. 2-year bonds fell to 0.15%, which led to the dollar decline.
Additional pressure on bonds yield is exerted by oil quotes. Black gold is gradually declining as investors expect a reduction in consumption due to new restrictions in Europe. WTI crude oil fell below $60 p/b.
This article reflects a personal opinion and should not be interpreted as an investment advice, and/or offer, and/or a persistent request for carrying out financial transactions, and/or a guarantee, and/or a forecast of future events.
While all the plaudits have gone to stock markets Stateside and their new incessant record highs over the last few months, European traders have struggled to join the party with equities this side of the pond lagging their American brothers-in-arms. The US is of course home to the biggest growth companies ever seen, heavily influenced by the tech titans that have benefitted the most from the pandemic.
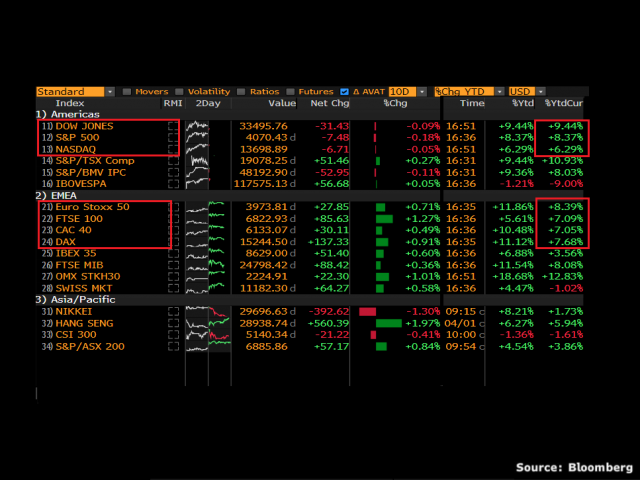
But no longer! The regionwide Stoxx 600 today finally exceeded the prior record high set in February before the dreaded pandemic triggered huge losses. The German Dax bourse also hit a new peak as the higher proportion of cyclical companies in European indices generally, which are more closely aligned with the economic outlook, have come roaring back to the fiesta with banks, travel companies and automakers fuelling performance. Both the US and European benchmarks have gained close to 10% already this year, with the S&P500 hugely outperforming the Euro Stoxx 600 by some 20% last year.
Dax revved up
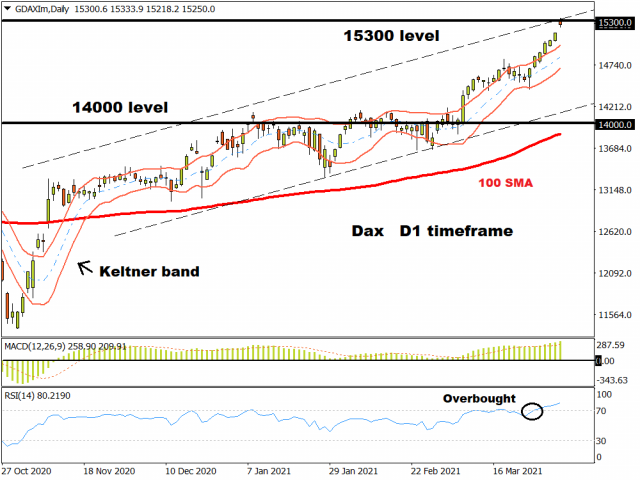
Since breaking decisively above 14,000 at the start of March, the German Dax has been propelled by strong momentum and touched 15,300 earlier today. The German economy is a big beneficiary of the global economic recovery with its major companies at the receiving end of global stimulus due to their focus on exporting.
But the 10% move in just two weeks looks overbought now with the daily RSI indicator close to 80 and trading way above the upper Keltner band.
Aussie holding its ground
The unchanged RBA decision overnight didn’t rock the boat much, with the bank still judging that conditions would likely not be ripe for a rate hike until at least 2024. There was a mildly hawkish tilt for a possible shortening in its yield curve control policy later in the year, but the AUD remained very much non-plussed by the meeting.
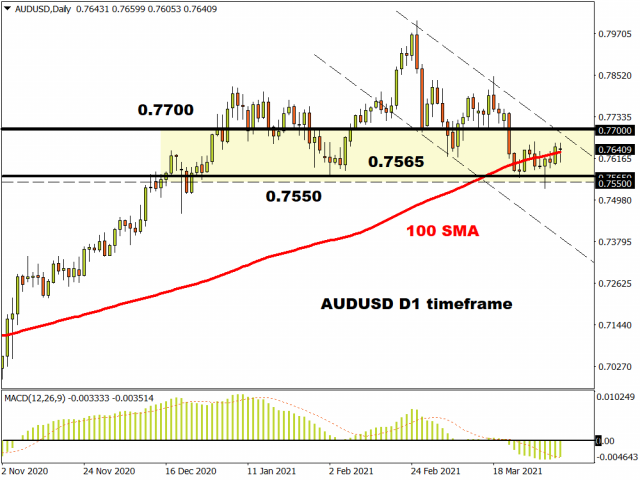
Last week saw AUD/USD rebound from the intraday break of a key low around 0.7565 but prices are still trading around the 100-day moving average in a tight range. The rejection of the new low is encouraging for the bulls at least but they need to push on to 0.77 and beyond or the danger increases of a new risk-off wave with 0.7550 failing to hold out.
Disclaimer: The content in this article comprises personal opinions and should not be construed as containing personal and/or other investment advice and/or an offer of and/or solicitation for any transactions in financial instruments and/or a guarantee and/or prediction of future performance. ForexTime (FXTM), its affiliates, agents, directors, officers or employees do not guarantee the accuracy, validity, timeliness or completeness, of any information or data made available and assume no liability as to any loss arising from any investment based on the same.
Carnival Corporation is set to unveil its latest quarterly earnings on Wednesday, 7 April.
The cruise operator’s financial results for the three months ending 28 February are set to bear the deep scars inflicted by the global pandemic. Yet investors have been willing to pay scant attention to such backward-looking figures. Instead, they have been looking forward to the day when Carnival’s cruise ships will set sail once more, filled with holiday goers who are eager (and also hopefully vaccinated) for a break from the lockdowns around the world.
Such hopes have catapulted the stock higher by almost 260% since 2 April 2020!
Carnival’s stock price still a long way from pre-pandemic levels
Following an 85% plunge between 17 January until 2 April last year, Carnival’s stock ended up sinking below the $8.00 mark to hit its lowest levels since 1993. Despite the stunning recovery in the 12 months since, the stock currently remains about 45% lower from its pre-pandemic high, when it breached the $50 mark in January 2020.
From a technical perspective, Carnival’s stock recently enjoyed support at its 50-day simple moving average. And with its MACD momentum poised to break above its signal line, coupled with the fact that its 14-day relative strength index has yet to reach technically overbought levels, the stock appears on the cusp of exploring more of its upside.
Although there is still a notable distance between its current share price from pre-pandemic levels, such a gap also signals the potential upside for Carnival’s stock, as its business eventually is restored.
How might Carnival’s share price perform today?
Market participants are poised to react to any commentary or details today about when more of Carnival’s cruises can resume. Any developments related to advanced bookings and pricing could reveal a lot about the pent-up demand for the company’s products and offerings.
Markets are pricing in a 5.56% move, either upwards or downwards, when Carnival releases its fiscal Q1 earnings. Note that this stock is now 4% away from this year’s highest closing price, set on 15 March.
Carnival’s share prices registered gains after 4 out of the past 5 quarterly earnings announcements. Despite some negative surprises in the hard numbers, clearly many investors and traders had little qualms getting on board with this stock, pushing it higher by 32% already so far this year.
Still, going into the earnings announcement, at least 5% of Carnival’s shares are being shorted.
What are the market expectations for Carnival’s fiscal Q1 earnings?
Wall Street predicts that Carnival’s latest quarterly revenue would come in at $66.9 million, and an adjusted loss per share of $1.68 for the period.
For Carnival’s bottom line, Wall Street is forecasting a net loss of $1.74 billion in this latest financial quarter, which would mark a fifth consecutive fiscal quarter of net losses for the cruise operator. No surprise also that its top line has been wiped out by Covid-19, dwindling to a mere pittance versus the average $5.1 billion in quarterly revenue it used to rake in since December 2018 until the pandemic struck.
It is also estimated that Carnival had to burn through $600 million per month between December 2020 and February 2021 in trying to keep its business afloat. Carnival’s decision to get rid of 19 ships off its books did help pad up its cash buffers, adding to the billions raised via sales of bonds and common shares.
Is the tide turning?
However, Carnival’s fortunes are set to reverse course in the coming months.
Mid-summer 2021: The Centers for Disease Control and Prevention said yesterday that US cruises may recommence in a few months, as Carnival threatened to relocate its ships away from US ports.
May 2021: Carnival’s Italian outfit, Costa Cruises, will sail guests to various locations around Italy, Greece, and Croatia, with later visits to France and Spain starting mid-June.
July 2021: Carnival’s ultra-luxury cruise line, Seabourn, has been approved by the Government of Greece to relaunch its voyages in the Mediterranean.
As the Covid-19 vaccine continues making its way throughout the globe, allowing for leisurely travel to resume, that should in turn bolster Carnival’s business and stock prospects.
The question now is whether this party is just getting started and the stock can climb much higher, or has this ship already sailed?
Much rests on what Carnival’s management conveys today, and how well they can dispel the lingering uncertainties surrounding its business outlook. Carnival’s commentary today could potentially signal the next wave of either buying or selling of this stock, even as most of its fleet remains docked for now.
Disclaimer: The content in this article comprises personal opinions and should not be construed as containing personal and/or other investment advice and/or an offer of and/or solicitation for any transactions in financial instruments and/or a guarantee and/or prediction of future performance. ForexTime (FXTM), its affiliates, agents, directors, officers or employees do not guarantee the accuracy, validity, timeliness or completeness, of any information or data made available and assume no liability as to any loss arising from any investment based on the same.
Since the start of the week, it has depreciated against most G10 currencies excluding the Canadian Dollar and British Pound.
Weakening US Treasury yields weighed on the greenback while rallying equity markets hit demand for the safe-haven currency.
Given how the Dollar Index (DXY) is trading below the 92.50 level this morning, could this signal further downside over the next few days?
Fundamentals: Fed meeting minutes
Much attention will be directed towards the minutes of the last FOMC meeting which will be released at 18:00 GMT Wednesday. Investors will closely scrutinize the minutes for fresh clues about what policymakers were thinking about inflation and the timeline for interest rate increases. Given how Federal Reserve policymakers were optimistic about the U.S. economic outlook during the March meeting, the minutes are likely to echo a similar tone. However, doves are expected to remain in the vicinity – especially after a majority of policymakers indicated that interest rates will not be raised until 2024.
Back to the technicals…
The mighty dollar is not looking so mighty on the daily charts. Yesterday’s close below the 92.50 level may encourage a decline towards 91.70 and 91.35, respectively. Despite the recent losses, bulls still have a chance to fight back. The MACD is trading above 0 while prices are marginally above the 20 Simple Moving Average. A solid push back above 92.50 may open the doors towards 93.00 and 93.47.
Weekly chart signals weakness
Things started going downhill for the DXY after prices failed to break above the 93.47 level last week. Although the candlesticks are currently in a weekly bullish trend, the MACD remains below 0. If the downside momentum results in a breach below the 91.50 support, this could signal further a selloff towards 89.00. For bulls to jump back into the game on the weekly charts, a solid weekly close above 94.75 needs to be achieved.
Same story on the monthly
The trend remains bearish on the monthly charts. There have been consistently lower lows and lower highs while the MACD trades below 0. A solid monthly close below 92.00 may invite a decline towards 90.60, 89.20 and 88.00, respectively. If 92.00 proves to be reliable resistance on the monthly timeframe, a rebound towards 94.00 and 94.80 could be on the cards.
Disclaimer: The content in this article comprises personal opinions and should not be construed as containing personal and/or other investment advice and/or an offer of and/or solicitation for any transactions in financial instruments and/or a guarantee and/or prediction of future performance. ForexTime (FXTM), its affiliates, agents, directors, officers or employees do not guarantee the accuracy, validity, timeliness or completeness, of any information or data made available and assume no liability as to any loss arising from any investment based on the same.
In the first week back since the extended Easter stock market holiday, investors have had their eyes fixed on Facebook. The stock surged to a new record high yesterday, breaking through the previous record high of ~$304.67 on 24 August 2020.
However, it wasn’t just Facebook that surged to record highs. Alphabet and Microsoft did too. This highlights that investors are now willing to rotate from cyclical stocks back into technology stocks which have been underperforming over the past few weeks.
Source: Admirals MetaTrader 5, #FB, Weekly – Data range: from Mar 2, 2014, to Apr 6, 2021, performed on Apr 6, 2021, at 8:30 pm GMT. Please note: Past performance is not a reliable indicator of future results.
In the long-term, weekly price chart of Facebook’s share price shown above, the overall uptrend is evident with several significant declines most notably in 2018 and 2020. Even after these falls, the price has rallied back up to a new record high, underlying the strength in the stock price.
For the past several months, Facebook’s share price – along with other Big Tech names – has been trading inside of a range, as shown from the black horizontal support line and descending resistance line in the daily price chart below.
Source: Admirals MetaTrader 5, #FB, Daily – Data range: from Oct 16, 2019, to Apr 6, 2021, performed on Apr 6, 2021, at 8:30 pm GMT. Please note: Past performance is not a reliable indicator of future results.
Now that price has broken through its most recent trading range and recorded a new all-time high, it may attract the interest of technical momentum traders who will be looking for signs of a trend continuation. It could be a very interesting second quarter for Facebook!
Did you know that you can use the Trading Central Technical Ideas Lookup indicator to find actionable trading ideas on thousands of other instruments across Forex, stocks, indices, commodities and more?
You can get this indicator completely FREE by upgrading your MetaTrader 5 trading platform provided by Admirals (formerly Admiral Markets) to the exclusive Supreme Edition! You’ll also receive a whole range of advanced trading tools such as correlation and sentiment indicators!
Start your free download by clicking on the banner below:
INFORMATION ABOUT ANALYTICAL MATERIALS:
The given data provides additional information regarding all analysis, estimates, prognosis, forecasts, market reviews, weekly outlooks or other similar assessments or information (hereinafter “Analysis”) published on the websites of Admiral Markets investment firms operating under the Admiral Markets trademark (hereinafter “Admiral Markets”) Before making any investment decisions please pay close attention to the following:
This is a marketing communication. The content is published for informative purposes only and is in no way to be construed as investment advice or recommendation. It has not been prepared in accordance with legal requirements designed to promote the independence of investment research, and that it is not subject to any prohibition on dealing ahead of the dissemination of investment research.
Any investment decision is made by each client alone whereas Admiral Markets shall not be responsible for any loss or damage arising from any such decision, whether or not based on the content.
With view to protecting the interests of our clients and the objectivity of the Analysis, Admiral Markets has established relevant internal procedures for prevention and management of conflicts of interest.
The Analysis is prepared by an independent analyst, Jitan Solanki (analyst), (hereinafter “Author”) based on their personal estimations.
Whilst every reasonable effort is taken to ensure that all sources of the content are reliable and that all information is presented, as much as possible, in an understandable, timely, precise and complete manner, Admiral Markets does not guarantee the accuracy or completeness of any information contained within the Analysis.
Any kind of past or modeled performance of financial instruments indicated within the content should not be construed as an express or implied promise, guarantee or implication by Admiral Markets for any future performance. The value of the financial instrument may both increase and decrease and the preservation of the asset value is not guaranteed.
Leveraged products (including contracts for difference) are speculative in nature and may result in losses or profit. Before you start trading, please ensure that you fully understand the risks involved.
– In this second part of our exploration of the recent US Dollar rally and what it may be reacting to in relation to the current US stock market highs and continued rally, we will explore some of the underlying factors that are translating into US Dollar strength while the US stock market continues to push higher.
In the first part of this research article, we highlighted the US Dollar reaction to the 2008-09 credit market crisis and how the US Dollar actually started to bottom/rally in early 2008 – just as the rollover top in the US stock markets continued to setup. The way the US Dollar reacts to stress factors in the global markets is to strengthen as a safe haven as capital is constantly seeking the best environment for investment and profits. When the markets enter a period of turmoil, the US Dollar typically begins to strengthen before the global markets really begin to react to the fear or turmoil.
The recent news of large financial institutions and hedge funds taking large losses and closing operations is somewhat similar to the Lehman event of 2008. These types of larger corporate debt collapses have wide-range global market effects. Sometimes, these events can ripple into other global corporations who engaged in this level of financing or credit functions. For example, Credit Suisse’s attempt to recoup potential losses from the Greensill collapse may be a very complicated and fruitless process according to a recent Wall Street Journal article.
Weekly US Dollar Shows Uptrend Starting
The current US Dollar Weekly chart, below, shows how the US Dollar has strengthened over the past 3 months and how this current uptrend aligns with the $89 lows from early 2018. One of the most interesting aspects of this chart is the peak in early 2020, as the COVID-19 virus market collapse bottomed, which was followed by an extended decline. As mentioned earlier, the US Dollar acts as a safe haven during times of uncertainty and chaos. Obviously, the initial COVID-19 market selloff prompted quite a bit of uncertainty and chaos, prompting the US Dollar to rise nearly 9% in just two weeks. Does the current upside trending in the US Dollar translate into more uncertainty and chaos in the markets?
The recent bottom on this Weekly US Dollar chart happened on January 6, 2021. This was the day that Congress certified the US state electors. It was also the day that chaos took place in Washington DC. From that point onward, the US Dollar began a decidedly upward price trend. Since that low on January 6, the US Dollar has risen over 4.60%. Over that same time, the SPY has rallied more than 7.5%, which obviously fails to show any US or global market concerns.
Weekly Smart Cash vs. US Dollar Correlations
The following chart shows the US Dollar (as a GOLD line) and our Custom Smart Cash Index (as a BLUE line) and highlights the threshold of the US Dollar that usually prompts a breakdown in price in the stock market. The ORANGE threshold level on this chart for the US Dollar is 94.10 and the PURPLE threshold level on this chart 99.50. Once the US Dollar reaches levels above the ORANGE threshold, the SPY becomes much more volatile and tends to retrace lower over time. Once the US Dollar reaches above the PURPLE threshold, it appears the US Dollar reaches major resistance, stalls, and contracts, which prompts a fairly large upside price trend in the SPY.
Currently, the US Dollar Index is trading just above 93.00 and it just 1.1 away from the ORANGE threshold. Should the US Dollar continue to rally over the next few weeks and months, our research suggests the US stock market will enter a period of increased volatility with broad sector trending/rotation. As you can see on this chart, near the end of 2018, the US Dollar Index rallied above the ORANGE threshold while the Custom Smart Cash Index entered a period of extended price volatility (2019 through the COVID-19 bottom in 2020). Once the US Dollar Index fell back below the ORANGE threshold (July/August 2020), the Custom Smart Cash Index began to rally estensively.
The current rally in the US stock market will likely continue until the US Dollar Index moves comfortably over the ORANGE threshold, there is a strong possibility the US stock market will enter a period of extended volatility and trending. That means that the current bullish price trend may enter a broader rally phase – targeting a new excess phase peak. Or, it may shift into more of a sideways price trend with a broad range of price rotation – like what happen in 2015 to 2016.
Interestingly enough, near the end of 2016, as the US stock market bottomed and began to rally, the sectors that lead that rally included precious metals, miners, utilities, regional banking, and technology (later in 2017). This suggests we need to watch metals & miners as well as utilities and regional banking sectors later in 2021.
Currently, the leading sector trends are Real Estate, REITS, US Financials, Global Infrastructure, Global Natural Resources, Technology, Consumer Services, and Aerospace & Defense. These leading sectors suggest many traders/investors believe the next few years will be filled with various advantages in technology, raw materials, consumer activities and infrastructure/defense spending. Get ready for some really big trends in various sectors and be prepared to jump into some of these bigger trends.
Don’t miss the opportunities to profit from the broad market sector rotations we expect this year, which will be an incredible year for traders of my Best Asset Now (BAN) strategy. You can sign up now for my FREE webinar that teaches you how to find, enter, and profit from only those sectors that have the most strength and momentum. Staying ahead of sector trends is going to be key to success in volatile markets.
For those who believe in the power of trading sectors that show relative strength and momentum but don’t have the time to do the research every day, let my BAN Trader Pro newsletter service do all the work for you with daily market reports, research, and trade alerts. More frequent or experienced traders have been killing it trading options, ETFs, and stocks using my BAN Hotlist ranking the hottest ETFs, which is updated daily for my BAN Trader Pro subscribers.










 Article by