Risk mood heats up

By Lukman Otunuga Research Analyst, ForexTime

The broadest gauge of world stocks covering 50 markets, the ACWI is little changed today after hitting historic highs yesterday and extending its gains this month to 5.1%. US stock markets also made fresh record peaks, with the S&P500 closing strongly while the tech-heavy Nasdaq Composite touched an intraday high before paring some gains. We should also give a special mention to commodities which have been on a tear recently, with Copper hitting multi-year highs yesterday.

With US GDP already back to where it started pre-Covid, the Fed still on full easing mode and with yet more stimulus to come, it’s no wonder risky assets are surging ever higher.

Europe looking to brighter times

There is even growing confidence in the Eurozone recovery, although the Q1 GDP data out today will most likely show a technical recession. Confidence figures this week from across the continent went through the roof and it’s significant that the previously hurting services sector is now also in expansion. With the vaccine rollout cranking up and the EU Recovery Fund getting approval from the German courts, the euro is enjoying its fourth week of gains versus the mighty dollar.

EUR/USD has had a relatively smooth journey higher, after touching 1.17 at the end of last month and is on track for its biggest monthly gains in nine months.

May is typically a decent month for the greenback seasonally so a pause is quite possible. But the uptrend is strong and we could see more upside surprises in economic data out of the region in the coming weeks.

Oil closing in on highs

Amongst the rip-roaring agricultural commodities and Copper hitting the magical $10,000 mark, oil has quietly been making headway as well. The weekly EIA report showed some continued positive signals regarding US demand, and while there are still concerns over the surge in Covid-19 cases in India, Europe at least seems to be heading in the right direction with summer travel now firmly on the cards too.

Since getting close to $60 towards the end of March, prices tracked sideways before rising steadily in the second week of this month.

The 50-day SMA has acted a solid support and the bulls took out this month’s high yesterday as momentum looks good for an attempt at the March highs above $71.

Disclaimer: The content in this article comprises personal opinions and should not be construed as containing personal and/or other investment advice and/or an offer of and/or solicitation for any transactions in financial instruments and/or a guarantee and/or prediction of future performance. ForexTime (FXTM), its affiliates, agents, directors, officers or employees do not guarantee the accuracy, validity, timeliness or completeness, of any information or data made available and assume no liability as to any loss arising from any investment based on the same.


Forex-Time-LogoArticle by ForexTime

ForexTime Ltd (FXTM) is an award winning international online forex broker regulated by CySEC 185/12 www.forextime.com

Technical Outlook: DXY Bounces Off 2-Month Lows

By Lukman Otunuga Research Analyst, ForexTime

After being bruised and beaten by a dovish Federal Reserve on Wednesday evening, the Dollar used today’s trading session to nurse its wounds.

The Greenback appreciated against most G10 currencies on Thursday as Treasury yields edged higher. Buying sentiment towards the currency was slightly stimulated by the strong first-quarter U.S. GDP data that signalled a rapidly improving economy.

U.S. economic growth expanded at a 6.4% annualised rate in the first quarter of 2021 thanks to rising vaccinations, government aid, and strong consumer spending. The impressive GDP figure reconfirms that the U.S. economic recovery is gathering speed. It does not end here. The number of American’s filing new unemployment claims fell to 553,000 last week. This was the lowest level since the first wave of the pandemic a year ago and the third straight week of jobless claims below 600,000. Although the Federal Reserve remains ruled by monetary doves, the question is for how long? As economic data continues to improve, the labour force moves in the right direction and inflation accelerates, hawks may reawaken from slumber.

Back to the technicals…

The Dollar Index (DXY) has found minor support around the 90.50 level. Although this could offer bulls a chance to strike back, prices are still trading below the 100-day Simple Moving Average while the MACD remains below 0. If bulls are unable to exploit this opportunity to push prices back above 91.05, this could result in a decline back towards 90.50 and 90.00.

Alternatively, a solid break above 91.05 may open the doors towards 91.31 and 91.80, respectively.

Weekly chart remains bearish

Dollar bears remain in the driving seat on the weekly timeframe. Prices are trading below the 20-week and 50-week Simple Moving Average. Sustained weakness below 91.50 may trigger a decline towards 90.00 and 89.00, respectively.

Keep a close eye on monthly candle close

April’s monthly candle could produce a bearish engulfing pattern which may signal the continuation of the current monthly downtrend. Bears need a solid monthly close below 90.50 to drive prices lower with the first level of interest at 89.17.

Disclaimer: The content in this article comprises personal opinions and should not be construed as containing personal and/or other investment advice and/or an offer of and/or solicitation for any transactions in financial instruments and/or a guarantee and/or prediction of future performance. ForexTime (FXTM), its affiliates, agents, directors, officers or employees do not guarantee the accuracy, validity, timeliness or completeness, of any information or data made available and assume no liability as to any loss arising from any investment based on the same.


Forex-Time-LogoArticle by ForexTime

ForexTime Ltd (FXTM) is an award winning international online forex broker regulated by CySEC 185/12 www.forextime.com

Amazon stock surges on huge earnings beat! What’s next?

By Admiral Markets 

– Amazon shares surged higher in premarket trading to new a record high on an earnings report that smashed Wall Street’s expectations. The stock was instantly up 3.5% on the announcement after the closing bell yesterday.

The e-commerce giant posted earnings of $15.79 per share against $9.54 per share expected. Revenue came in at $108.52 billion versus an expected $104.47 billion.

Sales were up more than 44% year on year, largely helped by the surge in demand of online shopping over the pandemic.

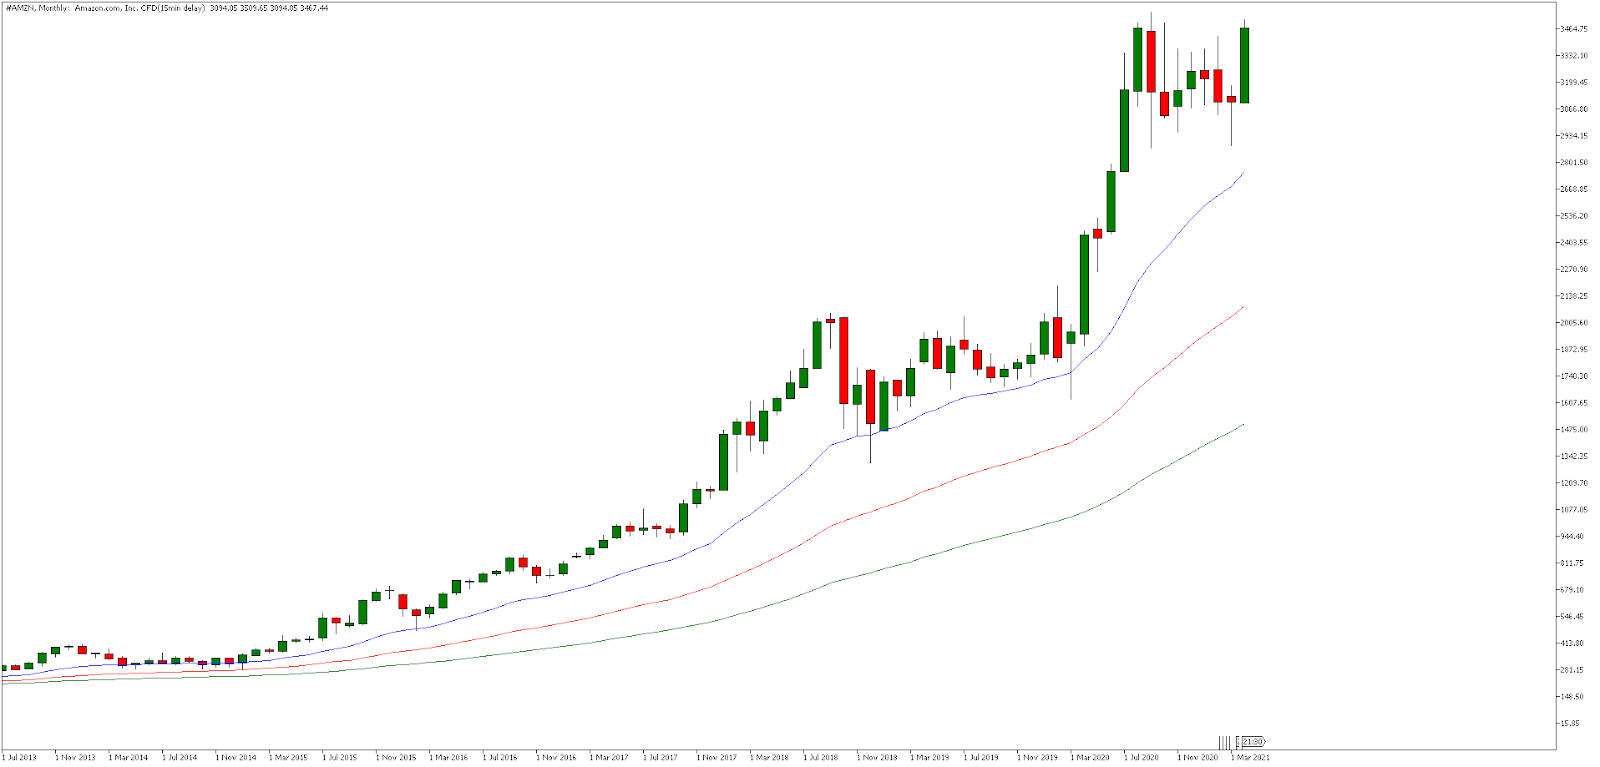
Source: Admirals MetaTrader 5, AMZN, Monthly – Data range: from Jul 1, 2013, to Apr 29, 2021, performed on Apr 29, 2021, at 8:30 pm GMT. Please note: Past performance is not a reliable indicator of future results. 

While Amazon’s share price has been rising in the long term, it has spent much of the past six months in a trading range. However, the price has now broken to new all-time high levels, suggesting a breakout of the range.

If the buyers can hold above the recent range it could be a platform for more buyers to step in. Watching price action and cycle formations will be key for confirmation of this.

Did you know that you can use the Trading Central Technical Ideas Lookup indicator to find actionable trading ideas on Amazon’s share price and thousands of other instruments across Forex, stocks, indices, commodities and more?

You can get this indicator completely FREE by upgrading your MetaTrader 5 trading platform provided by Admirals (formerly Admiral Markets) to the exclusive Supreme Edition!

Start your free download by clicking on the banner below:

Download MetaTrader 5 Supreme Edition

INFORMATION ABOUT ANALYTICAL MATERIALS:

The given data provides additional information regarding all analysis, estimates, prognosis, forecasts, market reviews, weekly outlooks or other similar assessments or information (hereinafter “Analysis”) published on the websites of Admiral Markets investment firms operating under the Admiral Markets trademark (hereinafter “Admiral Markets”) Before making any investment decisions please pay close attention to the following:

  1. This is a marketing communication. The content is published for informative purposes only and is in no way to be construed as investment advice or recommendation. It has not been prepared in accordance with legal requirements designed to promote the independence of investment research, and that it is not subject to any prohibition on dealing ahead of the dissemination of investment research.
  2. Any investment decision is made by each client alone whereas Admiral Markets shall not be responsible for any loss or damage arising from any such decision, whether or not based on the content.
  3. With view to protecting the interests of our clients and the objectivity of the Analysis, Admiral Markets has established relevant internal procedures for prevention and management of conflicts of interest.
  4. The Analysis is prepared by an independent analyst, Jitan Solanki (analyst), (hereinafter “Author”) based on their personal estimations.
  5. Whilst every reasonable effort is taken to ensure that all sources of the content are reliable and that all information is presented, as much as possible, in an understandable, timely, precise and complete manner, Admiral Markets does not guarantee the accuracy or completeness of any information contained within the Analysis.
  6. Any kind of past or modeled performance of financial instruments indicated within the content should not be construed as an express or implied promise, guarantee or implication by Admiral Markets for any future performance. The value of the financial instrument may both increase and decrease and the preservation of the asset value is not guaranteed.
  7. Leveraged products (including contracts for difference) are speculative in nature and may result in losses or profit. Before you start trading, please ensure that you fully understand the risks involved.

By Admiral Markets

Space tourism – 20 years in the making – is finally ready for launch

By Wendy Whitman Cobb, US Air Force School of Advanced Air and Space Studies 

– For most people, getting to the stars is nothing more than a dream. On April 28, 2001, Dennis Tito achieved that lifelong goal – but he wasn’t a typical astronaut. Tito, a wealthy businessman, paid US$20 million for a seat on a Russian Soyuz spacecraft to be the first tourist to visit the International Space Station. Only seven people have followed suit in the 20 years since, but that number is poised to double in the next 12 months alone.

NASA has long been hesitant to play host to space tourists, so Russia – looking for sources of money post-Cold War in the 1990s and 2000s – has been the only option available for those looking for this kind of extreme adventure. However, it seems the rise of private space companies is going to make it easier for regular people to experience space.

From my perspective as a space policy analyst, I see the beginning of an era in which more people can experience space. With companies like SpaceX and Blue Origin hoping to build a future for humanity in space, space tourism is a way to demonstrate both the safety and reliability of space travel to the general public.

Three men floating in the International Space Station
Dennis Tito, on the left beside two Russian astronauts, was the first private citizen to ever go to space – and he spent more than a week on the International Space Station.
NASA/WikimediaCommons

The development of space tourism

Flights to space like Dennis Tito’s are expensive for a reason. A rocket must burn a lot of costly fuel to travel high and fast enough to enter Earth’s orbit.

Another cheaper possibility is a suborbital launch, with the rocket going high enough to reach the edge of space and coming right back down. While passengers on a suborbital trip experience weightlessness and incredible views, these launches are more accessible.

The difficulty and expense of either option has meant that, traditionally, only nation-states have been able to explore space. This began to change in the 1990s as a series of entrepreneurs entered the space arena. Three companies led by billionaire CEOs have emerged as the major players: Virgin Galactic, Blue Origin and SpaceX. Though none have taken paying, private customers to space, all anticipate doing so in the very near future.

British billionaire Richard Branson has built his brand on not just business but also his love of adventure. In pursuing space tourism, Branson has brought both of those to bear. He established Virgin Galactic after buying SpaceShipOne – a company that won the Ansari X-Prize by building the first reusable spaceship. Since then, Virgin Galactic has sought to design, build and fly a larger SpaceShipTwo that can carry up to six passengers in a suborbital flight.

The going has been harder than anticipated. While Branson predicted opening the business to tourists in 2009, Virgin Galactic has encountered some significant hurdles – including the death of a pilot in a crash in 2014. After the crash, engineers found significant problems with the design of the vehicle, which required modifications.

Elon Musk and Jeff Bezos, respective leaders of SpaceX and Blue Origin, began their own ventures in the early 2000s.

Musk, fearing that a catastrophe of some sort could leave Earth uninhabitable, was frustrated at the lack of progress in making humanity a multiplanetary species. He founded SpaceX in 2002 with the goal of first developing reusable launch technology to decrease the cost of getting to space. Since then, SpaceX has found success with its Falcon 9 rocket and Dragon spacecraft. SpaceX’s ultimate goal is human settlement of Mars – sending paying customers to space is an intermediate step. Musk says he hopes to show that space travel can be done easily and that tourism might provide a revenue stream to support development of the larger, Mars-focused Starship system.

Bezos, inspired by the vision of physicist Gerard O’Neill, wants to expand humanity and industry not to Mars, but to space itself. Blue Origin, established in 2004, has proceeded slowly and quietly in also developing reusable rockets. Its New Shepard rocket, first successfully flown in 2015, will eventually offer tourists a suborbital trip to the edge of space, similar to Virgin Galactic’s. For Bezos, these launches represent an effort at making space travel routine, reliable and accessible to people as a first step to enabling further space exploration.

A large silvery rocket standing upright on a launchpad.
SpaceX has already started selling tickets to the public and has future plans to use its Starship rocket, a prototype of which is seen here, to send people to Mars.
Jared Krahn/WikimediaCommons, CC BY-SA

Outlook for the future

Now, SpaceX is the only option for someone looking to go into space and orbit the Earth. It currently has two tourist launches planned. The first is scheduled for as early as September 2021, funded by billionaire businessman Jared Isaacman. The other trip, planned for 2022, is being organized by Axiom Space. These trips will be costly, at $55 million for the flight and a stay on the International Space Station. The high cost has led some to warn that space tourism – and private access to space more broadly – might reinforce inequality between rich and poor.

Blue Origin’s and Virgin Galactic’s suborbital trips are far more reasonable in cost, with both priced between $200,000 and $250,000. Blue Origin appears to be the nearest to allowing paying customers on board, saying after a recent launch that crewed missions would be happening “soon.” Virgin Galactic continues to test SpaceShipTwo, but no specific timetable has been announced for tourist flights.

Though these prices are high, it is worth considering that Dennis Tito’s $20 million ticket in 2001 could pay for 100 flights on Blue Origin soon. The experience of viewing the Earth from space, though, may prove to be priceless for a whole new generation of space explorers.

About the Author:

Wendy Whitman Cobb, Professor of Strategy and Security Studies, US Air Force School of Advanced Air and Space Studies

This article is republished from The Conversation under a Creative Commons license. Read the original article.


Netflix’s big bet on foreign content and international viewers could upend the global mediascape – and change how people see the world

By Paolo Sigismondi, USC Annenberg School for Communication and Journalism 

– As a kid growing up in Italy, I remember watching the American TV series “Happy Days,” which chronicled the 1950s-era Midwestern adventures of the Fonz, Richie Cunningham and other local teenagers.

The show, combined with other American entertainment widely available in Italy in the 1970s and 1980s, shaped my perception of the United States long before I ever set foot in the country. Today, I call the U.S. home, and I have developed my own understanding of its complexities. I am able to see “Happy Days” as a nostalgic revival of an ideal, conflict-free American small town.

“Happy Days” was a product of Hollywood, which is arguably still the epicenter of the global entertainment industry. So recent news that the streaming service Netflix is opening an Italian office and will begin massively funding original local content with the intent of distributing it globally on its platform – following a strategy already launched in other European countries – struck me.

This could be a potentially game-changing move in global entertainment. And it might even change how the world perceives, well, the world.

Learning by watching

I have explored the global media landscape from the privileged vantage point of Los Angeles for the past 15 years.

TV and movies are one way that people, as we go through life, make sense of the world, building on the archive of our personal experiences and opinions of other places.

Absent direct experience with a people or nation, we speculate on what we do not know. This process involves a variety of sources, including reading, Googling and accounts from somebody we trust. But often it is media that exposes people to other cultures, above and beyond our own.

TV and movies fill the knowledge gaps with powerful images and stories that inform the way we think about different cultures. If the media’s messages have consistency over time, we may come to understand these as facts.

But media portrayals may well be inaccurate. Certainly, they are incomplete. That’s because movies and TV series aren’t necessarily meant to depict reality; they are designed for entertainment.

As a result, they can be misleading, if not biased, based on and perpetuating stereotypes.

For example, there is no shortage of Italian and Italian American stereotypes in American entertainment. From the award-winning “Godfather” saga to the less critically acclaimed “Jersey Shore” TV series, Italians are often depicted as tasteless, uneducated, linked to organized crime – or all three.

Media is a window to the world

But the way people are exposed to media entertainment is changing. Today streaming platforms like Netflix, Amazon Prime, Apple TV+ and Disney+ collectively have 1 billion subscribers globally.

Being a relative newcomer in producing original content, Netflix cannot rely on a large library of proprietary content to feed its 204 million paid members in over 190 countries, as legacy Hollywood players can. So it is increasingly creating original productions, including a number of non-English language originals from places such as Mexico, France, Italy, Japan and Brazil.

We might call this an example of “glocalization of entertainment” – a company operating globally, adapting its content to meet the expectations of locally situated audiences across the world.

This is already the modus operandi, for example, of many popular reality TV shows. “American Idol” is an American adaptation of Europe’s “Pop Idol.” “The X Factor,” “Big Brother” and “Dancing with the Stars” have similarly international origins.

Now, however, glocalization comes with a twist: Netflix intends to distribute its localized content internationally, beyond the local markets.

It is not the global reach of Netflix’s platform per se that would break down old stereotypes. French critics panned the American-produced, internationally distributed Netlix series “Emily in Paris” for its cliched, romanticized portrayal of the city.

‘Emily in Paris’ was an American take on Paris, and French critics hated it.

Foreign TV executives must create shows for Netflix that both appeal to local audiences and have international potential, while remaining authentic in their portrayal of their country. If Netflix’s Italian team thinks “The Godfather” is what international audiences expect from Italy, international audiences may tune in – but Italians won’t.

To become truly international, Netflix would also have to foster the development of original local ideas not only in European countries with well-developed cultural industries but also in smaller countries and those with emerging entertainment industries, such as African nations.

Netflix’s opportunity – and challenge

A side effect of this strategy could be that Netflix upends the traditional way that media informs our understanding of foreign people and lands by more accurately representing these places.

But that’s a tall order, and it’s not, of course, guaranteed.

Netflix’s transformative potential comes from allowing local creatives to tell stories about their own cultures and then distributing them truly internationally. It will depend on the company’s willingness to implement this strategy in a consistent, sustained, inclusive and thoughtful fashion.

Over time, widespread exposure to a diverse array of international media content might change the way people in the U.S. and worldwide think and feel about other cultures they have never, and may never, come into direct contact with.

All it takes is one click – one choice to watch, perhaps even unknowingly, a foreign-produced series.

The way Netflix works, using algorithms to suggest content as viewers make selections, can prolong an initial exposure to and interest in foreign content. Artificial intelligence meant to feed us more of what we like may end up a surprising force for change, making us rethink what we thought we knew.The Conversation

About the Author:

Paolo Sigismondi, Clinical Professor of Communication, USC Annenberg School for Communication and Journalism

This article is republished from The Conversation under a Creative Commons license. Read the original article.

Are NFTs the next big investment trend or a flash in the pan?

By George Prior

– Traditionalist investors who dismiss NFTs – the new digital asset class taking the art, fashion, music and sports world by storm – are “fooling themselves if they believe they are a passing fad.”

This is the bold – and some might say controversial – observation from Nigel Green, the CEO and founder of deVere Group, one of the world’s largest independent financial advisory and fintech organisations.

NFTs are one-off digital assets that are verified through blockchain technology, giving buyers certificates of authenticity and ownership. They produce unique, non-interchangeable digital tokens, and can be bought and sold like any other assets but they do not have a physical form.

Mr Green’s comments come as a growing number of globally established brands are becoming increasingly involved in the NFT market including the National Basketball Association (NBA) and Sotheby’s.

The latter, the traditional auction house, held a three-day auction of NFTs by an anonymous artist two weeks ago. Meanwhile, Christie’s last month sold “Everydays – The First 5000 Days,” a digital artwork in JPEG form by an artist known as Beeple, for $69.3 million – which is the third most expensive artwork ever sold by a living artist.

The deVere CEO says: “The virtual hype about NFTs is very real and traditionalist investors who dismiss them as a passing fad are fooling themselves.

“They may be a novelty at the moment, but it makes sense that with the blistering pace of the digitalisation of our world, digital assets will become increasingly valuable.

“Demographics are on the side of NFTs too. Millennials, and Gen Z especially, have digital lives and it’s natural to want to take digital representations of luxury brands, music and art into these worlds – and now they can.”

Mr Green also points to the Great Wealth Transfer. “According to some estimates, $68 trillion in wealth is to be passed down from the baby boomers – the wealthiest generation ever – to their children and other heirs over the next couple of decades,” he notes.

Another key reason why NFTs are here to stay is that they are “positively changing business models,” especially in the creative industries.

“Artists and musicians for example can provide enhanced virtual experiences for collectors and buyers, they can prove if their works are counterfeited, and they can include criteria to get royalties every time their works are re-sold in the future.”

The messaging also comes with a warning.

Mr Green says: “NFTs are the hottest new digital asset – but investors need to exercise extreme caution. This market is very young.

“That said, those who dismiss NFTs outright would probably have been the people who previously dismissed online retailers such as Amazon and digital currencies such as Bitcoin.”

About:

deVere Group is one of the world’s largest independent advisors of specialist global financial solutions to international, local mass affluent, and high-net-worth clients. 

What’s a capital gain and how is it taxed?

By Stephanie Leiser, University of Michigan 

– President Joe Biden proposed doubling the tax wealthy people pay on their capital gains.

Under the plan, which he presented during an April 28, 2021, speech to Congress, the tax rate on profits from the sale of an asset such as property or a stock would go from 20% to 39.6% for income over US$1 million a year.

He also said he wamts to end a loophole that allows people to avoid paying the capital gains tax on inherited wealth, which, when combined with the higher tax rate, could raise an estimated $113 billion over a decade. Biden would use the extra revenue to pay for new social programs like paid family leave and free community college.

As a tax policy expert, I have been following the debate on taxing capital gains and high-income earners for several years.

To understand the implications of raising the tax rate, let’s review some of the basics.

What makes a capital gain?

A person’s income in a given year includes anything that can increase their overall net worth – the difference between the value of everything they own minus any debts they have.

A familiar example is your paycheck, which is known as “labor income.” When you get paid for doing a job, your labor income increases your net worth – that is, until you spend it.

But income doesn’t always come in the form of cash. When the value of something you own increases – such as a stock, your home or your 401(k) – this kind of income is known as a capital gain. For example, if you buy some shares in a company for $1,000 and their value appreciates to $2,000, the $1,000 difference is an “unrealized” capital gain – that is, it hasn’t been sold for a profit yet.

While most Americans get the vast majority of their income from wages and salaries, the rich tend to get a large portion of their income from capital gains. For the very highest earners among the top 0.01%, capital income makes up about two-thirds of total income.

How are capital gains taxed?

Unlike wages, capital gains are harder to calculate – and harder to tax.

To tax something, the Internal Revenue Service needs to know its value. But while some assets such as stocks and mutual funds are bought and sold often and so their market price is well known, others like real estate or fine art don’t change hands that often. That means it’s harder to know their value.

Congress’ solution has been to tax capital gains only when they are realized – that is, when the asset is sold. The gain is the difference between the sale price and the original purchase price – known as the “basis.”

Fortunately for most people, the largest capital gains they will ever earn – gains on the sale of their home – are usually exempt from taxes, as are capital gains earned in tax-sheltered retirement or education savings accounts like 401(k)s and 529 plans. Three-quarters of all U.S. stocks are held in nontaxable accounts.

As for taxable investments, as long as you hold on to them, you don’t have to pay capital gains taxes. In fact, if you die, your heirs don’t have to pay either. Under current law, when someone inherits an asset, its value gets reset. This is known as the “basis step-up.”

Put simply, the basis is the original price you paid for the asset. Let’s say you invested $100,000 in some stock and held on to it until you died, at which point it is worth $300,000. If your heirs eventually sell the stock for $700,000, their basis wouldn’t be $100,000 but $300,000, meaning they would pay taxes on only $400,000 in capital gains. But no one will ever pay tax on the $200,000 in appreciation that accrued before you died.

Biden’s plan would eliminate this basis step-up and require heirs with incomes over $1 million to pay taxes on the entire amount of their capital gains.

What’s the current tax rate?

When the modern income tax was created in 1913, capital gains were taxed at the same rates as ordinary income – as high as 77% in 1918 during World War I.

After the war, conservatives began to make the case for tax cuts. So Congress lowered the top individual tax rate to 58% in 1922 and split off capital gains from regular income, slashing the rate to 12.5%.

Since then, capital gains tax rates have been changed frequently, climbing as high as 40% but typically remaining much lower than the top rate on ordinary income. It’s currently 20% on incomes over $441,450 and 15% on incomes from $40,001 to $441,450. There’s no capital gains tax on income $40,000 or less.

It also depends on how long you own the asset. If you buy and sell in less than a year, it’s considered a short-term capital gain and is taxed at the same rate as your wage income.

What’s the impact of the capital gains tax?

Supporters of relatively low rates for capital gains argue that this stimulates entrepreneurship, mitigates double taxation of corporate income and alleviates the “lock-in” effect that discourages investors from selling assets to avoid taxes.

They also point out that inflation erodes the real value of capital gains. Lower rates help offset this penalty.

Other research, however, suggests that cutting capital gains taxes has no significant effect on economic growth and creates other distortions that hurt economic efficiency. For example, hedge fund managers exploit the “carried interest” loophole to categorize their income as capital gains instead of wages so they can qualify for a lower tax rate.

Whether or not capital gains tax policy actually increases economic efficiency, tax scholars do know it makes the tax system more regressive. Since capital gains are highly concentrated among high-income taxpayers, tax breaks for capital gains primarily benefit the wealthy.

The Tax Policy Center estimates that in 2019 taxpayers with incomes over $1 million received over three-quarters of the benefits of lower rates, while taxpayers earning less than $75,000 received just 1.2%.

This is an updated and expanded version of an article originally published on Aug. 8, 2018.The Conversation

About the Author:

Stephanie Leiser, Lecturer in Public Policy, University of Michigan

This article is republished from The Conversation under a Creative Commons license. Read the original article.

Ichimoku Cloud Analysis 29.04.2021 (NZDUSD, GBPJPY, AUDUSD)

Article By RoboForex.com

NZDUSD, “New Zealand Dollar vs US Dollar”

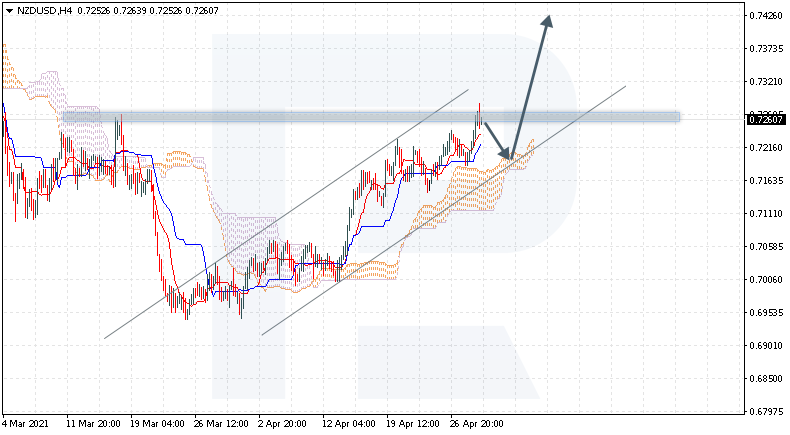
NZDUSD is trading at 0.7260; the instrument is moving above Ichimoku Cloud, thus indicating an ascending tendency. The markets could indicate that the price may test the cloud’s upside border at 0.7205 and then resume moving upwards to reach 0.7425. Another signal in favor of a further uptrend will be a rebound from the rising channel’s downside border. However, the bullish scenario may be canceled if the price breaks the cloud’s downside border and fixes below 0.7105. In this case, the pair may continue falling towards 0.7015. To confirm further growth, the asset must break the resistance level and fix above 0.7270 – as we can see, bulls are testing this level for the second time.

NZDUSD
Risk Warning: the result of previous trading operations do not guarantee the same results in the future

GBPJPY, “Great Britain Pound vs Japanese Yen”

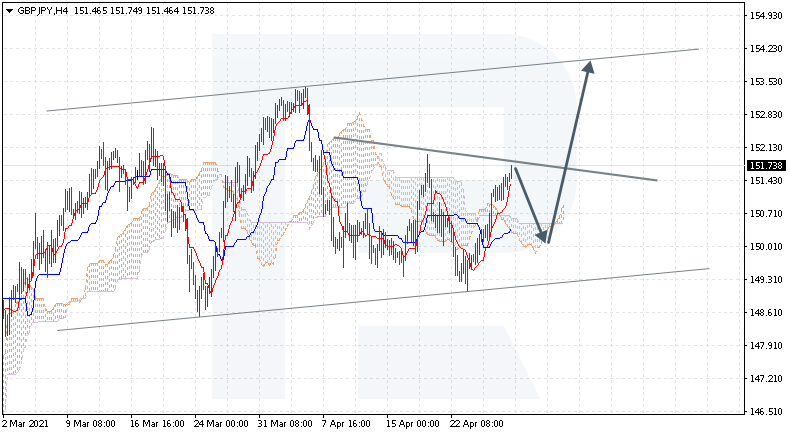
GBPJPY is trading at 151.73; the instrument is moving above Ichimoku Cloud, thus indicating an ascending tendency. The markets could indicate that the price may test the cloud’s downside border at 150.05 and then resume moving upwards to reach 153.75. Another signal in favor of a further uptrend will be a rebound from the downside border of an Inverted Head & Shoulders reversal pattern. However, the bullish scenario may no longer be valid if the price breaks the cloud’s downside border and fixes below 149.20. In this case, the pair may continue falling towards 148.30. To confirm further growth, the asset must break the pattern’s neckline and fix above 152.15.

GBPJPY
Risk Warning: the result of previous trading operations do not guarantee the same results in the future

AUDUSD, “Australian Dollar vs US Dollar”

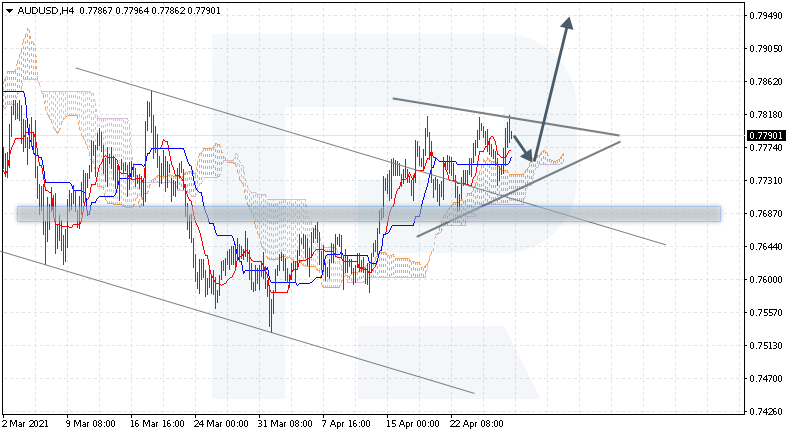
AUDUSD is trading at 0.7790; the instrument is moving above Ichimoku Cloud, thus indicating an ascending tendency. The markets could indicate that the price may test the cloud’s upside border at 0.7765 and then resume moving upwards to reach 0.7950. Another signal in favor of a further uptrend will be a rebound from the downside of the Triangle pattern. However, the bullish scenario may no longer be valid if the price breaks the cloud’s downside border and fixes below 0.7670. In this case, the pair may continue falling towards 0.7585. To confirm further growth, the asset must break the pattern’s upside border and fix above 0.7825.

AUDUSD

Article By RoboForex.com

Attention!
Forecasts presented in this section only reflect the author’s private opinion and should not be considered as guidance for trading. RoboForex LP bears no responsibility for trading results based on trading recommendations described in these analytical reviews.

Forex Technical Analysis & Forecast 29.04.2021

Article By RoboForex.com

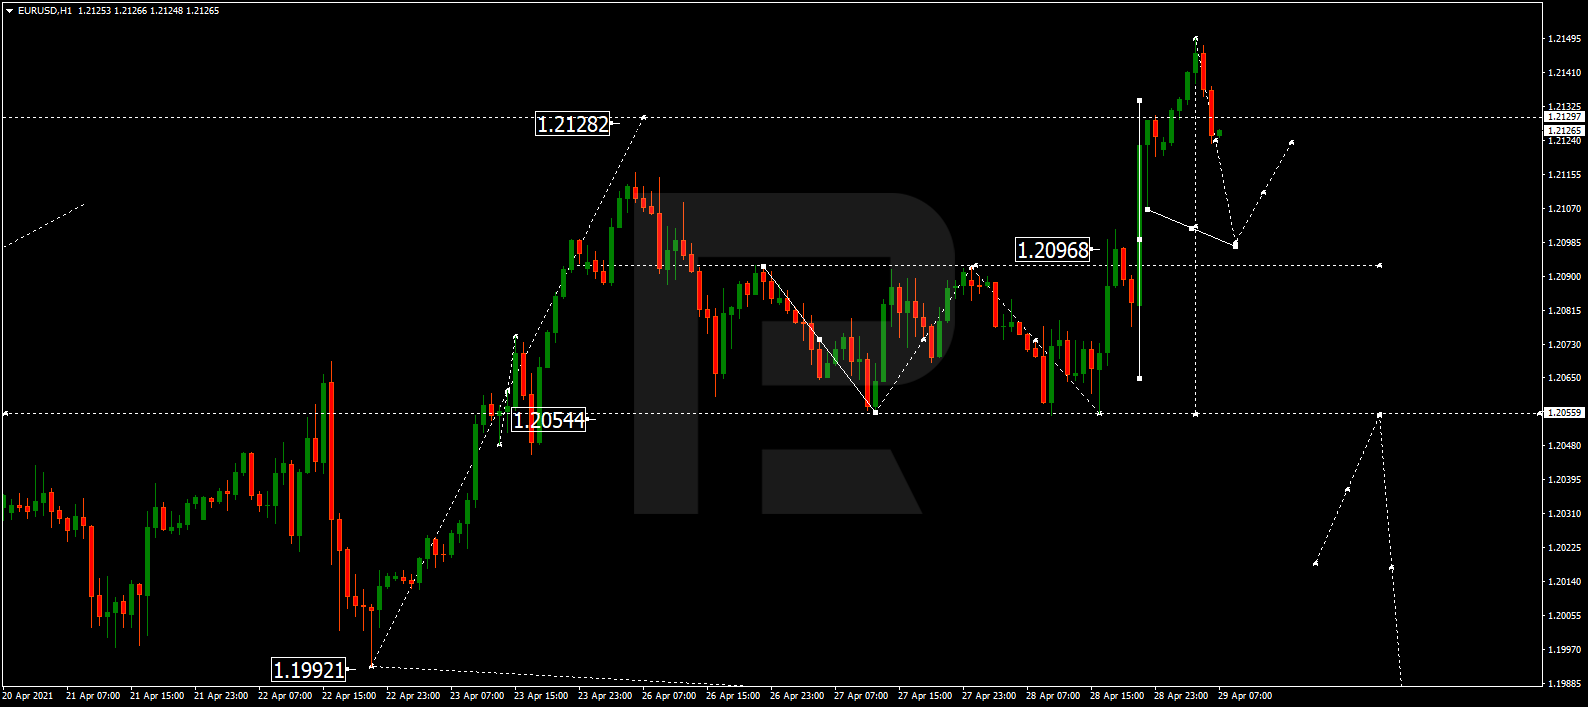
EURUSD, “Euro vs US Dollar”

After breaking the consolidation range to the upside at 1.2096, EURUSD has reached 1.2138. Today, the pair may fall to test 1.2096 from above and then resume trading upwards with the target at 1.2124.

EURUSD
Risk Warning: the result of previous trading operations do not guarantee the same results in the future

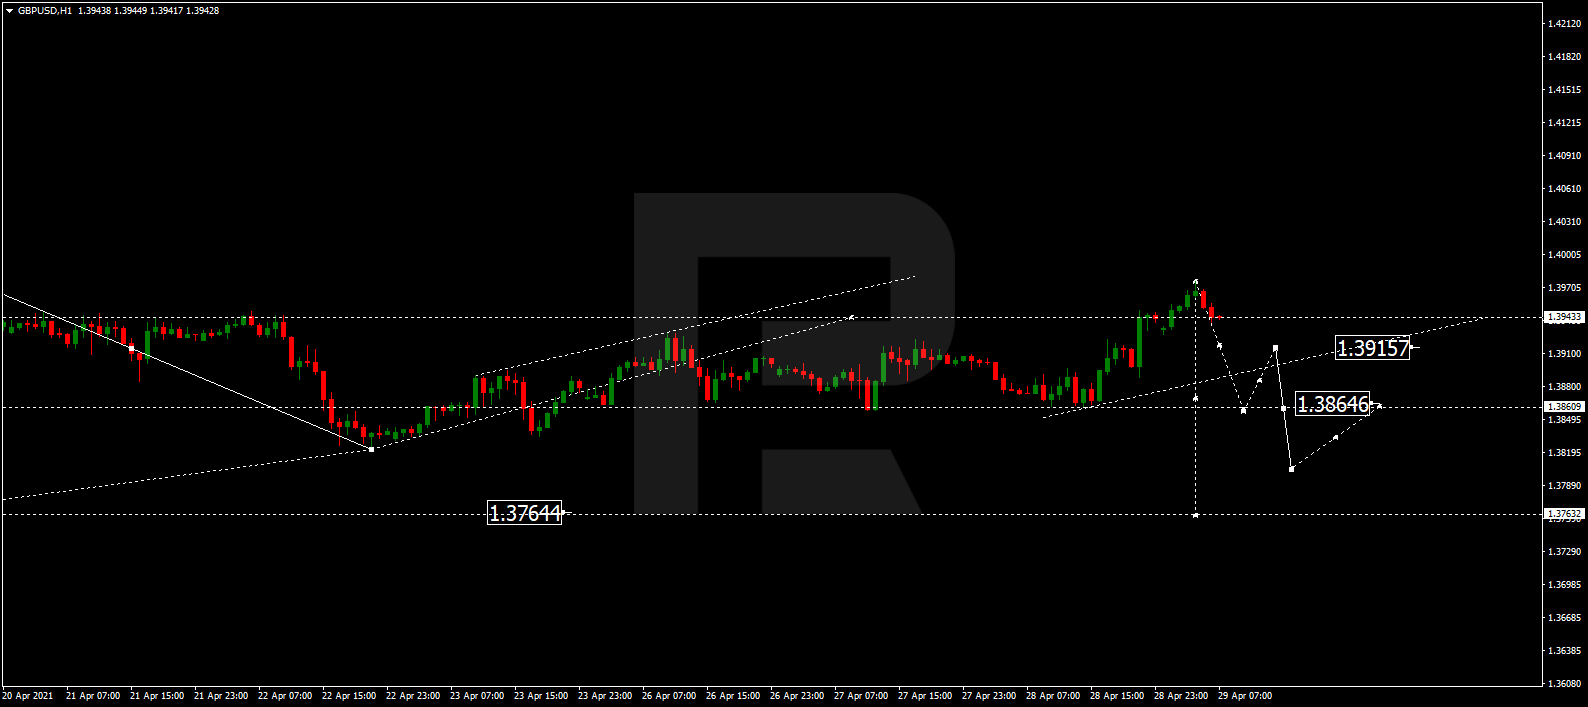
GBPUSD, “Great Britain Pound vs US Dollar”

GBPUSD has finished the ascending wave at 1.3970. Possibly, today the pair may fall to reach 1.3864 and then grow towards 1.3915. Later, the market may resume trading downwards with the target at 1.3770.

GBPUSD
Risk Warning: the result of previous trading operations do not guarantee the same results in the future

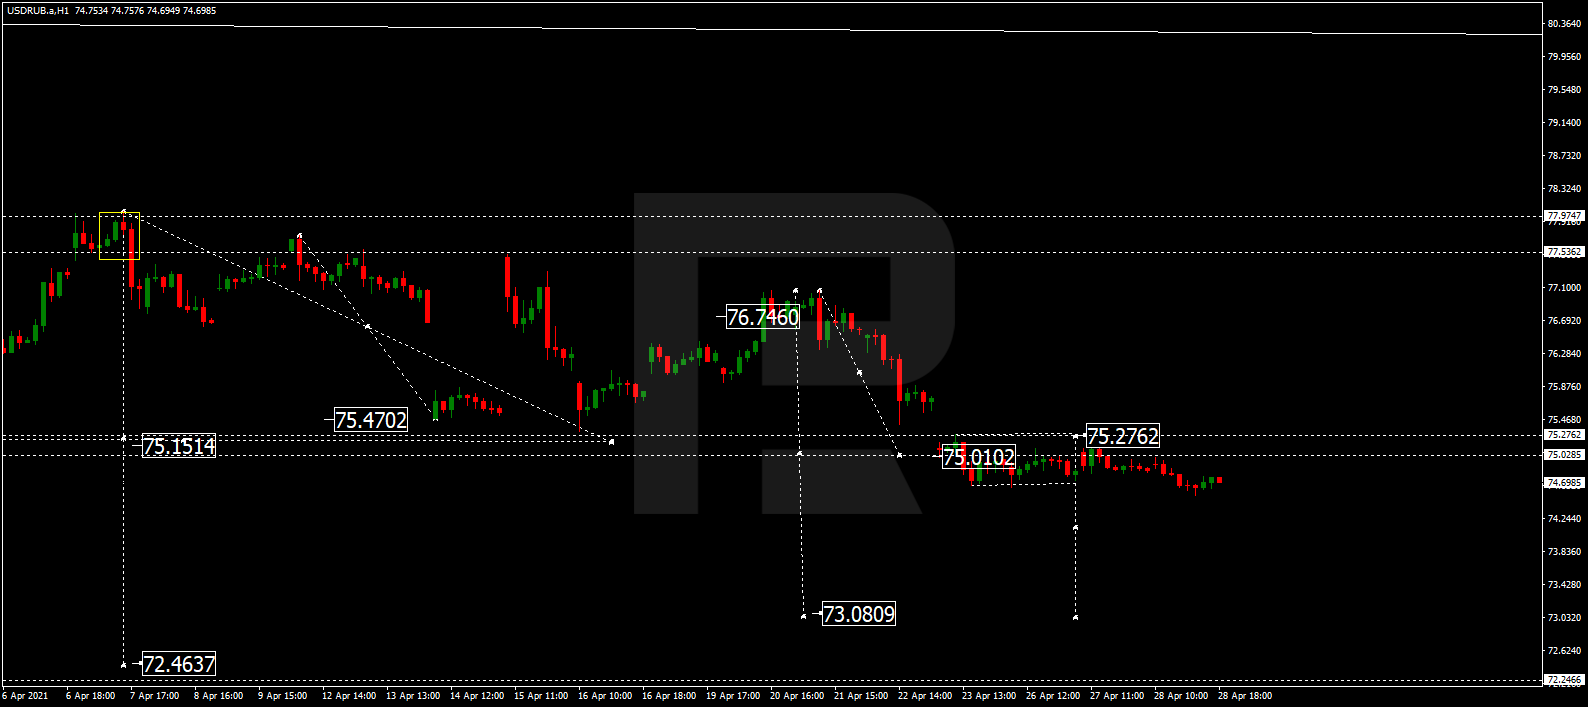
USDRUB, “US Dollar vs Russian Ruble”

USDRUB has broken its consolidation range to the downside. Possibly, the pair may continue trading downwards with the short-term target at 73.00.

USDRUB
Risk Warning: the result of previous trading operations do not guarantee the same results in the future

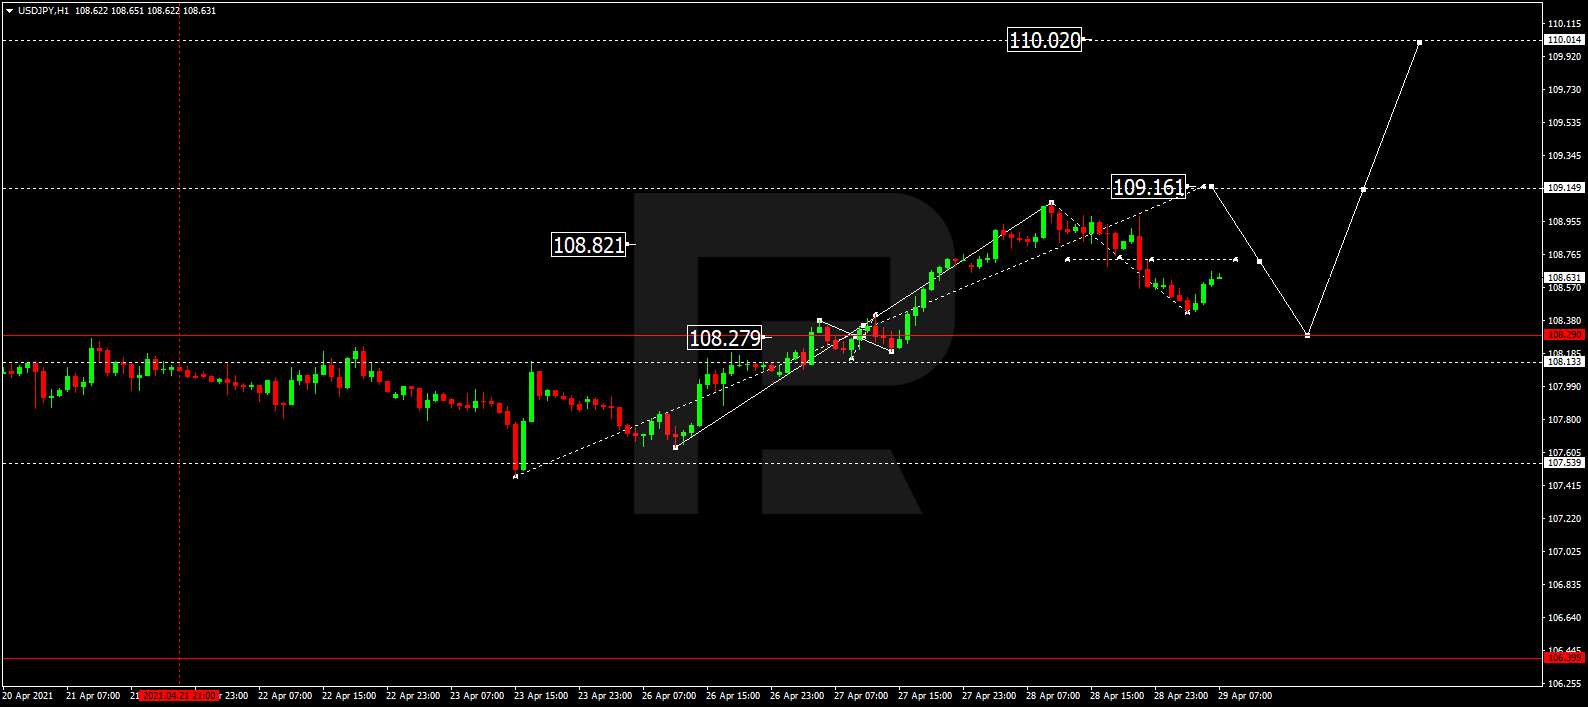
USDJPY, “US Dollar vs Japanese Yen”

USDJPY is still correcting towards 108.29. After that, the instrument may resume growing with the target at 109.16.

USDJPY
Risk Warning: the result of previous trading operations do not guarantee the same results in the future

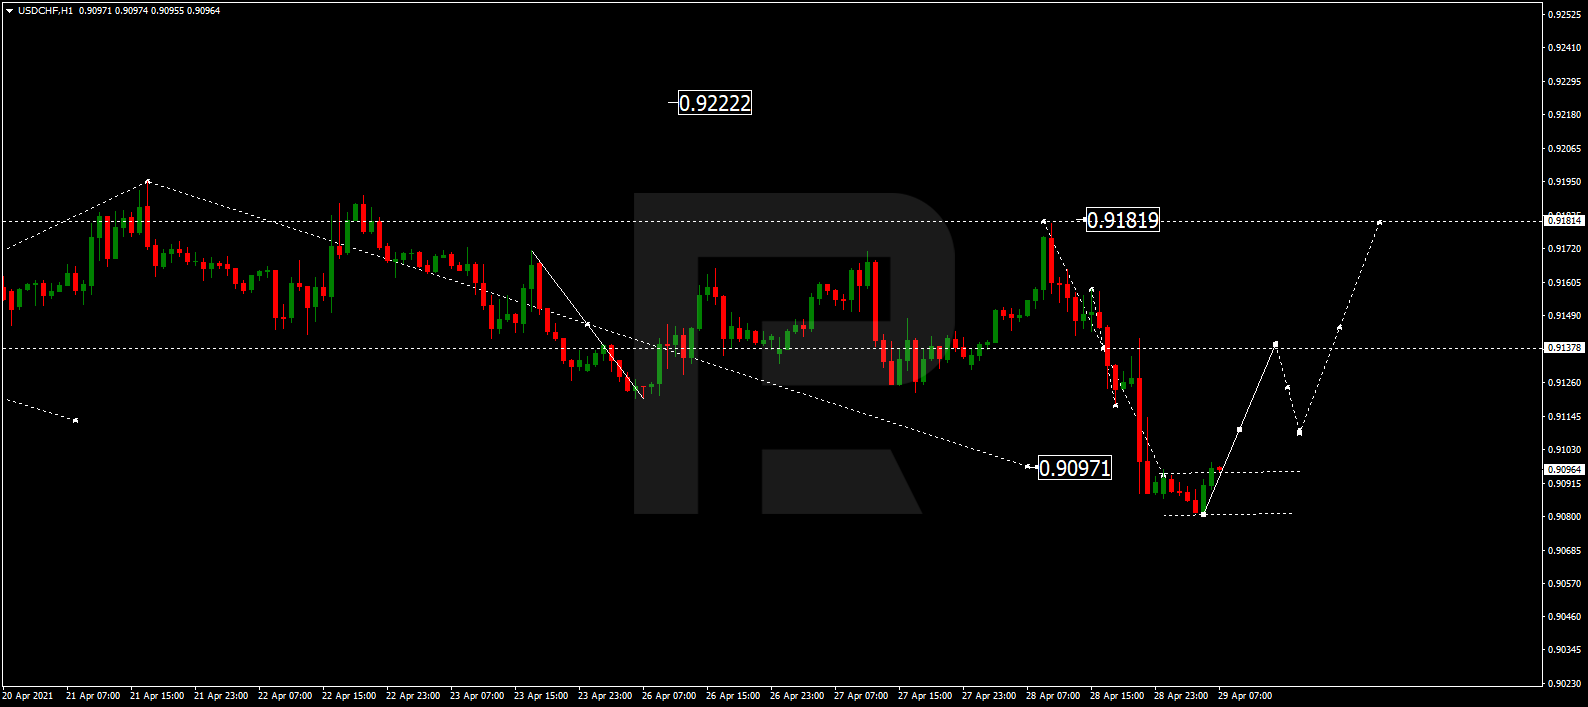
USDCHF, “US Dollar vs Swiss Franc”

After completing the descending wave at 0.9097, USDCHF is consolidating around this level. Possibly, today the pair may form one more ascending structure with the target at 0.9181.

USDCHF
Risk Warning: the result of previous trading operations do not guarantee the same results in the future

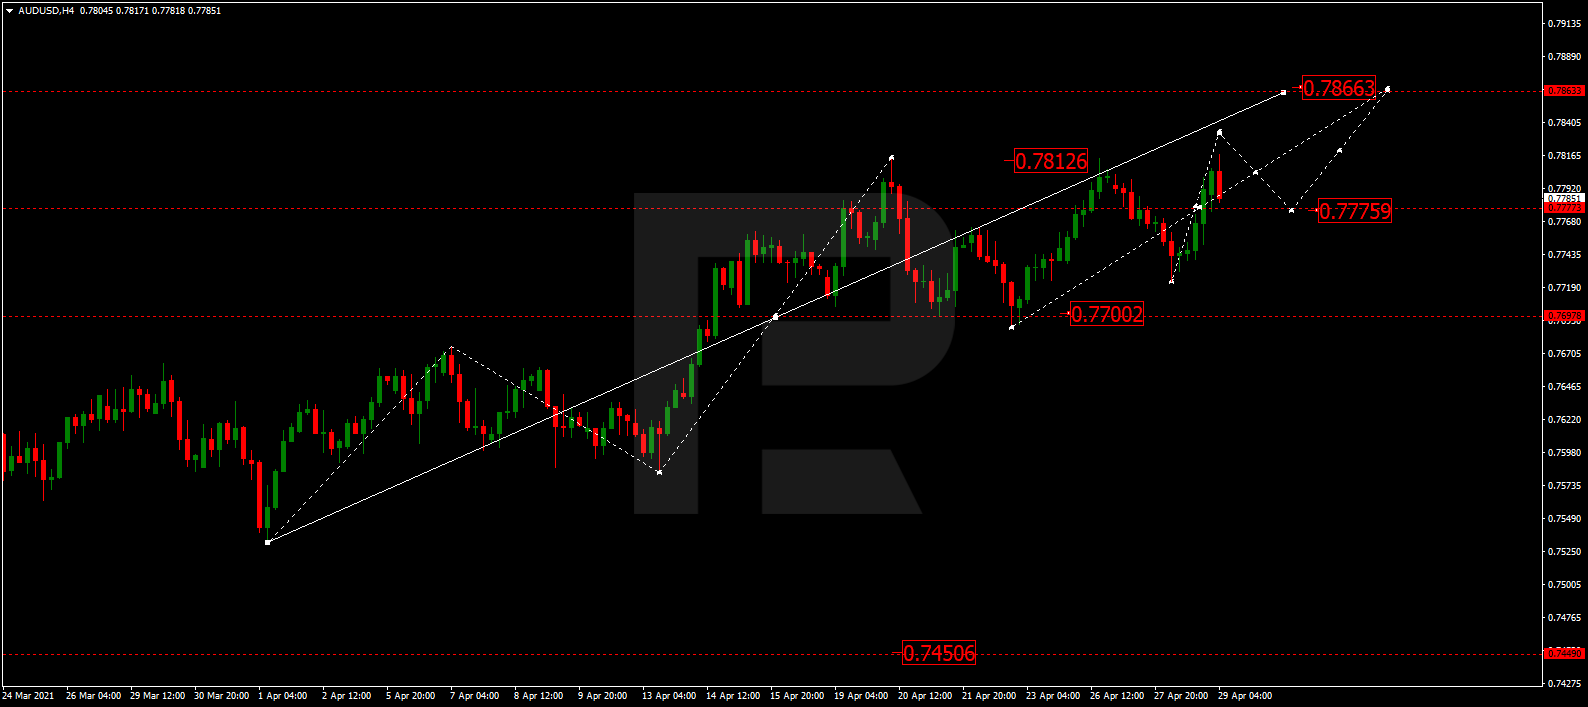
AUDUSD, “Australian Dollar vs US Dollar”

After breaking 0.7777 to the upside, AUDUSD is expected to continue trading upwards with the target at 0.7866. Later, the market may start a new decline to reach 0.7700.

AUDUSD
Risk Warning: the result of previous trading operations do not guarantee the same results in the future

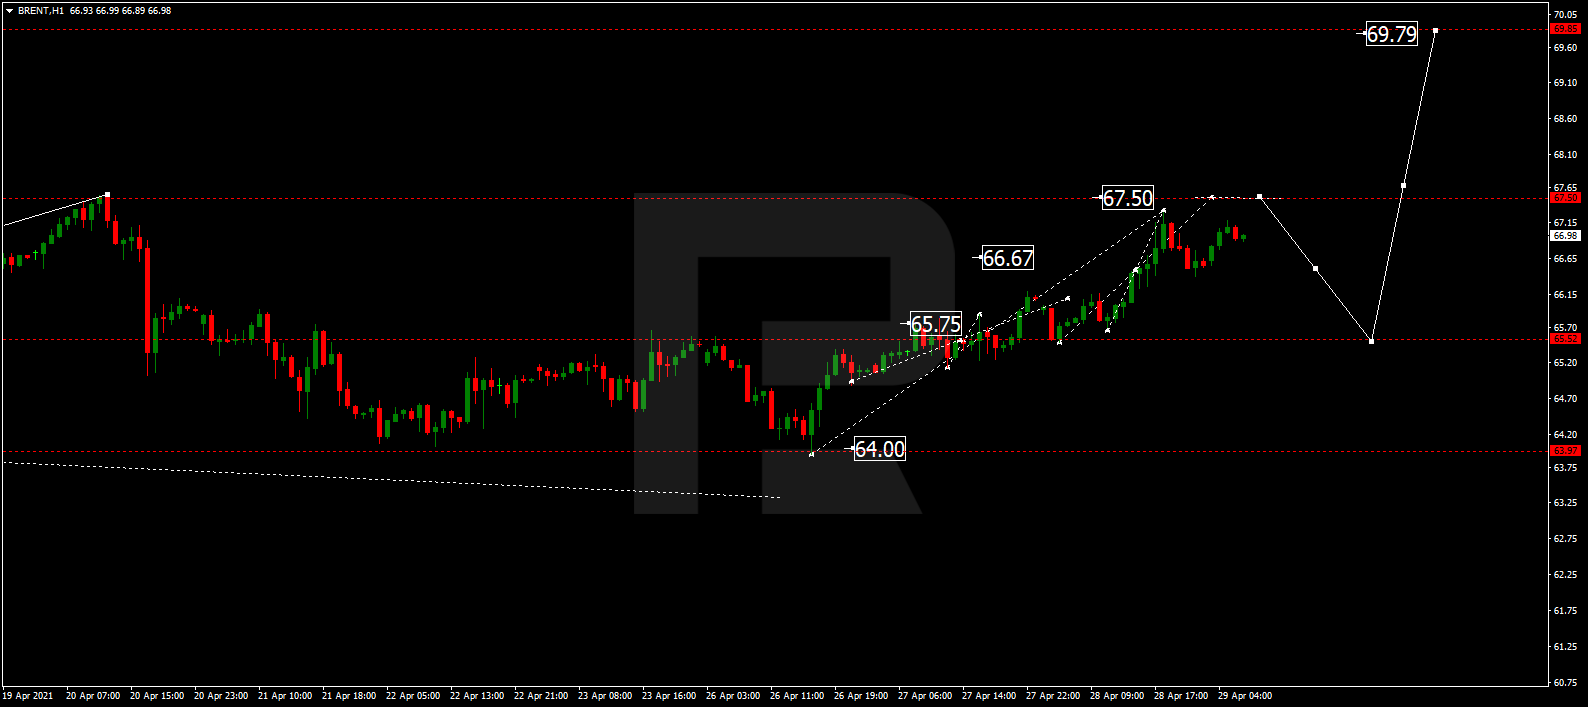
BRENT

Brent is still growing to reach 67.50 and may later correct towards 65.75. After that, the instrument may resume trading upwards with the target at 69.79.

BRENT
Risk Warning: the result of previous trading operations do not guarantee the same results in the future

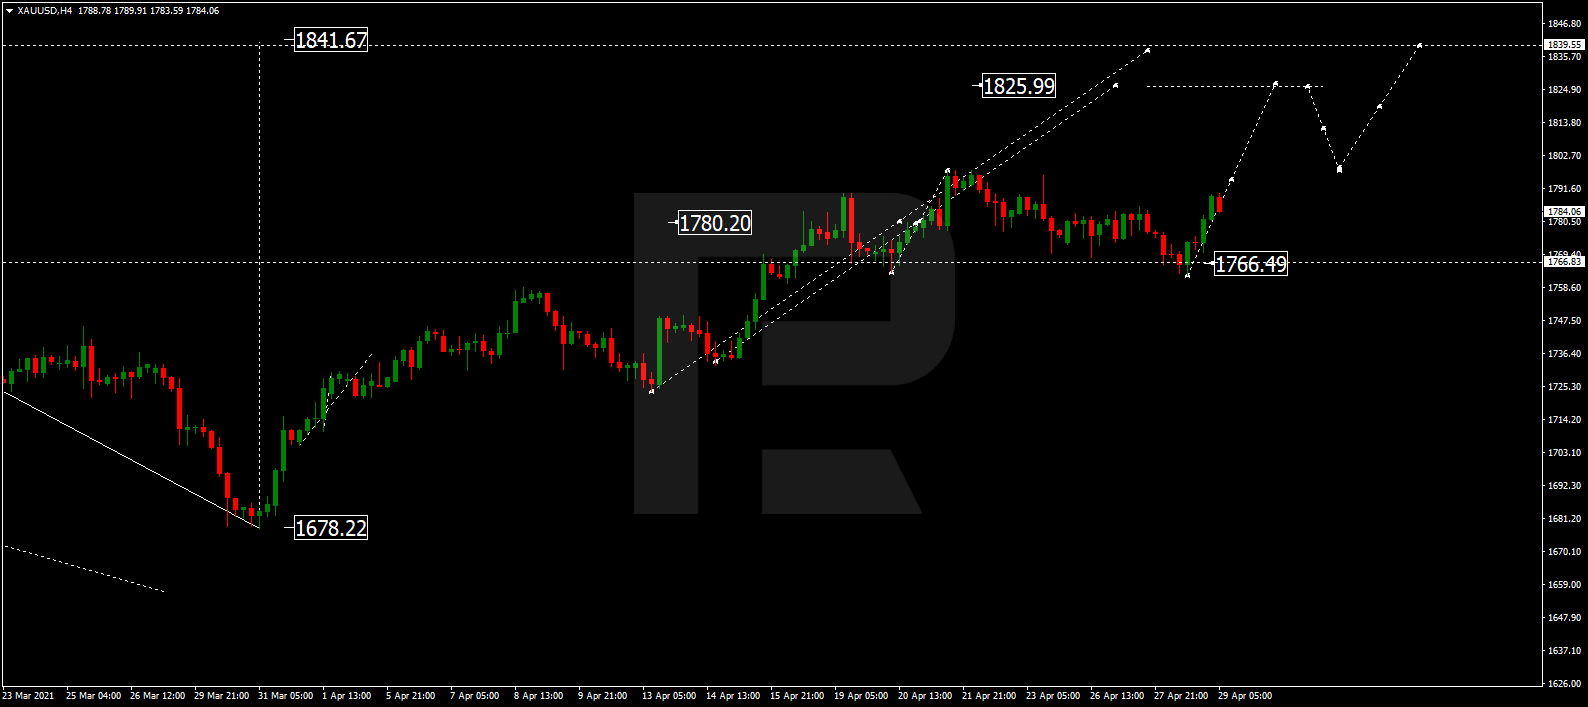
XAUUSD, “Gold vs US Dollar”

Gold has finished the ascending structure at 1766.50; right now, it is growing towards the upside border of the range. Today, the metal may break it and then continue trading within the uptrend towards 1826.00 Later, the market may start a new correction with the target at 1766.50.

GOLD
Risk Warning: the result of previous trading operations do not guarantee the same results in the future

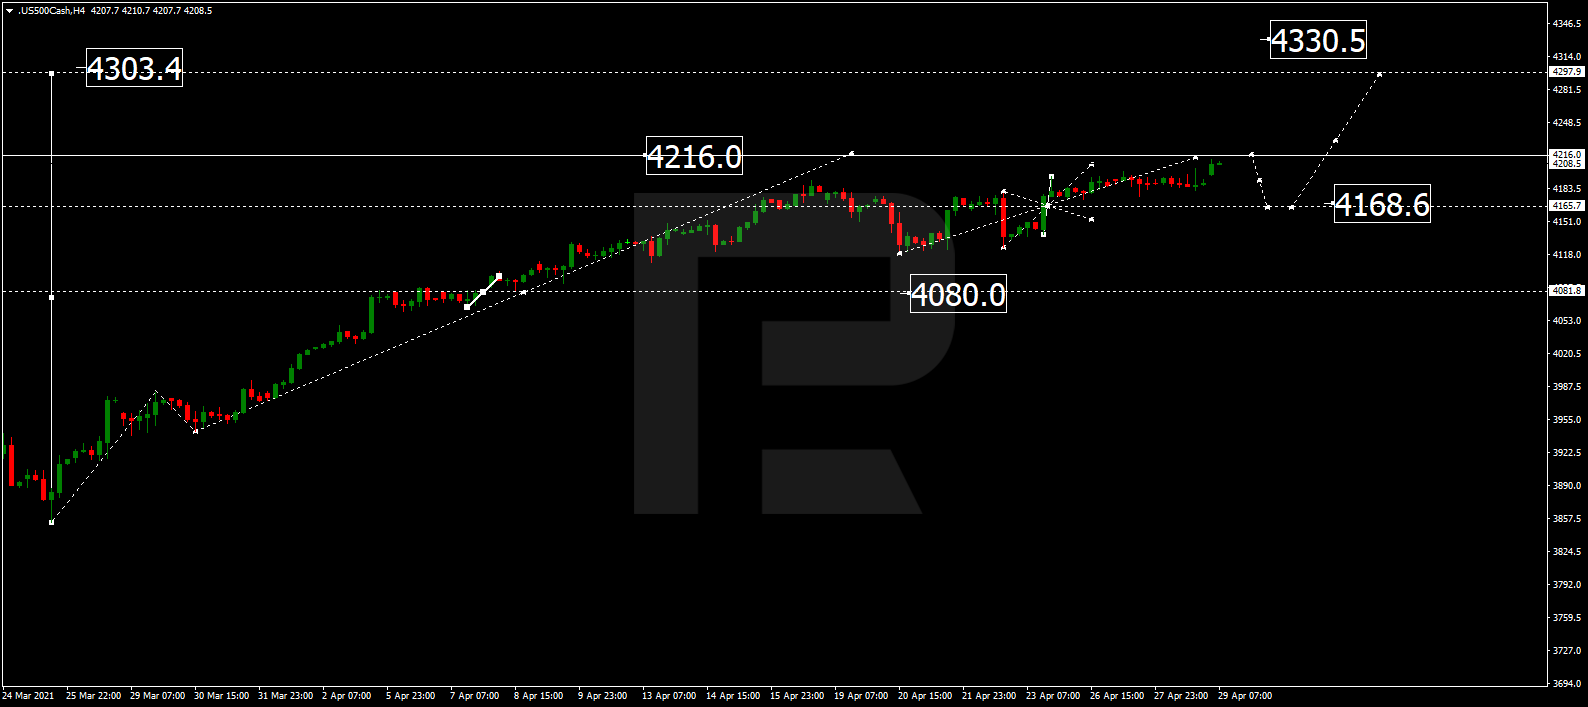
S&P 500

The S&P index is still growing towards 4216.0 and may later correct to reach 4168.6. After that, the instrument may form one more ascending structure with the key target at 4330.5.

S&P 500

Article By RoboForex.com

Attention!
Forecasts presented in this section only reflect the author’s private opinion and should not be considered as guidance for trading. RoboForex LP bears no responsibility for trading results based on trading recommendations described in these analytical reviews.

The Analytical Overview of the Main Currency Pairs on 2021.04.29

by JustForex

The EUR/USD currency pair

Technical indicators of the currency pair:
  • Prev Open: 1.2088
  • Prev Close: 1.2125
  • % chg. over the last day: +0.30%

The sellers could not hold the 1.2088 resistance level, which was impulsively broken by the FOMC news. The uptrend remains bullish. The price is above the moving average, and the growing MACD is in a positive area. There are no signs of a reversal at the moment.

Trading recommendations
  • Support levels: 1.2088, 1.2049, 1.1994, 1.1957
  • Resistance levels: 1.2176, 1.2212, 1.2243

The best strategy for the EUR/USD pair is to look for buying from the nearest support levels. The price can pull back to the broken level of 1.2088, which will act as support. Buyers should not let the price go below 1.2088 in order to maintain the upward momentum.

Alternative scenario: if the price breaks down through the 1.2088 level and holds below, with a high probability, the price can go down to 1.2049, with a potential to start a local downtrend correction.

EUR/USD
News feed for 2021.04.29:
  • – Unemployment Rate, Germany at 10:55 (GMT+3);
  • – Consumer Price Index, Germany at 15:00 (GMT+3);
  • – Gross Domestic Product, U.S. at 15:30 (GMT+3).

The GBP/USD currency pair

Technical indicators of the currency pair:
  • Prev Open: 1.3911
  • Prev Close: 1.3941
  • % chg. over the last day: +0.21%

The British currency showed strong growth on Wednesday, adding 0.21%. At the opening on Thursday, the price broke through the 1.3944 resistance level, which would act as a support. Also, there is the formation of the local uptrend channel.

Trading recommendations
  • Support levels: 1.3944, 1.3913, 1.3864, 1.3835, 1.3794, 1.3756, 1.3690
  • Resistance levels: 1.3996, 1.4149

The strategy for the GBP/USD currency pair remains unchanged – buying from the support levels. The next target is 1.3996.

Alternative scenario: if the price breaks down the support level of 1.3864 and holds below, the price will go to test the 1.3794 level. Moving below 1.3794 will temporarily cancel the bullish scenario on the current timeframe.

GBP/USD
News feed for 2021.04.29:
  • – Gross Domestic Product, U.S. at 15:30 (GMT+3).

The USD/JPY currency pair

Technical indicators of the currency pair:
  • Prev Open: 108.63
  • Prev Close: 108.59
  • % chg. over the last day: -0.03%

The USD/JPY currency pair failed to break through the resistance level of 109.04. The price showed a rapid downward reaction, indicating the presence of a large seller. The upward local trend line has also been broken, so the price is moving now to the support levels.

Trading recommendations
  • Support levels: 108.54, 108.19,107.77, 107.47, 107.04, 105.92
  • Resistance levels: 108.87, 109.04, 109.36

The price is above the moving average, but the MACD is falling. Under such market conditions, it is possible to go both long and short. It all depends on which timeframe is chosen for trading. On the intraday timeframes, traders can open short positions, on the H1 timeframe it is preferable to look for opening buy positions from the support levels.

Alternative scenario: if the price drops below 108.19 again, with a high probability, the general downtrend will continue.

USD/JPY
News feed for 2021.04.29:
  • – Gross Domestic Product, U.S. at 15:30 (GMT+3).

The USD/CAD currency pair

Technical indicators of the currency pair:
  • Prev Open: 1.2402
  • Prev Close: 1.2310
  • % chg. over the last day: -0.07%

The Canadian dollar continues to strengthen against the U.S. currency. The dynamics of the USD/CAD currency pair is strictly downward. The price is below the moving average, and MACD is in the negative area without any signs of divergence.

Trading recommendations
  • Support levels: 1.2280, 1.2165
  • Resistance levels: 1.2343, 1.2388, 1.2414, 1.2488, 1.2519, 1.2574

The most correct strategy for the USD/CAD pair is to look for sell positions from the resistance levels. On such a strong trend, the price will not pull back deeply.

Alternative scenario: if the price breaks through the 1.2414 resistance level and holds above, with a high probability, a local corrective uptrend will be formed.

USD/CAD
News feed for 2021.04.29:
  • – Gross Domestic Product, U.S. at 15:30 (GMT+3).

by JustForex


This article reflects a personal opinion and should not be interpreted as an investment advice, and/or offer, and/or a persistent request for carrying out financial transactions, and/or a guarantee, and/or a forecast of future events.