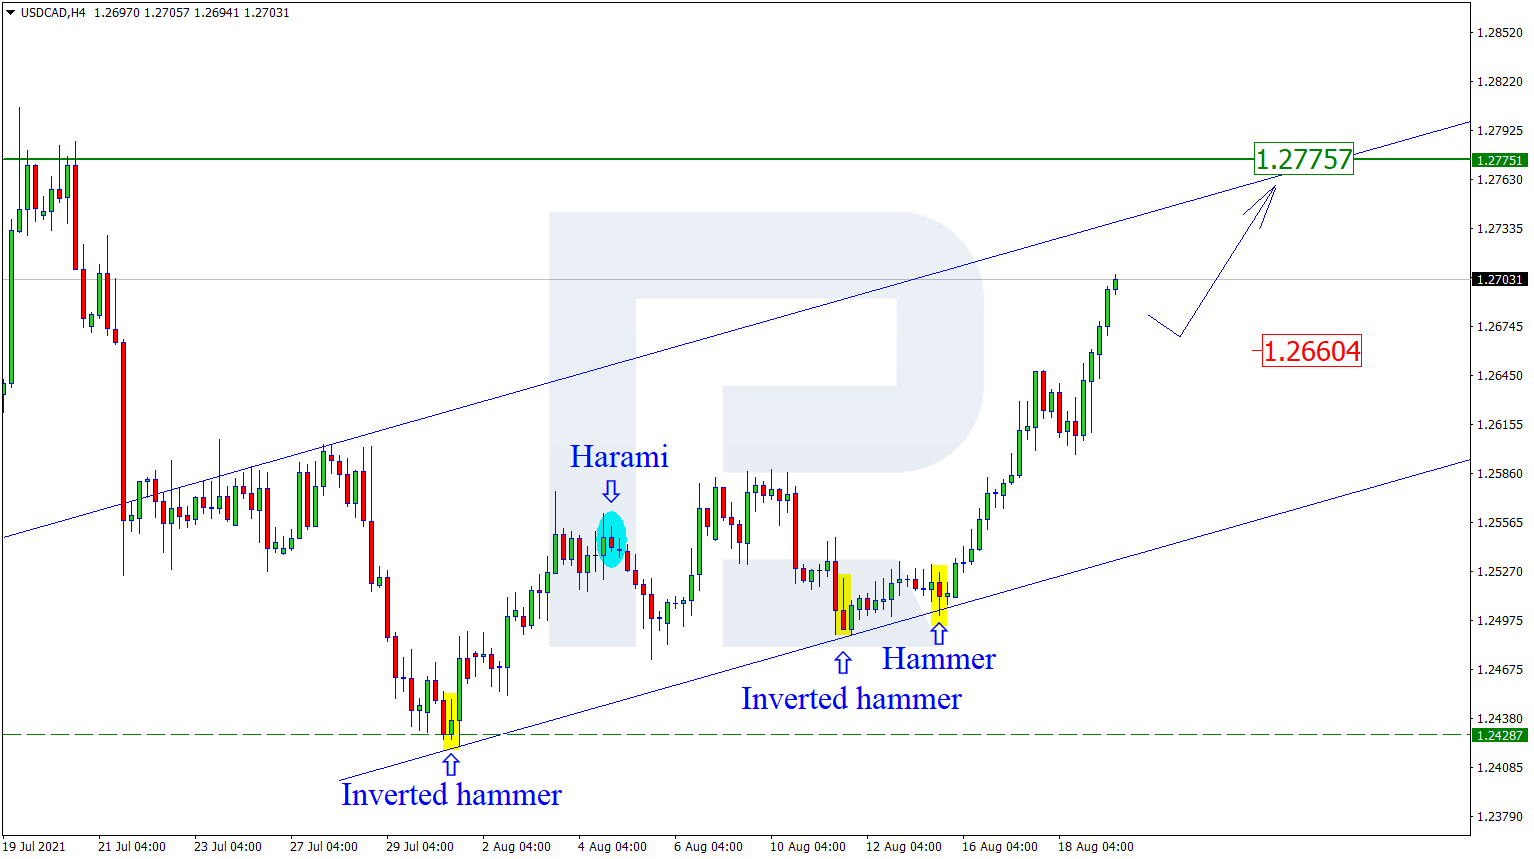
As we can see in the H4 chart, the asset continues growing. After forming several reversal patterns, such as Hammer and Inverted Hammer, close to the support level, USDCAD is reversing and resume growing towards the resistance area at 1.2775. However, an alternative scenario implies that the asset may correct to reach 1.2660 before resuming its growth.
AUDUSD, “Australian Dollar vs US Dollar”
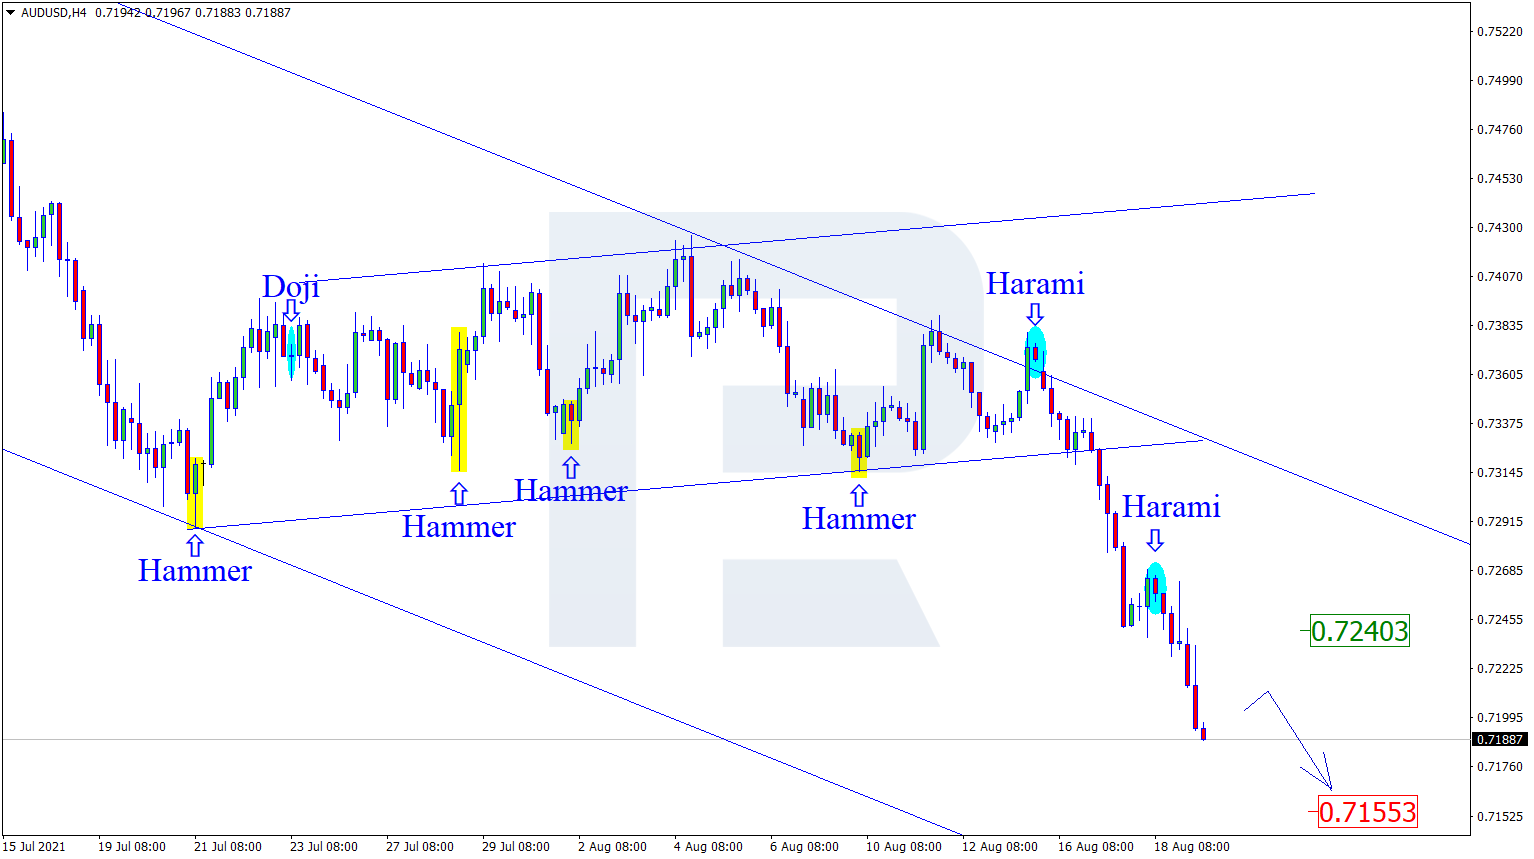
As we can see in the H4 chart, AUDUSD continues falling within the descending channel; by now, it has formed a Harami reversal pattern during the pullback. At the moment, the asset is reversing. In this case, the downside target may be at 0.7155. At the same time, an opposite scenario implies that the price may correct to reach the resistance level at 0.7240 and before continuing its descending tendency.
USDCHF, “US Dollar vs Swiss Franc”
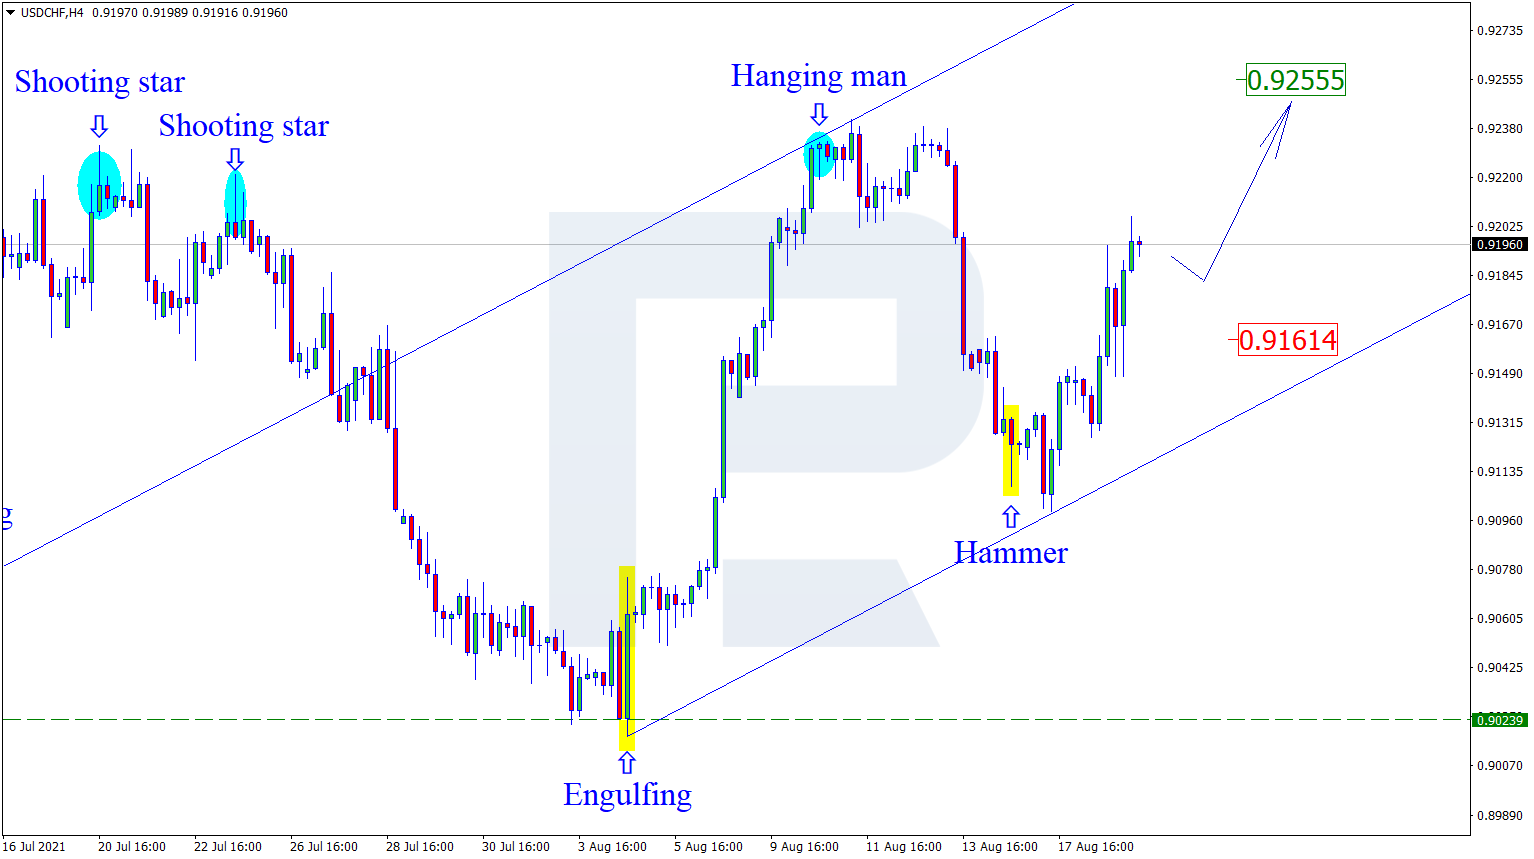
As we can see in the H4 chart, the uptrend continues. By now, the pair has formed several reversal patterns, for example, Doji and Hammer, close to the channel’s downside border. At the moment, USDCHF may reverse and grow towards the resistance level. In this case, the upside target may be at 0.9255. Still, there might be an alternative scenario, according to which the asset may correct towards 0.9161 first and then resume trading upwards.
Attention! Forecasts presented in this section only reflect the author’s private opinion and should not be considered as guidance for trading. RoboForex LP bears no responsibility for trading results based on trading recommendations described in these analytical reviews.
The US dollar rose after the Fed minutes suggested tapering later this year.
The euro’s previous rebound had met stiff selling pressure at 1.1800. The slide below 1.1710 (a critical support from last March) is an indication that sellers still have control of the direction.
A temporary bounce while the RSI recovers to the neutrality area can be an opportunity to sell into strength.
The former support at 1.1740 has turned into a supply zone. Below 1.1700 renewed momentum may drive the pair to October’s low at 1.1600.
GBPUSD sees limited rebound
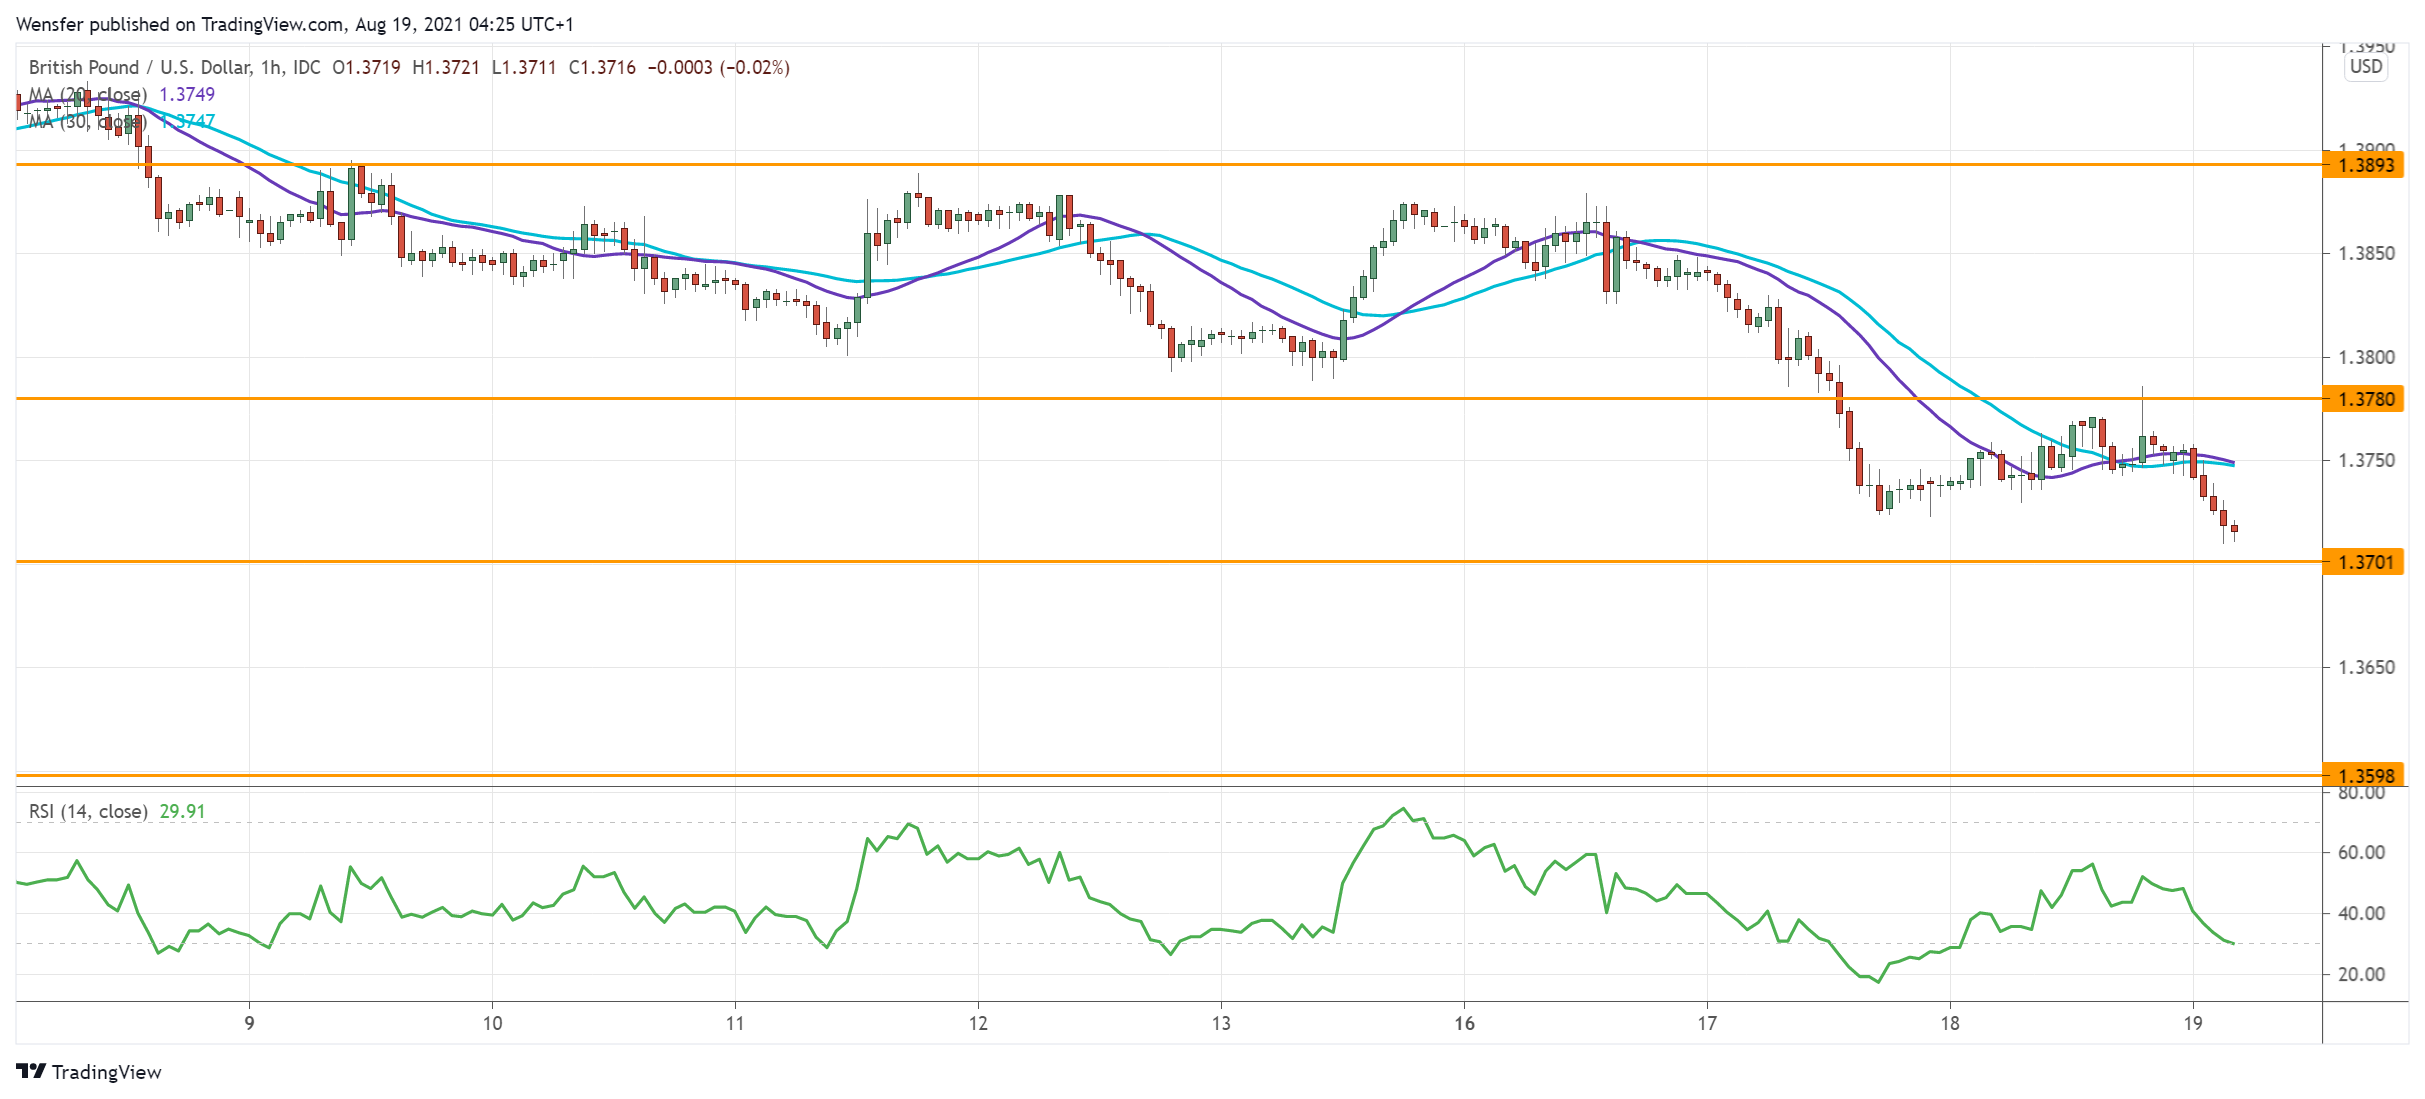
The sterling remains under pressure after the UK’s lower-than-expected core CPI in July. The break below the intermediate support at 1.3800 has accelerated the downward impetus.
An oversold RSI has helped lift the price but this could be a dead cat bounce with sellers eager to double down at a better fill.
1.3780 is a fresh resistance and likely to check the pound’s advance. 1.3700 is the closest support which coincides with the 61.8% Fibonacci retracement of the July rally.
Further down, 1.3600 is a demand zone on the daily chart.
USDCAD resumes rally
Upbeat BOC CPI failed to outweigh the US Fed’s hawkish July minutes. The US dollar’s rally has gained traction after it cleared the supply area at 1.2600.
A combination of short-covering and fresh buying suggests that the uptrend may have resumed after a month-long consolidation. An overbought RSI may cause a limited pullback.
The resistance-turned-support at 1.2580 would see buying interest in that case. On the upside, a break above 1.2700 could open the door to the peak at 1.2800.
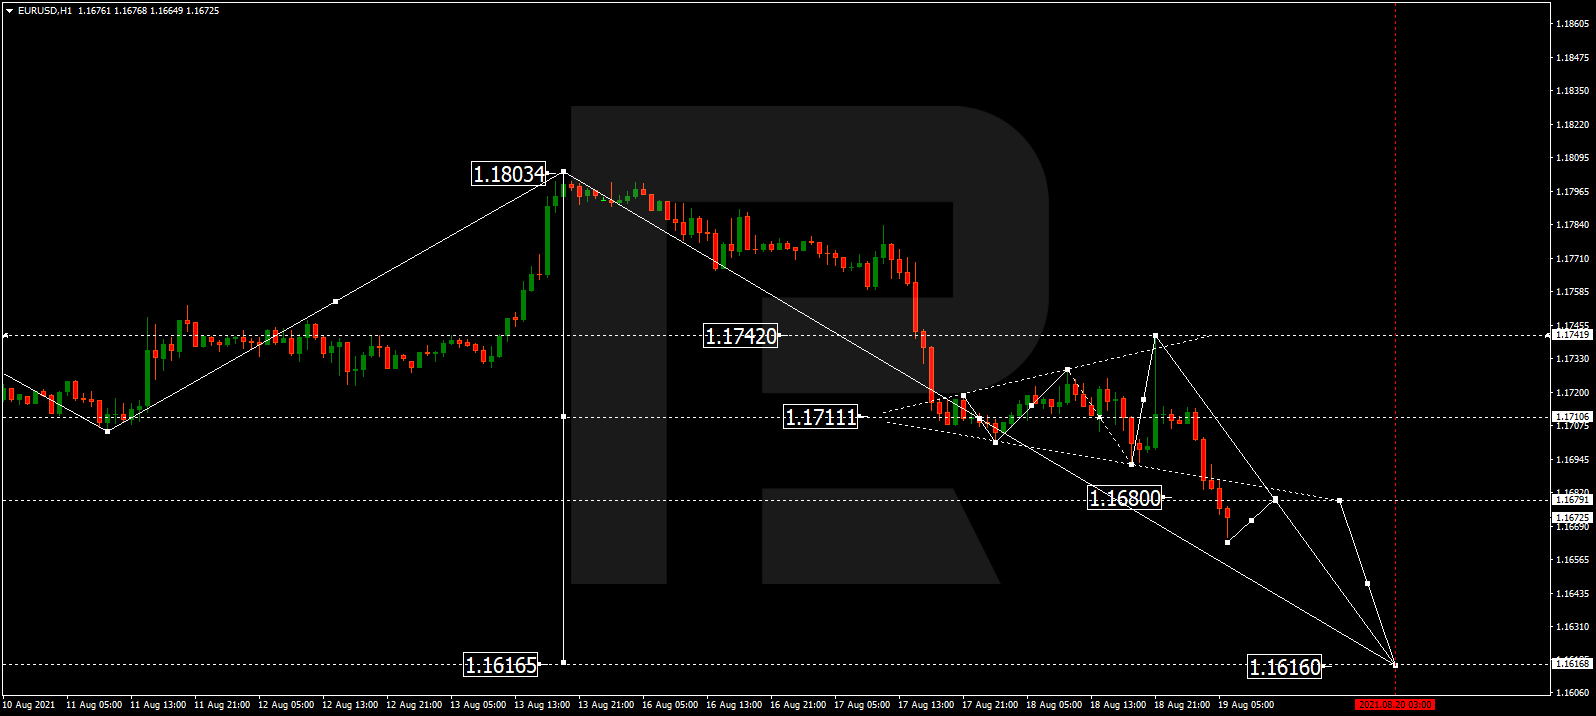
After finishing the correction at 1.1740 and rebounding from this level, EURUSD has reached 1.1680, thus forming a downside continuation pattern around 1.1711, which may be considered as the third wave to the downside with the short-term target at 1.1616. Later, the market may start a new correction to return to 1.1711 and test it from below.
GBPUSD, “Great Britain Pound vs US Dollar”
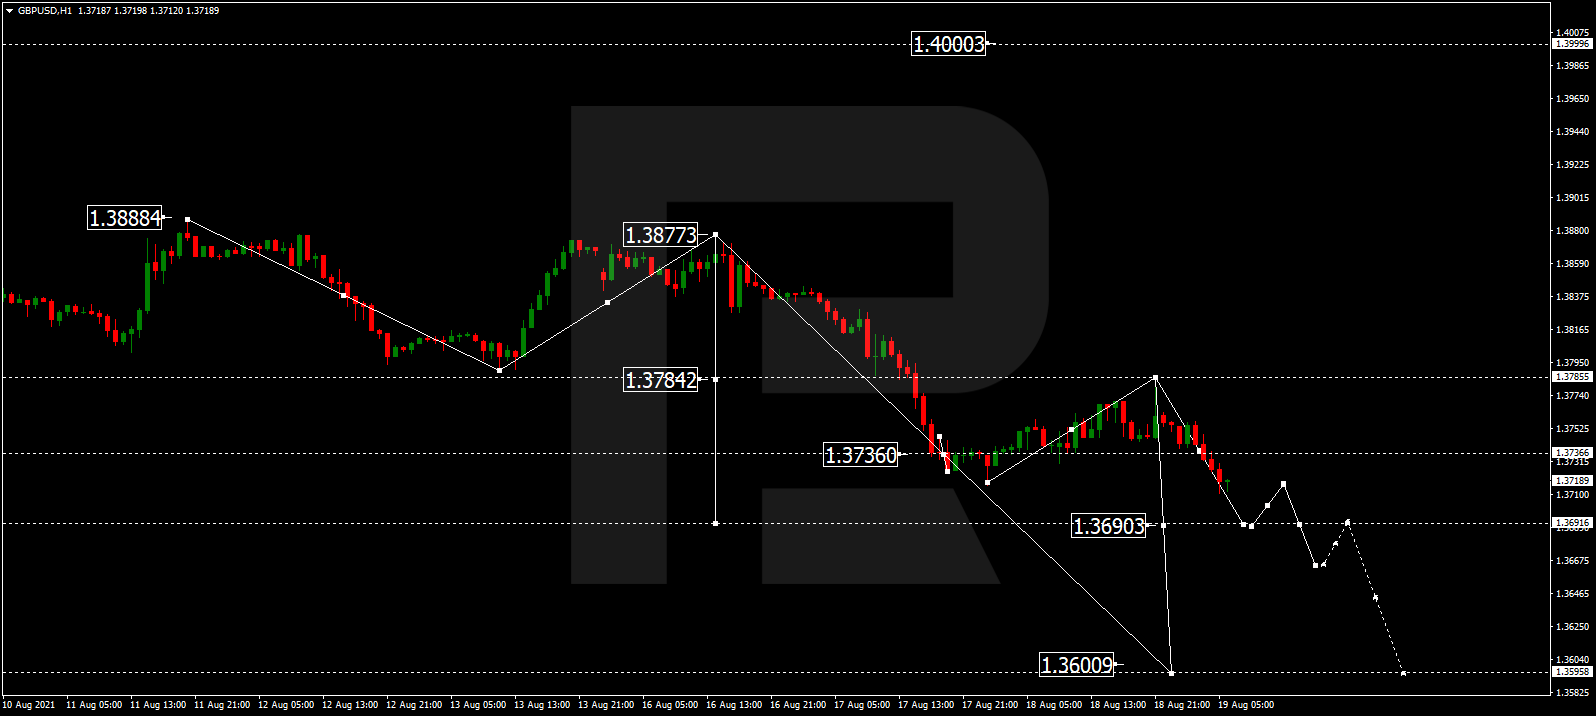
After completing the correction at 1.3780 and rebounding from this level, GBPUSD is still falling; by now, it has reached 1.3715. Today, the pair may continue falling towards 1.3690, which is considered as the centre of another descending wave. After that, the instrument may form a new consolidation range around the latter level in the form of a continuation pattern. The predicted downside target at 1.3600.
USDRUB, “US Dollar vs Russian Ruble”
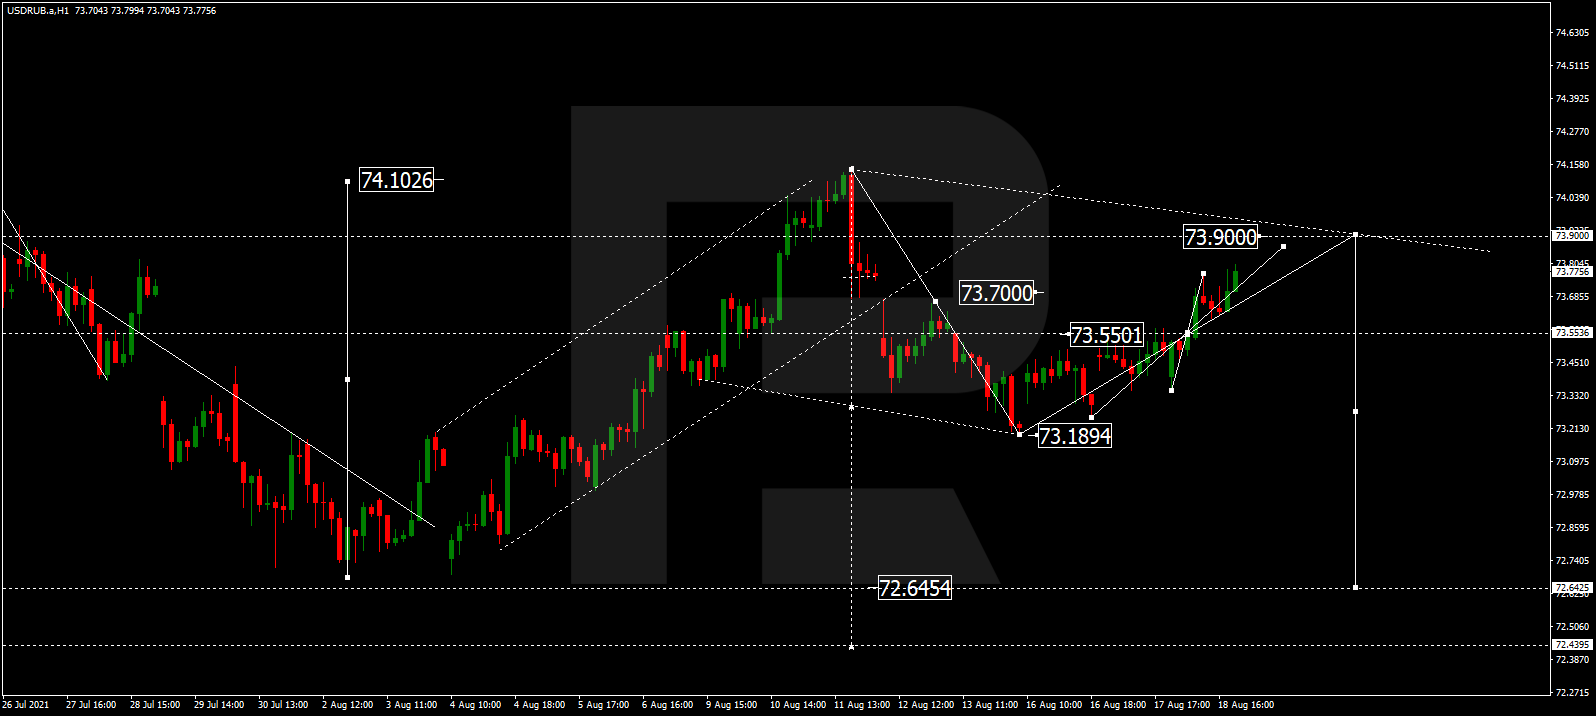
USDRUB has finished the ascending structure at 73.93. Possibly, today the pair may consolidate around this level. If later the price breaks this range to the downside, the market may resume trading downwards with the target at 72.70.
USDJPY, “US Dollar vs Japanese Yen”
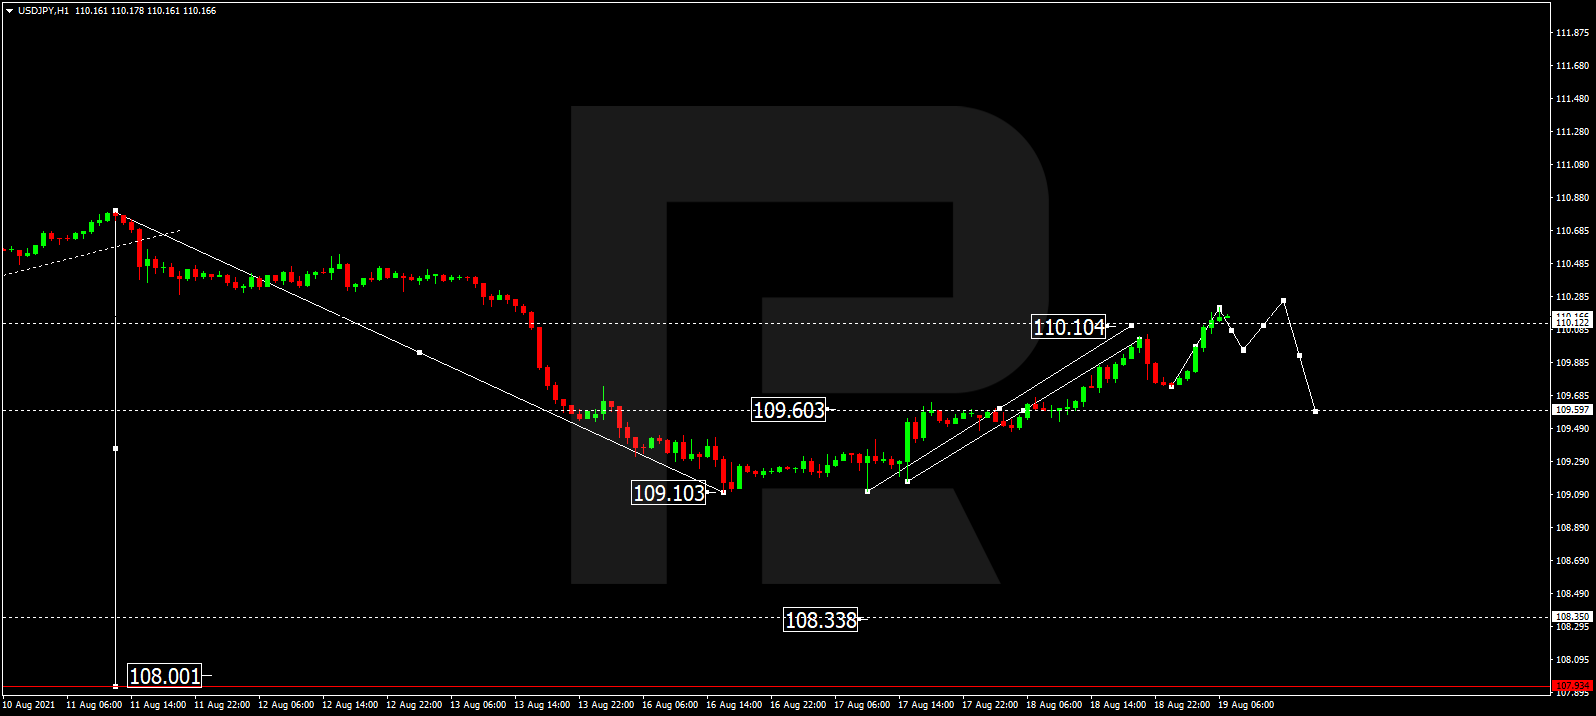
After completing the correction at 110.10, USDJPY is expected to consolidate there. If later the price breaks this range to the downside, the market may start another decline to break 109.33 and then continue falling within the downtrend with the short-term target at 108.50.
USDCHF, “US Dollar vs Swiss Franc”
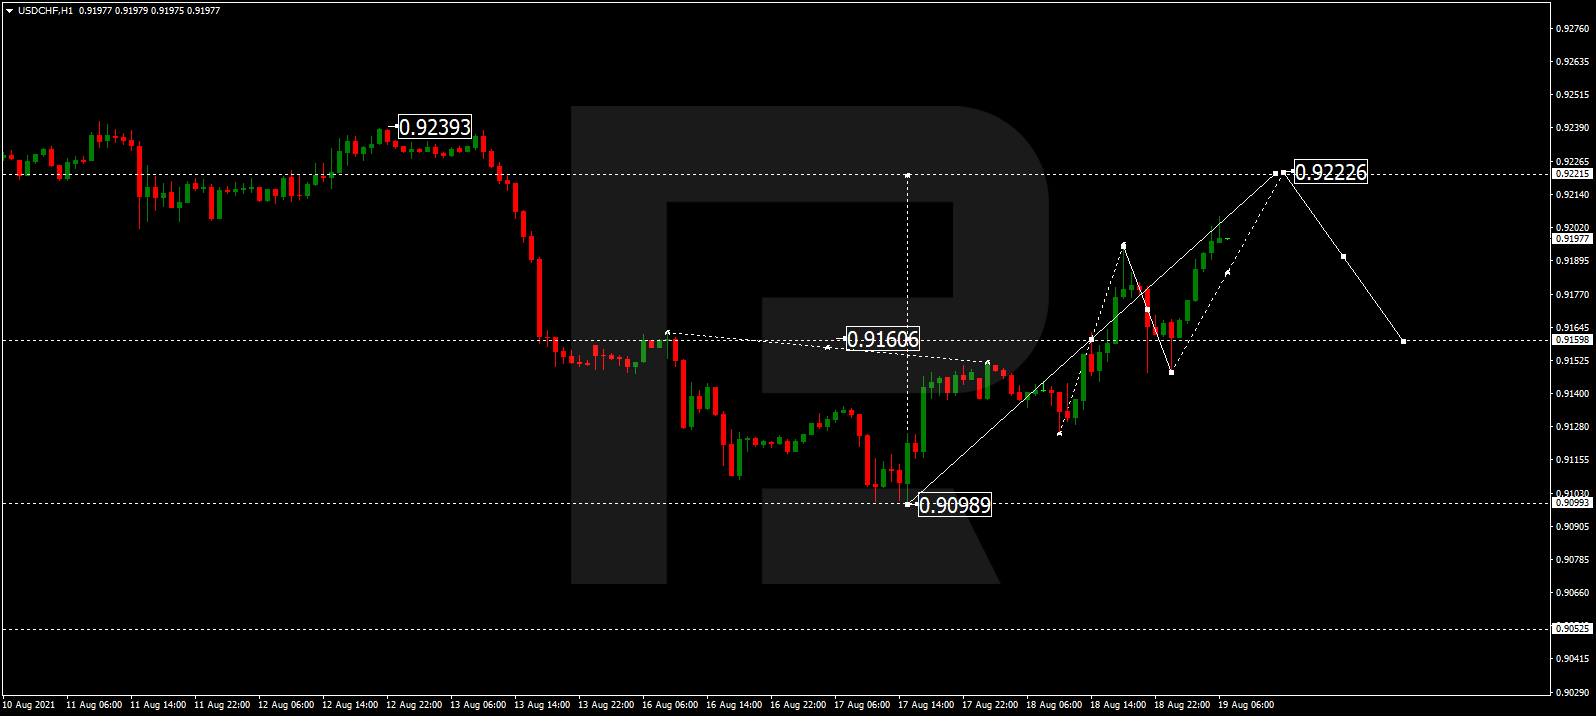
USDCHF is still trading upwards to reach 0.9222. After that, the instrument may correct towards 0.9150 and then start a new growth with the target at 0.9290.
AUDUSD, “Australian Dollar vs US Dollar”
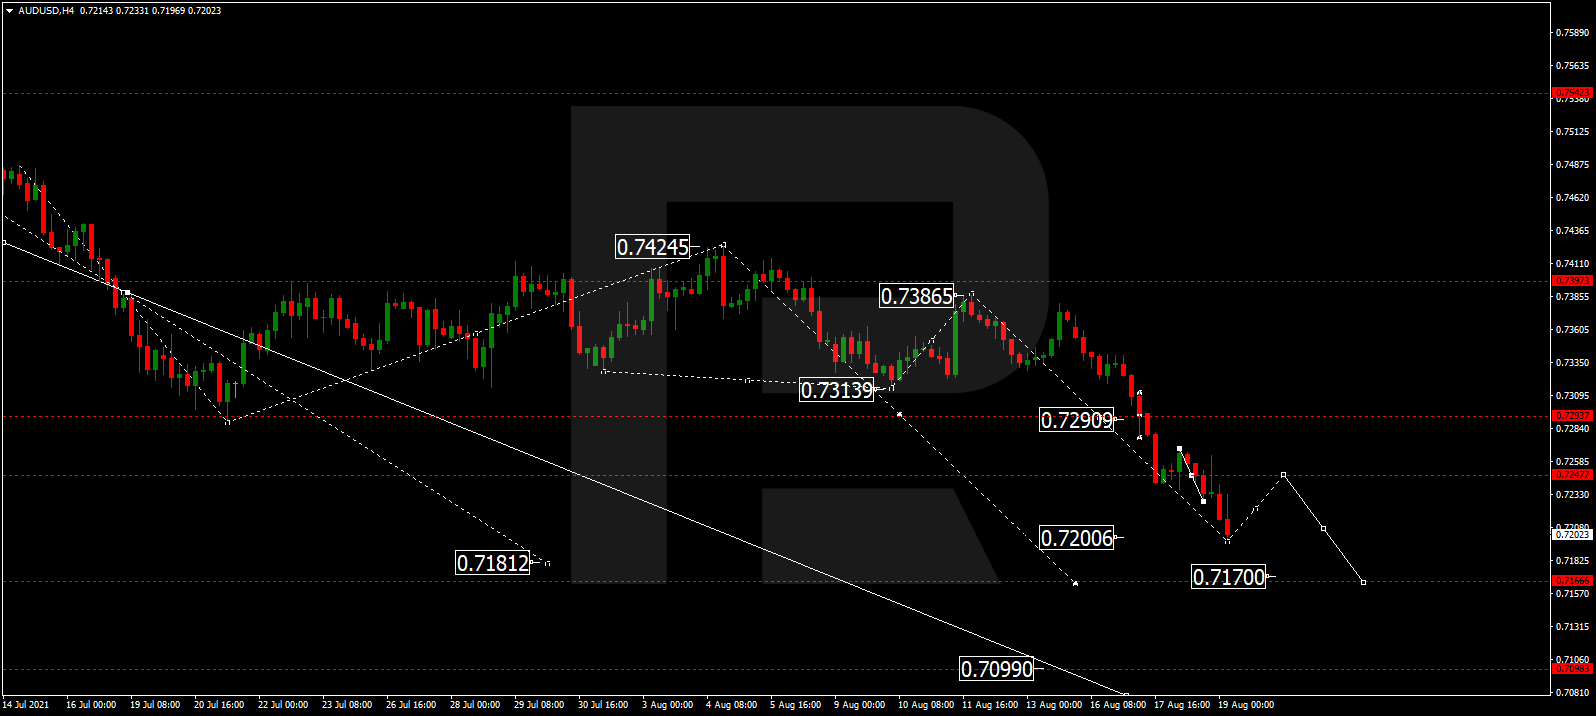
AUDUSD continues falling; by now, it has reached 0.7200. Possibly, today the pair may grow towards 0.7240 and then resume trading within the downtrend with the short-term target at 0.7170.
BRENT
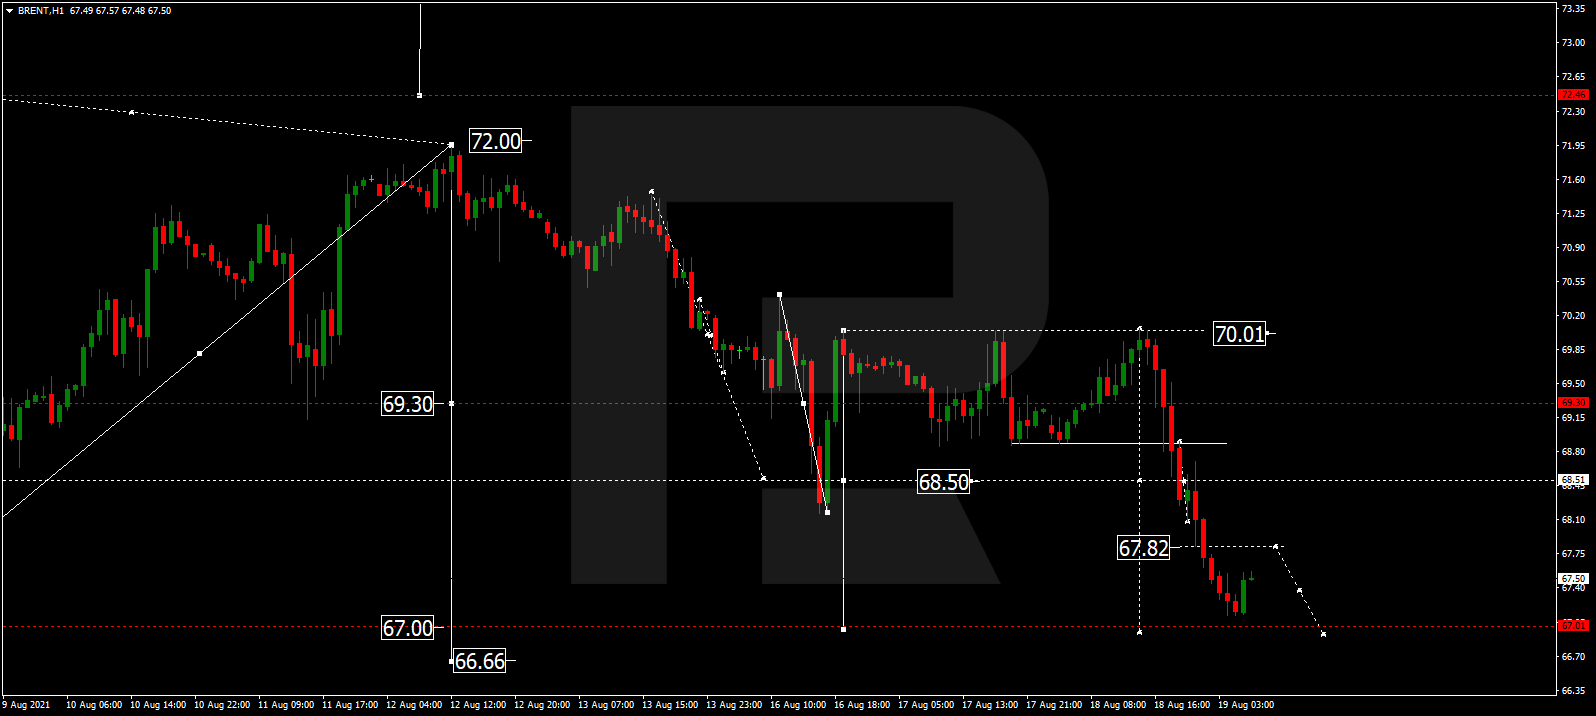
After breaking the consolidation range to the downside, Brent has completed the descending structure at 67.15. Today, the asset may grow towards 67.80 and then resume falling to reach 67.00, at least, to finish this descending wave. After that, the instrument may form a new consolidation range near the lows with a reversal pattern. If later the price breaks this range to the upside, the market may form resume trading upwards with the target at 72.00.
XAUUSD, “Gold vs US Dollar”
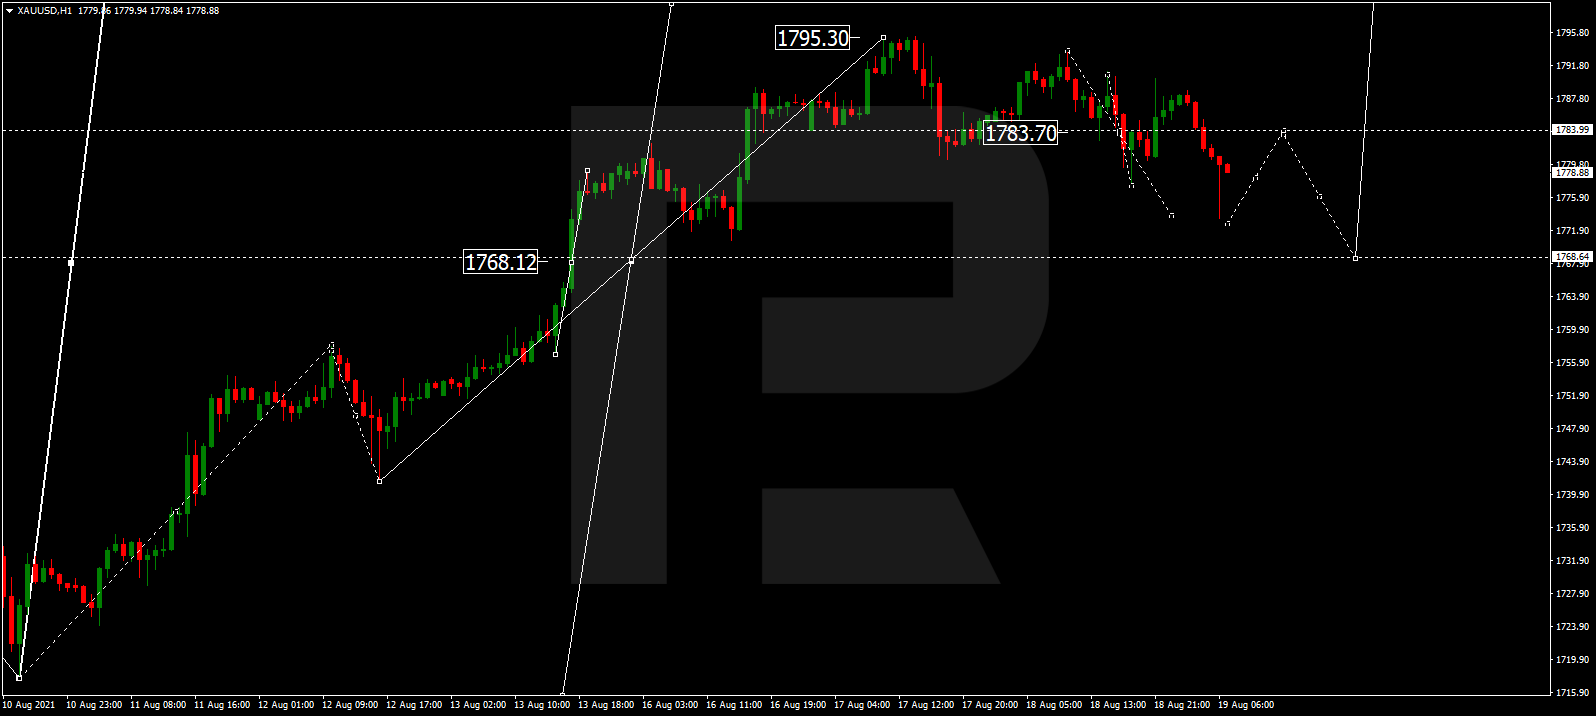
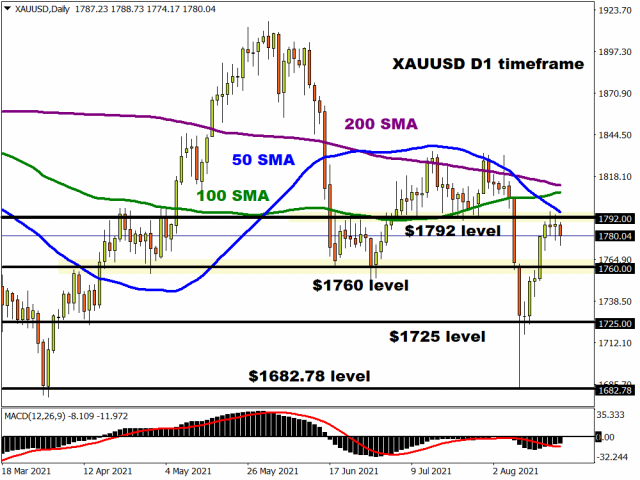
Gold is forming the second descending impulse with the target at 1777.00. Later, the market may grow towards 1784.00 and then resume falling to reach 1768.68. After that, the instrument may form one more ascending structure with the target at 1817.00.
S&P 500
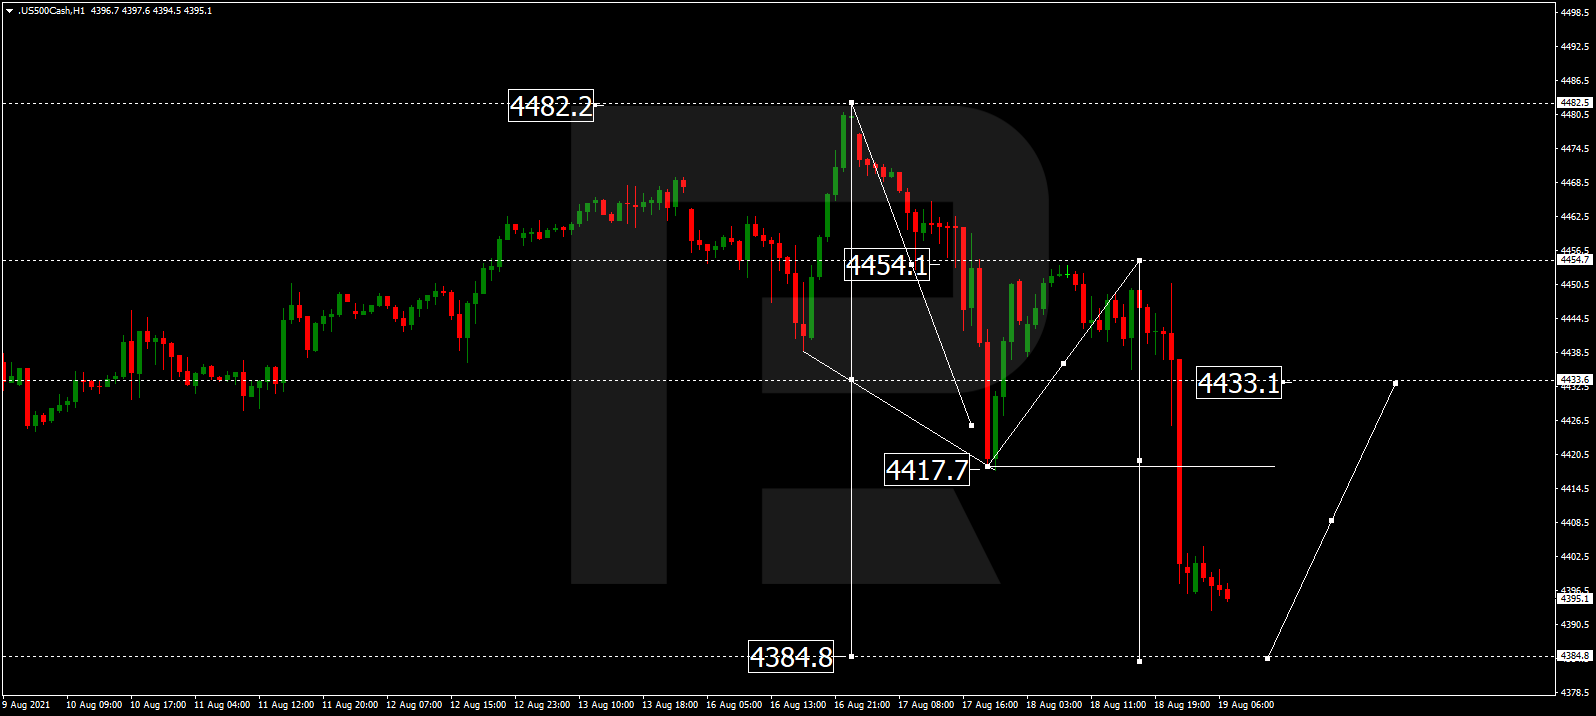
After finishing the ascending structure at 4454.5 and rebounding from this level, the S&P index is falling towards 4384.8 and may later consolidate around this level. If the price breaks this range to the upside, the market may start another correction towards 4433.0.
Attention! Forecasts presented in this section only reflect the author’s private opinion and should not be considered as guidance for trading. RoboForex LP bears no responsibility for trading results based on trading recommendations described in these analytical reviews.
Shortly after completing his graduate degree at Columbia University, Buffett worked for his mentor, investment legend Benjamin Graham, in New York City. When Graham retired from the investment business, Buffett returned to his hometown of Omaha and ran a series of successful hedge funds, known as the Buffett Partnerships.
In the late 1960s Buffett viewed the stock market as overvalued, and he had the integrity to return his investors’ capital, closing his original investment business. During the latter years of his partnership, Buffett took over Berkshire Hathaway, a struggling textile maker. He eventually made it his primary business activity.
Buffett borrowed much of his philosophy from his father, Howard Buffett, a stockbroker and conservative Republican who spent eight years in Congress.
Buffett describes this philosophy as following his “inner scorecard.” It essentially involves living life on his own terms and not worrying about what others think or trying to “keep up with the Joneses.”
Accordingly, Buffett does not fit neatly into any box, exhibiting characteristics for almost everyone to like or dislike. He’s a “card-carrying capitalist” who really does carry a capitalism card in his wallet.
He says he is a Democrat, but over the years he has voted for and donated money to both Democrats and Republicans. He’s not religious, describing himself as agnostic. His late wife and the foundation named after her that he has funded, the Susan Thompson Buffett Foundation, were and are substantial supporters of reproductive rights organizations that favor access to legal abortions.
Warren Buffett spent more than 20 years apparently considering himself to be happily married to Susan, who spent her later years in San Francisco, and another woman named Astrid Menks, who lived in Omaha, at the same time. Following his first wife’s 2004 death, Buffett married Menks in a small and informal ceremony.
Warren Buffett displays his ‘capitalism card’ and discusses his political leanings during this 2020 CNBC interview.
Sharing and caring
With Bill and Melinda French Gates he created The Giving Pledge, through which billionaires commit to giving at least half their fortunes to charity. Buffett is going way beyond that: “More than 99% of my wealth will go to philanthropy during my lifetime or at death,” he pledged.
As of mid-2021, he said he was happy to have gradually given the five foundations he has funded Berkshire Hathaway shares worth a cumulative total of $41 billion, noting: “Society has a use for my money; I don’t.”
Buffett expresses his generosity in other ways as well. For example, he’s one of corporate America’s strongest proponents of women in business. For example, he mentored Tracy Britt Cool for more than a decade as she rose from a financial assistant to CEO of Pampered Chef, a Berkshire subsidiary. In 2019 she started her own private equity firm, modeled after Berkshire, with Buffett’s support.
Buffett began to share his knowledge on the financial markets and the economy in 1977 in his widely readshareholder letters. His annual shareholder meetings, known as “Woodstock for capitalists” is akin to a Disney vacation for thousands of families each year.
Many of his media appearances have also been archived for all to see and learn from. Buffett also voluntarily met with scores of college students for decades about eight times a year for a Q&A session and tour of his businesses.
For years he advocated for the so-called “Buffett Rule,” a minimum 30% tax on those making more than $1 million a year to remedy the problem. Congress rejected it in 2012.
Buffett also acknowledges that the rich pay less tax when they deduct what they give to charities from their taxable income, while questioning whether that is a problem.
“After much observation of super-wealthy families, here’s my recommendation,” Buffett said in an update on his charitable giving: “Leave the children enough so that they can do anything but not enough that they can do nothing.”
The EU consumer price index showed that the inflation rate in Europe increased from 1.9% to 2.2%, which is above the ECB target level of 2%. It is not clear now how the ECB will react to this, especially considering the fact that the ECB’s balance sheet is already over 8 trillion euros and now equals 78.1% of Eurozone GDP versus the Fed’s 36.3% and the Bank of England’s 38.5%.
From a technical point of view, the general trend on the EUR/USD currency pair is bearish. The price is declining within a bearish trend. Under such market conditions, it is better to look for the sell deals from the resistance levels, when there is an initiative from the sellers. Buy trades can be considered only from the support levels and only after the buyers’ initiative. There is divergence that occured in the MACD indicator, so the price may correct a little bit higher.
Alternative scenario: if the price breaks through the 1.1854 resistance level and fixes above, the mid-term uptrend will likely resume.
News feed for 2021.08.19:
– US Philadelphia Fed Manufacturing Index (m/m) at 15:30 (GMT+3);
– US Initial Jobless Claims (w/w) at 15:30 (GMT+3).
The GBP/USD currency pair
Technical indicators of the currency pair:
Prev Open: 1.3734
Prev Close: 1.3751
% chg. over the last day: +0.12%
UK inflation decreased from 2.5% to 2%, which is in line with the Bank of England’s target rate. But analysts tend to believe that the UK inflation rate will increase to 4% this year as the National Statistics does not account for the initial spike in prices in the early stages of last year’s quarantine restrictions in its calculations.
Trading recommendations
Support levels: 1.3714, 1.3676 ,1.3641, 1.3614, 1.3525
The trend of the GBP/USD currency pair is bullish on the hourly timeframe. But the price is close to the priority change level. The MACD indicator is in the negative zone, there are signs of a reversal in the form of divergence. Under such market conditions, traders are better to look for the buy trades from the priority change level. But it is better to enter with confirmation because the sellers’ pressure is very strong.
Alternative scenario: if the price breaks through the 1.3714 support level and consolidates below, the bearish scenario is likely to resume.
There is no news feed for today.
The USD/JPY currency pair
Technical indicators of the currency pair:
Prev Open: 109.55
Prev Close: 109.76
% chg. over the last day: +0.19%
The USD/JPY currency pair is rising amid a strengthening of the dollar index. There is a medium-term trend on the currency pair is expected to be observed, as no significant changes in the monetary policy of Japan are expected in the near future.
Trading recommendations
Support levels: 110.04, 109.43, 109.19, 108.65
Resistance levels: 110.34, 110.66, 110.95, 111.48
The main trend on the USD/JPY currency pair is bullish. The price managed to consolidate above the moving average line. The MACD indicator began to show growth without any signs of a reversal. Under such market conditions, it is better to look for the buy positions from the support level, where the buyers show initiative. Sell positions should be considered only on the lower timeframes from the resistance levels with short targets.
Alternative scenario: if the price falls below 109.19, the uptrend is likely to be broken.
There is no news feed for today.
The USD/CAD currency pair
Technical indicators of the currency pair:
Prev Open: 1.2523
Prev Close: 1.2652
% chg. over the last day: +0.23%
Canada’s annual inflation rate increased to 3.7%, the biggest jump in a decade. Yesterday, oil prices declined slightly and the dollar index rose, as a result, USD/CAD quotations increased by 0.23% and broke through the priority change level.
Trading recommendations
Support levels: 1.2663, 1.2642, 1.2602, 1.2561, 1.2518
Resistance levels: 1.2733, 1.2787, 1.2951
In terms of technical analysis, the trend on the currency pair USD/CAD has changed to bullish. But now the price has deviated strongly from the moving average, the MACD indicator is in the overbought zone with signs of a hidden divergence. Under such market conditions, traders are better to look for sell positions from the resistance levels, after the sellers’ initiative appears. Buy positions should be considered from the support levels after a slight pullback below.
Alternative scenario: if the price breaks through the 1.2562 support level and fixes below, the uptrend is likely to be broken.
This article reflects a personal opinion and should not be interpreted as an investment advice, and/or offer, and/or a persistent request for carrying out financial transactions, and/or a guarantee, and/or a forecast of future events.
The FOMC minutes of the July meeting suggest that the reduction of the QE program may take place as soon as this year. September is just around the corner, so the labor market still needs better data before the central bank begins cutting stimulus measures. Investors’ attention is now focused on the annual economic symposium that will take place next week, where Jerome Powell will disclose the details about the future plans of the Fed. Considering this news, investors began to close their positions partially. As a result, major stock indices began to decline. The S&P 500 index decreased by 1.07%, the Dow Jones lost 1.08%, and the Nasdaq decreased by 0.89%. Major indices are very likely to trade in a wide price range in the next month or two. After the announcement of the beginning of the QE program reduction, a large correction will take place in the market, so investors should rebalance their portfolios.
European stock indices were trading without a single dynamic yesterday. By the time the market closed, the composite index of Stoxx Europe 600 increased by 0.14%, British FTSE 100 decreased by 0.16%, French CAC 40 lost 0.73%. At the same time, German DAX increased by 0.28%, Italian FTSE MIB added 0.5%, Spanish IBEX 35 jumped by 1.18%. The EU consumer price index showed that the inflation rate in Europe increased from 1.9% to 2.2%, above the ECB target level of 2%. It is not clear now how the ECB will react to this, especially considering the fact that the ECB’s balance sheet is already over 8 trillion euros and now equals 78.1% of Eurozone GDP versus the Fed’s 36.3% and the Bank of England’s 38.5%. The UK inflation decreased from 2.5% to 2%, in line with the Bank of England’s target rate. But analysts believe that the UK inflation rate will rise to 4% this year.
Oil prices continue to decline. Quotes are near 3-month lows amid a stronger dollar and continuing concerns about demand forecasts due to the active spread of a new strain of coronavirus. But the supply level is still far behind the demand level, so analysts expect the growth of quotes to $80 per barrel in the mid-term.
The gold remains unchanged. As long as monetary policy remains soft, precious metal prices tend to rise. But as soon as the Federal Reserve announces it will begin cutting the QE program, gold and silver could fall heavily.
The Central Bank of Sri Lanka (CBSL) was the first in Asia to raise interest rates to curb inflationary pressures. The US Department of Transportation said it would limit passenger traffic on some Chinese carriers to 40% for four weeks after the Chinese government imposed similar restrictions on four United Airlines flights. Australia’s unemployment rate fell to 4.6% (previously 4.9%), as reducing the number of working hours and a decrease in the number of people looking for work softened the consequences of quarantine in Sydney.
Main market quotes:
S&P 500 (F) 4,400.27 -47.81 (-1.07%)
Dow Jones 34,960.69 -382.59 (-1.08%)
DAX 15,965.97 +44.02 (+0.28%)
FTSE 100 7,169.32 -11.79 (-0.16%)
USD Index 93.16 +0.03 (+0.03%)
Important events for today:
– Australia Employment Change (m/m) at 04:30 (GMT+3);
– Australia Unemployment Rate (m/m) at 04:30 (GMT+3);
– US Philadelphia Fed Manufacturing Index (m/m) at 15:30 (GMT+3);
– US Initial Jobless Claims (w/w) at 15:30 (GMT+3);
This article reflects a personal opinion and should not be interpreted as an investment advice, and/or offer, and/or a persistent request for carrying out financial transactions, and/or a guarantee, and/or a forecast of future events.
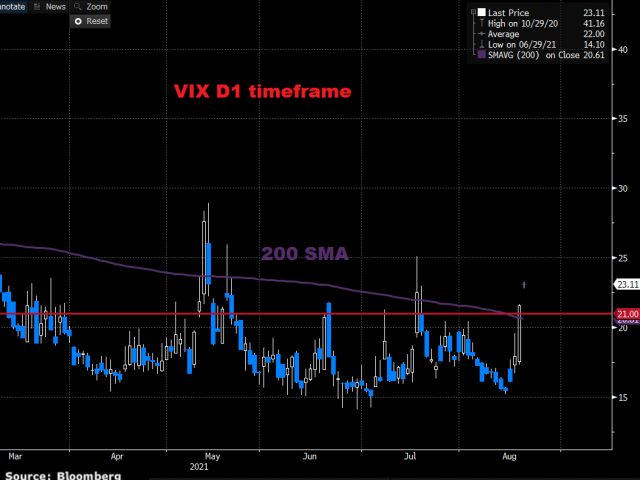
Asian stocks are slumping to their lowest levels this year as a double whammy of worries about global growth and an end to the punchbowl of central bank support drives nervous investors to safety. US equities extended losses for a second day with the major indices down 1%. In turn, Wall Street’s fear gauge, the VIX, has spiked higher above its 200-day moving average and is trading beyond 21. This tells us how worried institutional investors are in the current bull market.
Risk sentiment dour
There aren’t many buyers or bulls out there this morning. While equities are being shunned, commodities are being sold with oil down for a sixth consecutive session and at three-month lows. Gold is pausing after its stupendous climb off the ropes after last week’s flash crash while growth bellwether copper has fallen to a two-month trough.
The broadest measure of Asian shares is currently trading at its lowest level since December with the Hang Seng leading the way down. European markets are catching up with those across the pond while US futures are firmly in the red.
USD on the rise after Fed taper steps
We wrote yesterday about how the FOMC Minutes would offer clues on when the bank might start tapering its bond purchases.
Well, officials confirmed that inflation was now comfortably above their average 2% target and one or two more strong job reports will now be required for “substantial progress” to be made in the economy.
The Fed is still split on timing, but most members judged tapering could start this year. The minutes do not seem to set up a taper as early as next month. But the timetable is well within the consensus on Wall Street. This means with the bumper July payrolls already working their magic (and notably after these minutes), a solid August report could see a taper pathway announced at the September meeting.
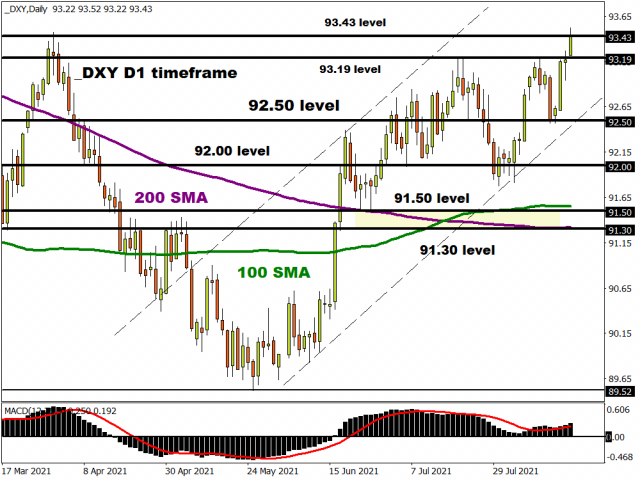
Markets reacted quite modestly to the minutes initially. But this morning, dollar bulls are emboldened and have pushed to new long-term highs. The DXY breached the March top at 93.43 so a strong weekly close is probably needed to really rubber stamp the next leg higher for the greenback. Bulls will aim for last year’s November peak at 94.28, while long-term buyers may have the September high at 94.74. in their sights.
Oil sinking on broader market selloff
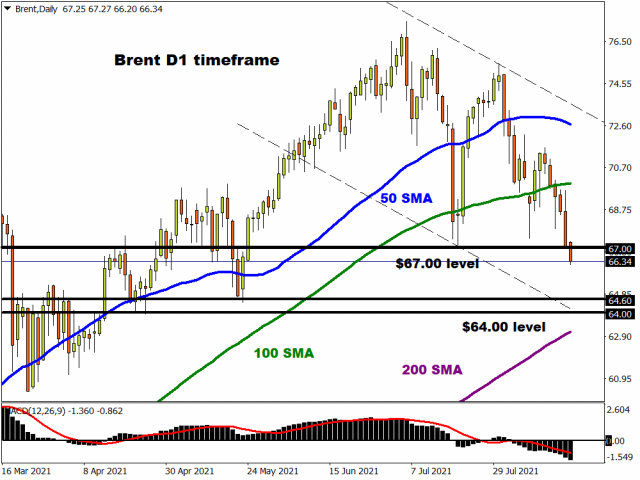
Commodities and oil have come under more pressure this morning with Brent off nearly 1% today and below $67. The spread of the Delta variant is clouding the demand picture. Output data from China also showed the least crude is being processed by Chinese refiners in 14 months. No doubt OPEC+ will be keeping their eye on prices and the demand side. The group recently left its forecasts unchanged and any rollback in the easing of production cuts could spark ire from the US.
Regarding technicals, May lows look like next major support at $64.60 with the 200-day moving average just below $64.
Disclaimer: The content in this article comprises personal opinions and should not be construed as containing personal and/or other investment advice and/or an offer of and/or solicitation for any transactions in financial instruments and/or a guarantee and/or prediction of future performance. ForexTime (FXTM), its affiliates, agents, directors, officers or employees do not guarantee the accuracy, validity, timeliness or completeness, of any information or data made available and assume no liability as to any loss arising from any investment based on the same.
As I dive deeper into the shifting economic trends, driven by both the post-COVID-19 recovery event and the US and global economic actions and policies, we are going to focus on two key aspects of the recent market recovery in this third installment of our research article. Ideally, we are going to focus on price action in various market sectors and how that price action may align with our Dampening Sine Wave process which we pushed to your attention in Part I of this research article.
Global Markets May Start To Roll Over As We Shift Away From Recovery/Reflation
In Part II of this research article, we highlighted how consumers and consumer activity make up more than 70% of the US GDP output. We also suggested that it is common for consumers to react to extreme economic and price functions in a natural form; either optimism for profits, or fear of excessive-high price trends. We’ve seen this happen over and over again throughout history. Over the past few months, we’ve authored numerous articles warning about this type of Excess Phase Peak setup. Here are just a few for you to review:
Now, it appears we start a process of watching the US economic activity roll over past the June/July 2021 peak levels on this example of the Dampening Sine Wave pattern – pushing forward weaker and more normalized economic data throughout the end of 2021 and possibly into 2022. If our research is correct, the current Consumer Sentiment data, falling -13% from the previous Month’s levels, is an early indication that consumers have already pulled away from economic activity over the past 60+ days.
This aligns with a couple of key extreme price highs in the US/Global markets; first Housing Prices have skyrocketed higher over the past 90+ days; next, used car prices have skyrocketed higher over the past 90+ days; lastly, energy costs have skyrocketed higher over the past 90+ days. Additionally, general inflation across a number of consumer items have pushed incredibly higher over the past 6+ months and that is leaving the consumer to react to these pricing pressures the only way they know how – stop buying these items when they are not critical for survival. The answer at times like this is “Toothpaste, Toilet paper, and Top Ramen” – people buy only what is essential and forego almost everything else until price falls back to more reasonable levels.
If the markets follow this example of the Dampening Sine Wave process and we are already past the June/July peak level, then we may have already started the slide downward towards a moderate bottom/support level. We will likely continue to see weaker data related to consumer activity; which includes sales, manufacturing, Real Estate purchases and Auto/Other purchase activities. The consumer has been blindsided by an incredible inflationary trap that has unfolded over the past 5+ months. Everything seems to cost more and more money, while the economy is still limping into recovery and consumers are just trying to make it work.
How The Markets May React To Extended Contracting Economic Trends
As we’ve attempted to illustrate, the markets may be processing a price setup very similar to the Dampening Sine Wave process we’re showing near the top of this article. If this is the case, then the last 9+ months of market trending are excessive in structure and more related to expectations propagated from the extreme deep COVID-19 market contraction and really less about at 40% to 60% increase in economic activity and real earnings.
If that is the case and the market price levels are currently extremely overbought, then a moderate price correction/reversion is very likely. We believe the levels near the November 2020 US elections are likely “fair market value” for the current capabilities of the US/Global economies based on a number of factors (earnings, consumer participation, inflation, global issues/policies). If we are correct, we may see an extended price contraction/reversion event targeting the CYAN support levels we’ve drawn on these charts.
IWM May Fall 24% Before Finding Key Support Near $163.40
Ideally, the key support level near $163.40 appears to be a very solid basing/bottoming price level on this IWM Weekly price chart. Obviously, we may have found some other support levels to pick out on this chart, but the extreme rally phase that started after the November 2020 elections prompted a big upside price gap that aligned with the breakdown gap near the start of the COVID-19 collapse. I believe these gaps may become key targets for any reversion event in the IWM if we continue to see the Dampening Sine Wave process unfold.
TRAN May Target $10,725 If The Market Continue To Contract After Excess Peak
Similar to the IWM, the Transportation Index Weekly Chart below shows a very clear breakdown in price trend as well as an APEXed Flag/Pennant formation. If we understand the Dampening Sine Wave process and why it is important to understand in relationship to future price activity, we can assume any further breakdown in price below the $14,000 level on the TRAN may prompt a move to recent support. I believe that support level exists between $10,725 and $11,400.
Real Estate May See Some Extreme Volatility If Our Research Is Correct
There are two things we want you to understand about the Real Estate sector; first, recent US policy has created a temporary block of foreclosures and evictions over the past 12+ months. This means we don’t really have any understanding of how many homes and other building are distressed or how many borrowers are 90+ days delinquent on their loans. What we do know is that after September 2021, all of these moratoriums are likely to end and the flood-gates will open for banks to begin processing foreclosures and evictions.
I believe the buildup of distressed homes and other buildings could crush the current high price levels of the housing market by as much as 20% to 25%. There has never been a time like this where the entire US housing market has been protected from foreclosures and evictions for more than 12+ months while extreme pricing and inflationary pressures have continued to put a strain on consumers. Because of how these multiple waves of costs have seemed to overcome earning capabilities for consumers, I believe we could see a massive wave of over 1.5+ million homes flood into the market near the end of 2021 and crush the recent rally in Real Estate valuations.
If my research is accurate, a -20% to -21% price decrease in XLRE is possible before support is found near $37.
In Part IV, the final part of this research article, we’ll take a look at some recent economic data to try to pinpoint where we are in the Dampening Sine Wave Process. Stay tuned into the markets and please try to understand that my research is predicated on the process that the post COVID recovery in market price levels functions very similar to the laws of nature and fluid dynamics. We’ll see how this plays out in the long run, but so far it appears my Dampening Sine Wave process may be driving price trends for a while.
Please take a minute to learn about my BAN Trader Pro newsletter service and how it can help you identify and trade better sector setups. My team and I have built this strategy to help us identify the strongest and best trade setups in any market sector. Every day, we deliver these setups to our subscribers along with the BAN Trader Pro system trades. You owe it to yourself to see how simple it is to trade 30% to 40% of the time to generate incredible results.
For those of you who are interested in Options Trading, our resident specialist Neil Szczepanski will be hosting a LIVE two-part Intermediate Course beginning on Wednesday, August 25, 2021. Neil will dive deep into the different strategies and outline what are the best trade setups and what to avoid – helping you to become a more knowledgable, confident, and advanced options trader. To learn more, or to register for the course, kindly click on the following link: INTERMEDIATE OPTIONS MENTORING COURSE.
As something entirely new, check out my initiative URLYstart to learn more about the youth entrepreneurship program I am developing. This is an online program of gamified entrepreneurship designed to introduce and inspire youth to start their own businesses. Click-by-click, each student will be guided from their initial idea, through the startup process all the way to their first sale and beyond. Along the way, our students will learn life lessons such as communication, perseverance, goal setting, teamwork, and more. My team and I are passionate about this project and want to reach as many people as possible!
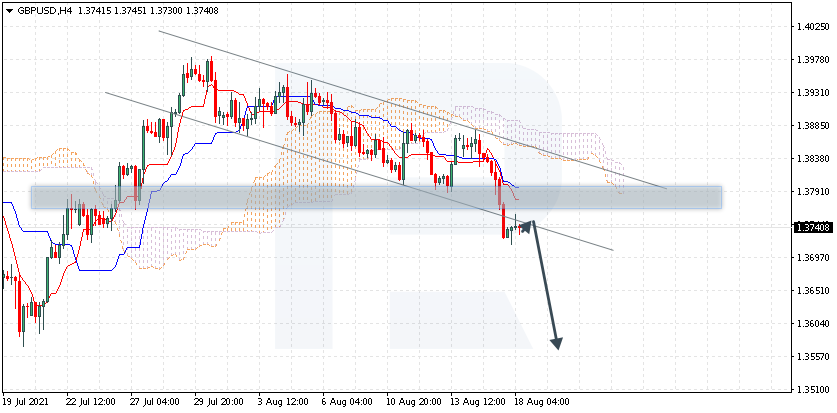
GBPUSD is trading at 1.3780; the instrument is moving below Ichimoku Cloud, thus indicating a descending tendency. The markets could indicate that the price may test Tenkan-Sen and Kijun-Sen at 1.3755 and then resume moving downwards to reach 1.3560. Another signal in favor of a further downtrend will be a rebound from the descending channel’s upside border. However, the bearish scenario may no longer be valid if the price breaks the cloud’s upside border and fixes above 1.3905. In this case, the pair may continue growing towards 1.4005.
NZDJPY, “New Zealand Dollar vs Japanese Yen”
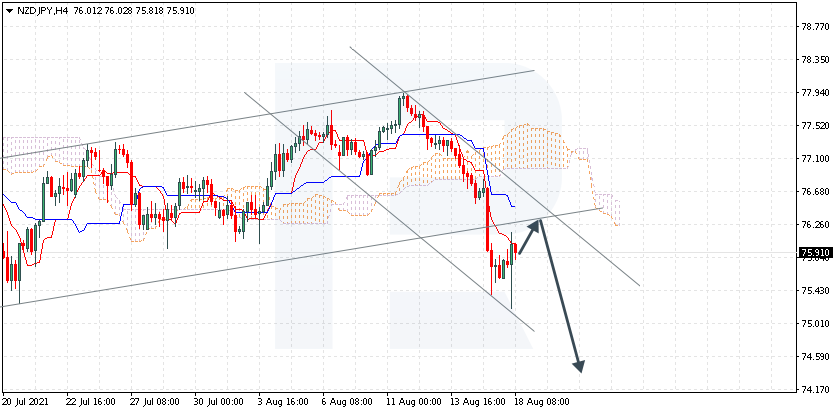
NZDJPY is trading at 75.91; the instrument is moving below Ichimoku Cloud, thus indicating a descending tendency. The markets could indicate that the price may test Tenkan-Sen and Kijun-Sen at 76.25 and then resume moving downwards to reach 74.35. Another signal in favor of a further downtrend will be a rebound from the rising channel’s downside border. However, the bearish scenario may no longer be valid if the price breaks the cloud’s upside border and fixes above 77.65. In this case, the pair may continue growing towards 78.75.
AUDUSD, “Australian Dollar vs US Dollar”
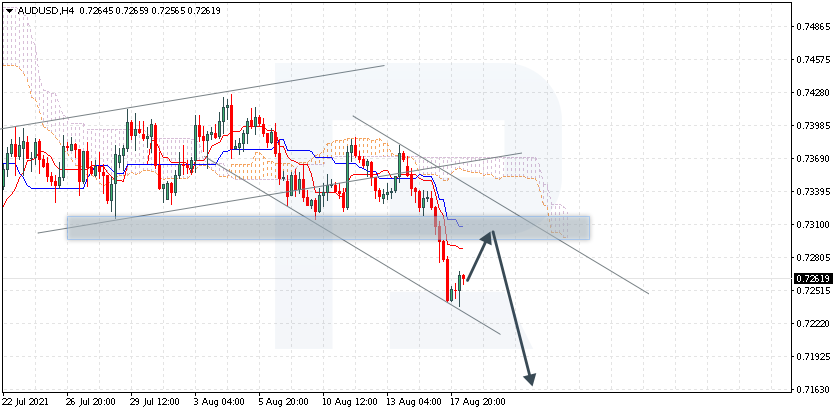
AUDUSD is trading at 0.7261; the instrument is moving below Ichimoku Cloud, thus indicating a descending tendency. The markets could indicate that the price may test Tenkan-Sen and Kijun-Sen at 0.7305 and then resume moving downwards to reach 0.7165. Another signal in favor of a further downtrend will be a rebound from the resistance level. However, the bearish scenario may no longer be valid if the price breaks the cloud’s upside border and fixes above 0.7425. In this case, the pair may continue growing towards 0.7515.
Attention! Forecasts presented in this section only reflect the author’s private opinion and should not be considered as guidance for trading. RoboForex LP bears no responsibility for trading results based on trading recommendations described in these analytical reviews.
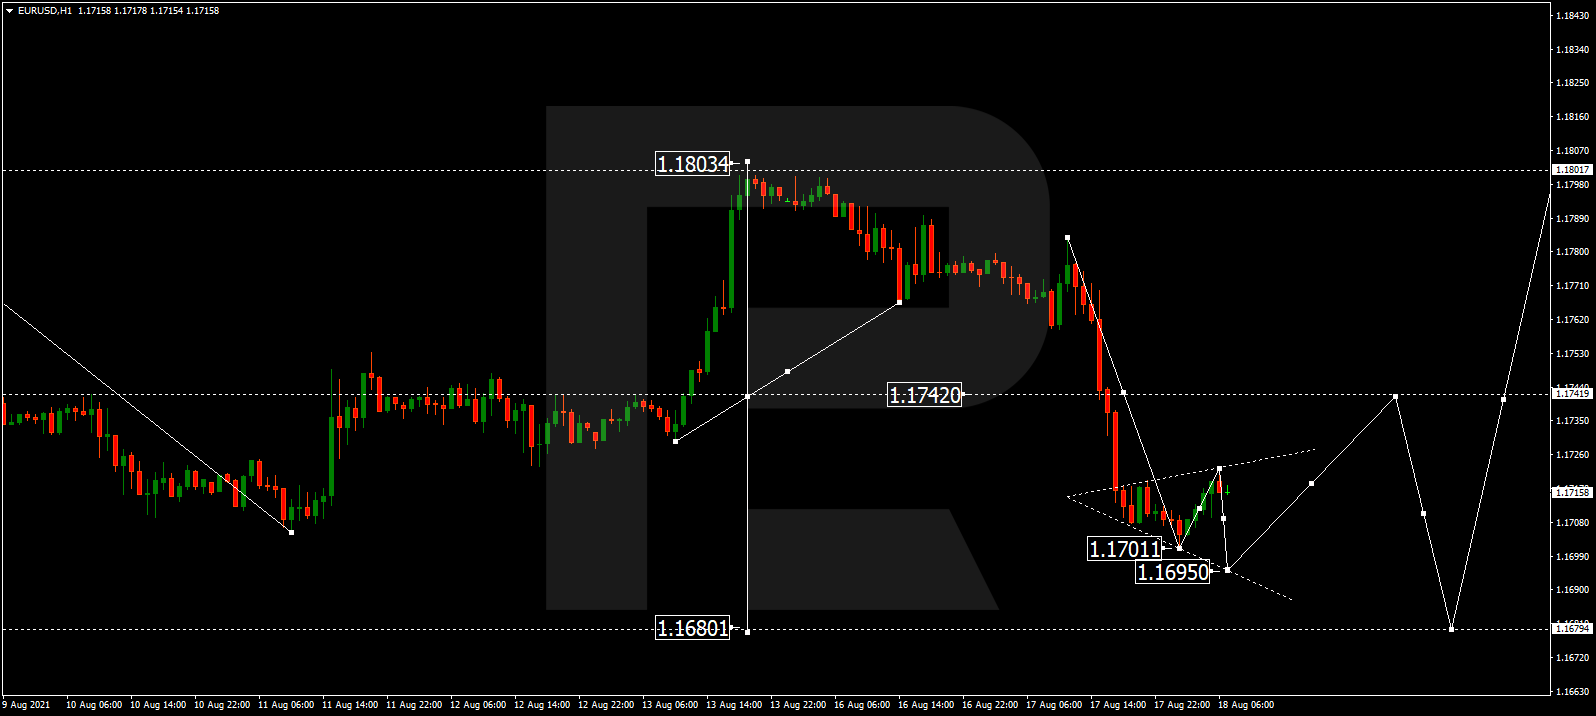
After finishing the descending wave at 1.1710, EURUSD is consolidating around this level. Possibly, today the pair may reach 1.1690 and then form one more ascending structure towards 1.1800. Later, the market may fall to break 1.1650 and then continue trading downwards with the target at 1.1600.
GBPUSD, “Great Britain Pound vs US Dollar”
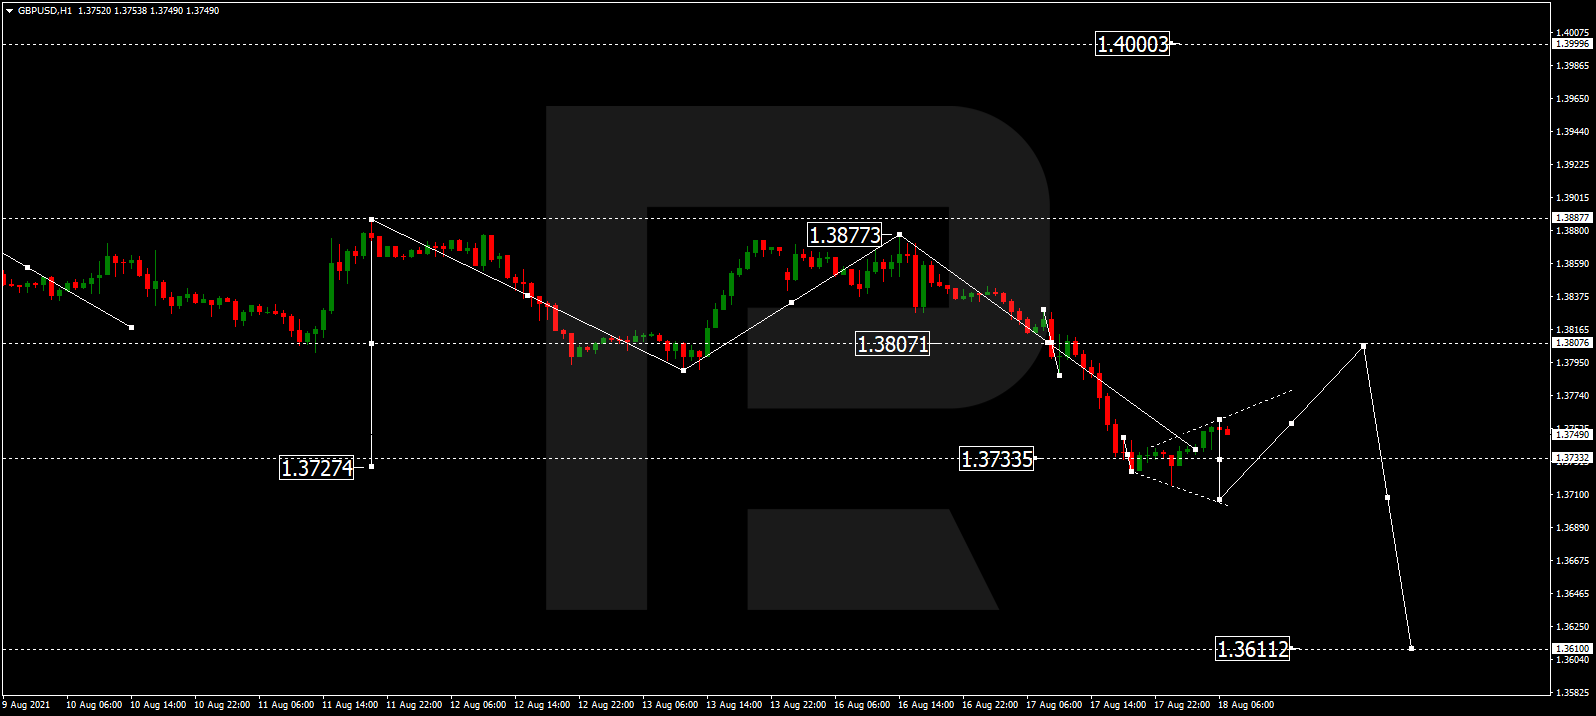
After completing the descending wave at 1.3733, GBPUSD is consolidating. Today, the pair may fall towards 1.3700 and then grow to reach 1.3807, thus forming a new consolidation range between these two levels. If the price breaks this range to the downside, the market may resume falling with the target at 1.3650; if to the upside – form one more ascending structure towards 1.4000 and then start a new decline to reach the above-mentioned target.
USDRUB, “US Dollar vs Russian Ruble”
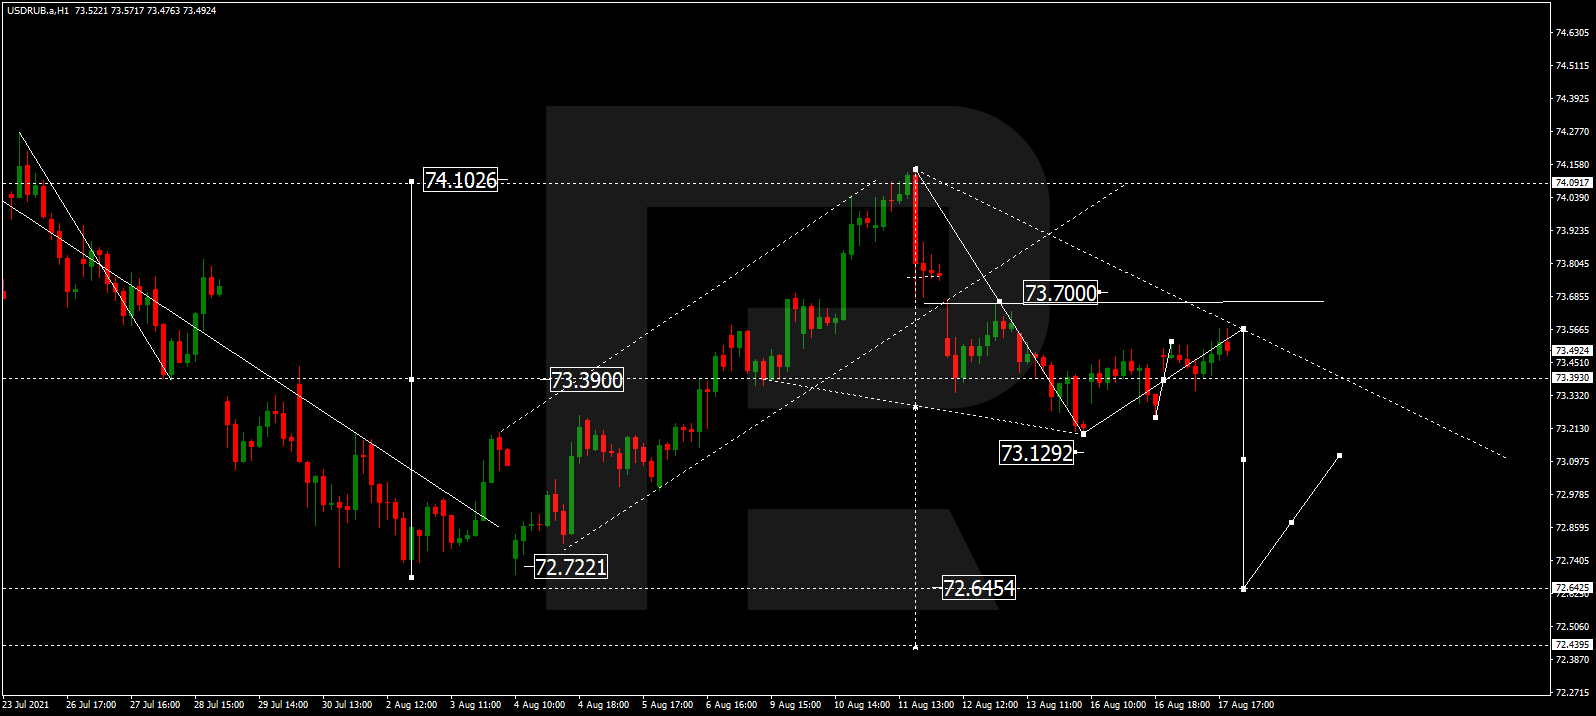
USDRUB is still consolidating around 73.33. Possibly, the pair may correct and expand the range up to 73.63 to test it from below. Later, the market may resume trading downwards to break 73.00 and then continue falling with the target at 72.00.
USDJPY, “US Dollar vs Japanese Yen”
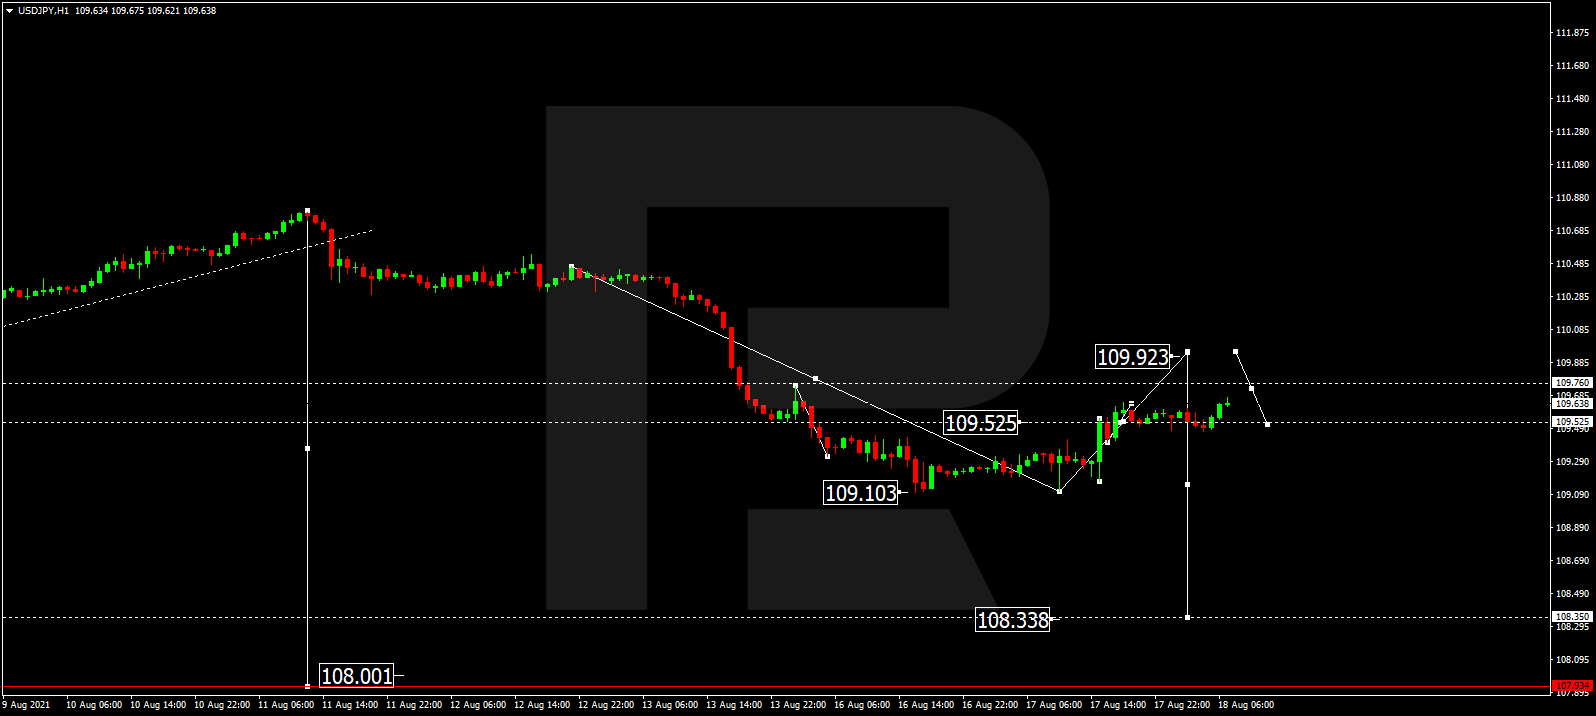
After forming a new consolidation range around 109.50 and breaking it to the upside, USDJPY is expected to choose an alternative scenario and correct towards 109.90. At the same time, the main scenario implies a further downtrend with the first target at 108.00.
USDCHF, “US Dollar vs Swiss Franc”
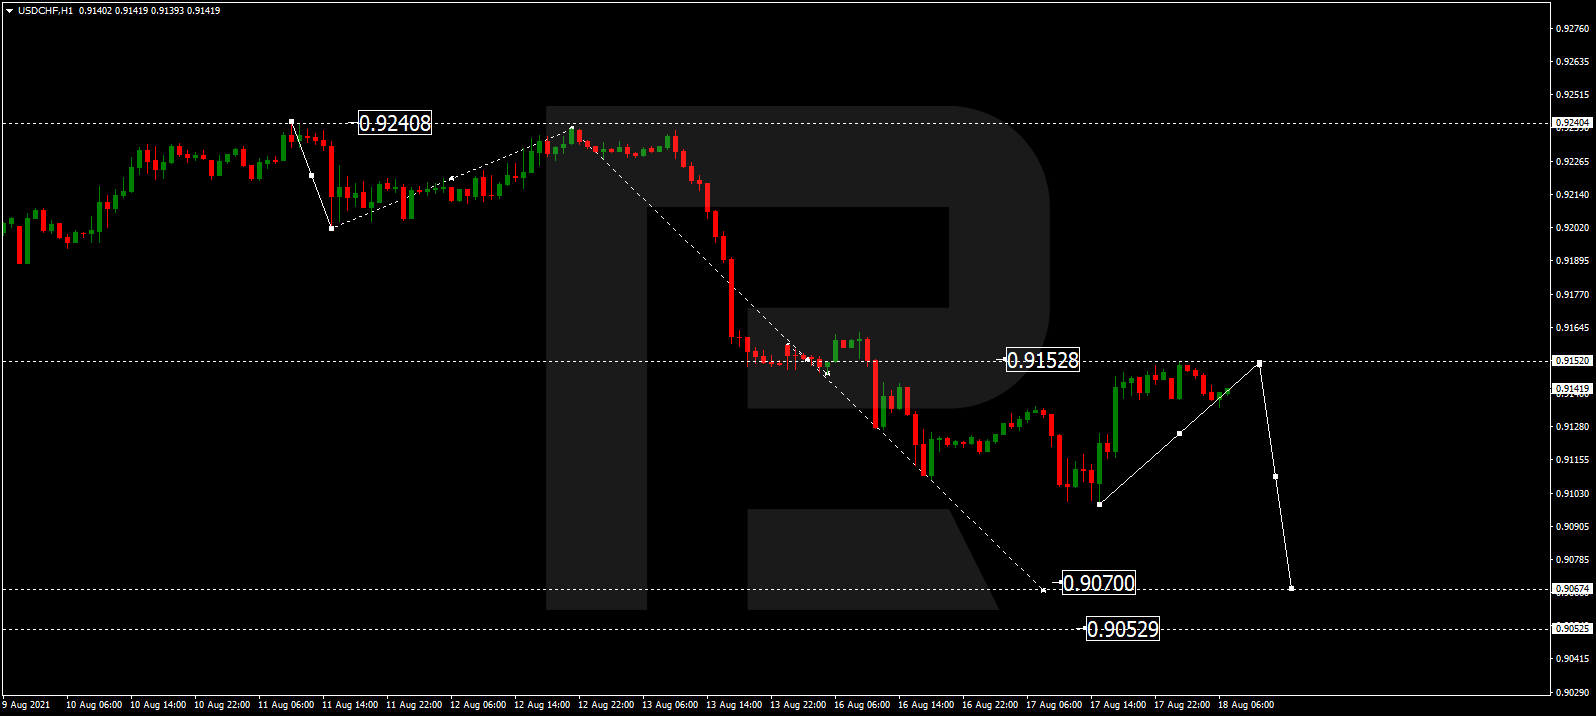
After completing the ascending wave at 0.9151 and rebounding from this level, USDCHF is trading downwards to reach 0.9100. After breaking this level, the instrument may continue falling to reach 0.9070 and then start a new growth to test 0.9100 from below.
AUDUSD, “Australian Dollar vs US Dollar”
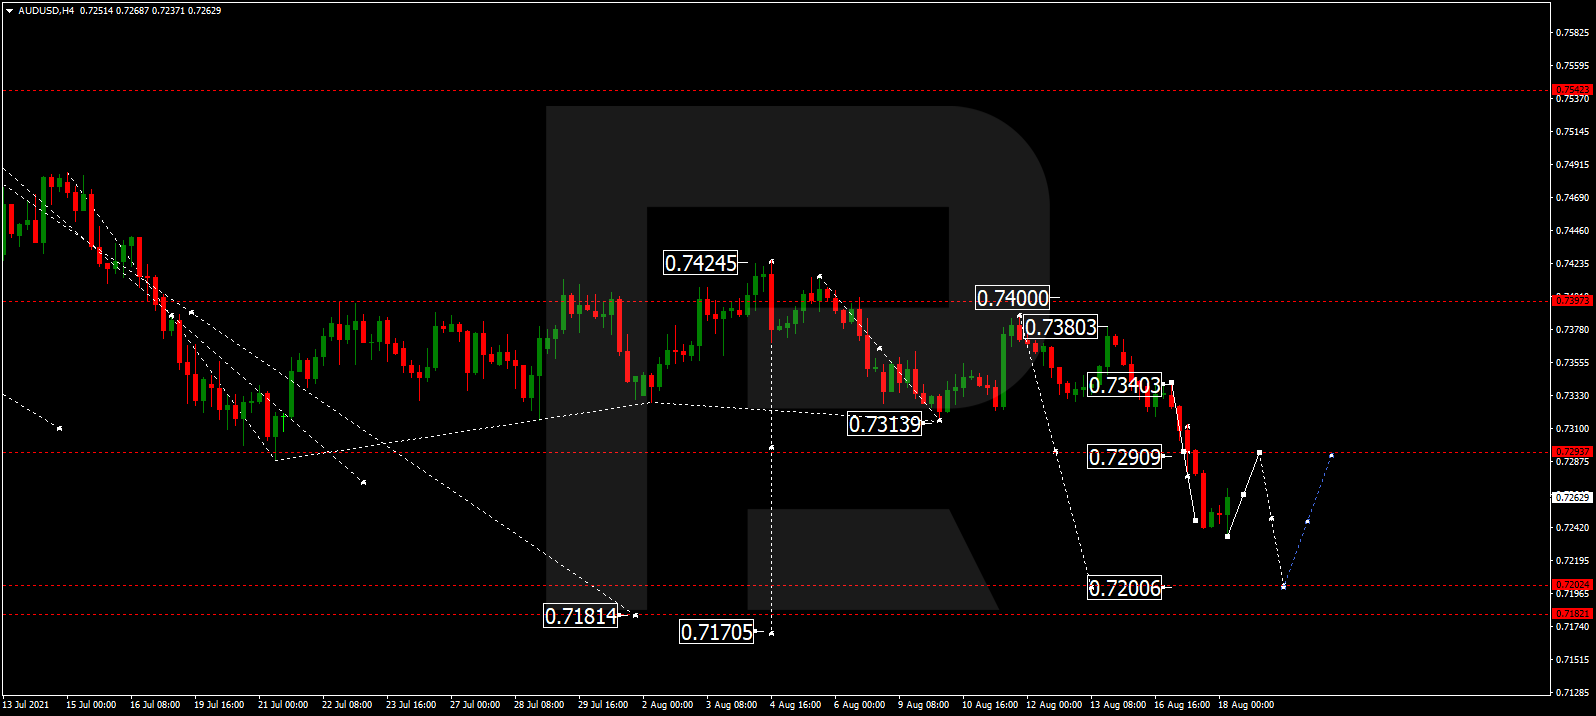
After completing the descending structure at 0.7290 and forming a downside continuation pattern, AUDUSD has reached the short-term target at 0.7237. Possibly, today the pair may return to 0.7290 to test it from below and then resume trading within the downtrend with the target at 0.7200.
BRENT
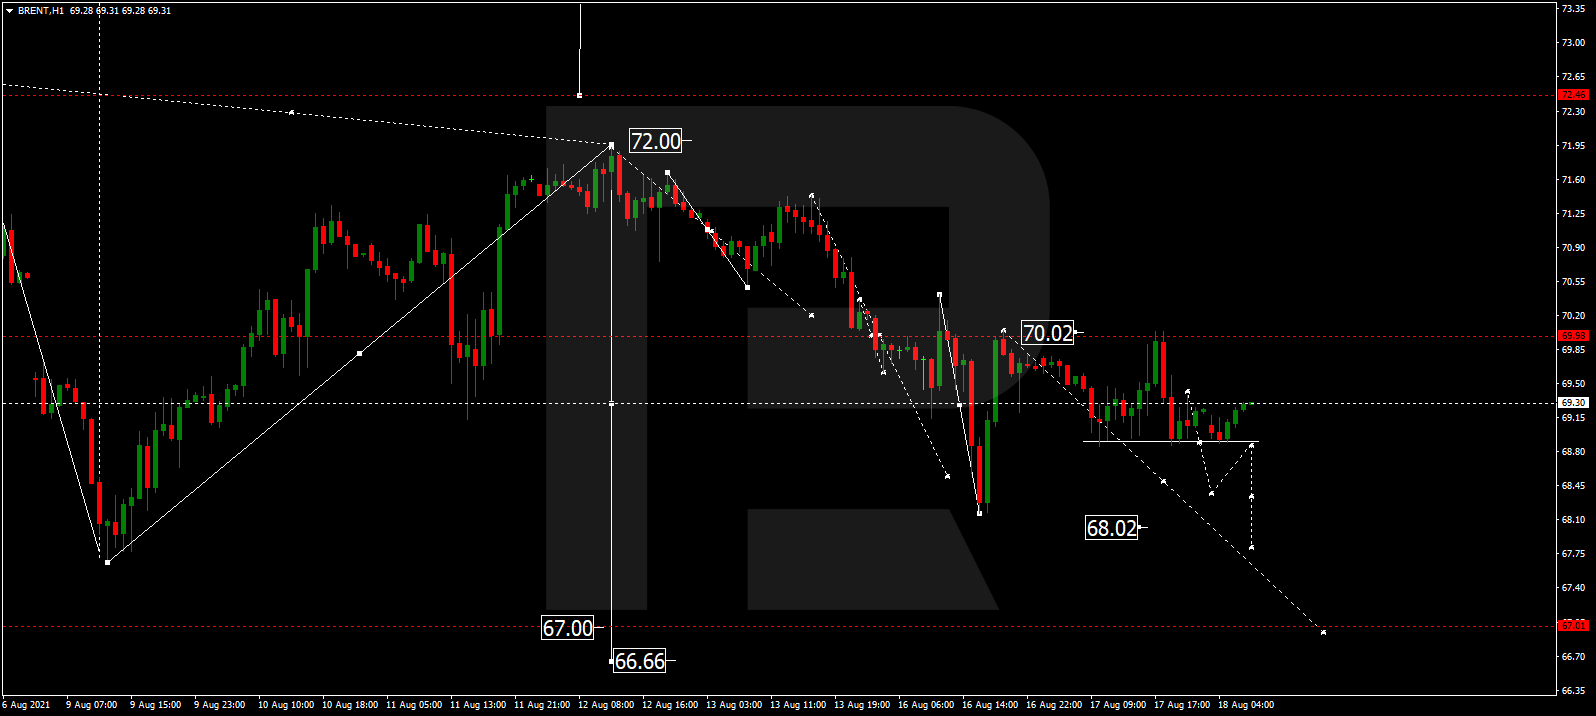
After failing to break 70.00 to the upside, Brent is consolidating in the centre of the range at 69.30. If later the price breaks this range to the downside, the market may resume falling to reach 68.00 or even continue trading downwards to complete this descending wave at 67.00. After that, the instrument may form a reversal pattern to start a new growth with the target at 72.00.
XAUUSD, “Gold vs US Dollar”
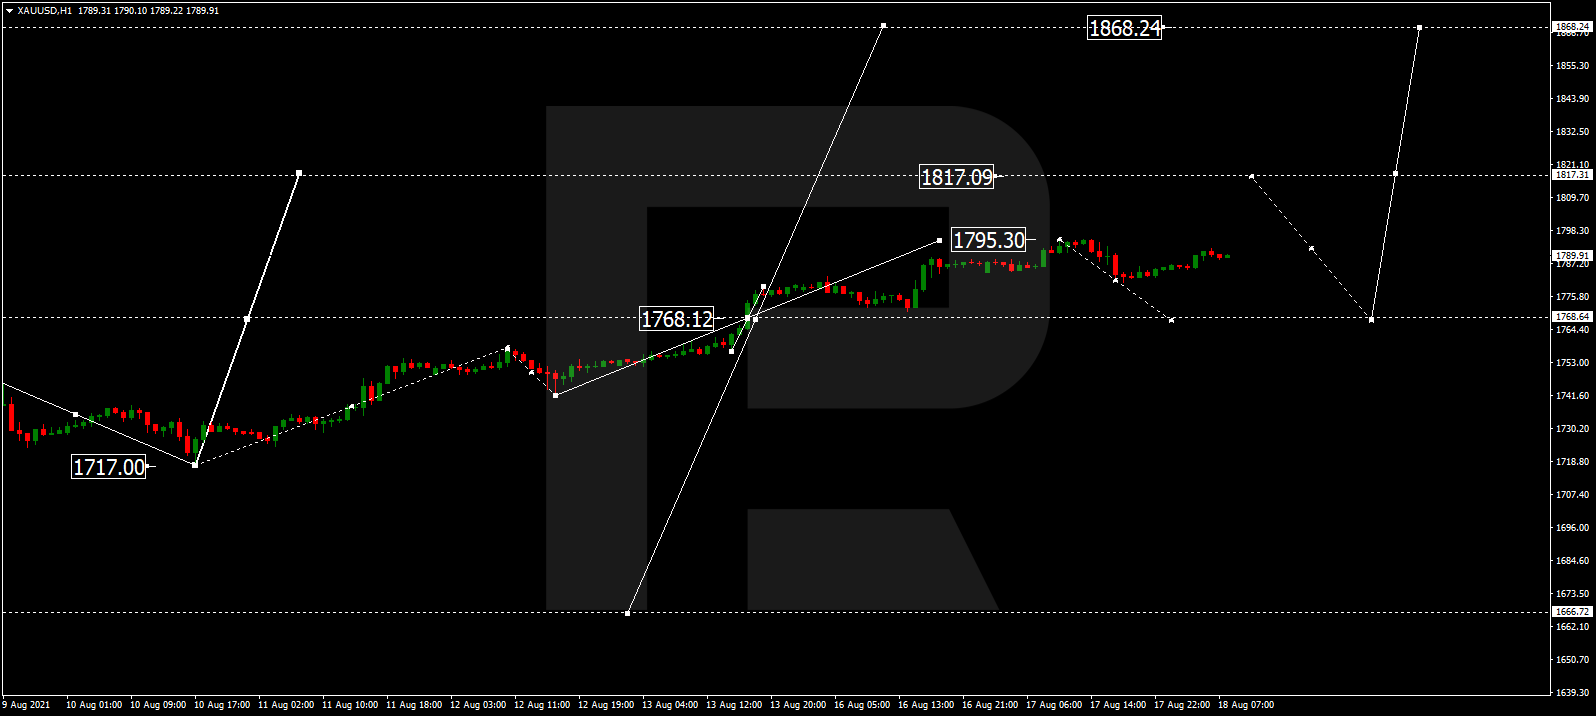
Gold is still forming the second ascending impulse. Possibly, the metal may reach 1817.00 and then correct to test 1768.15 from above. After that, the instrument may form one more ascending structure with the first target at 1868.25.
S&P 500
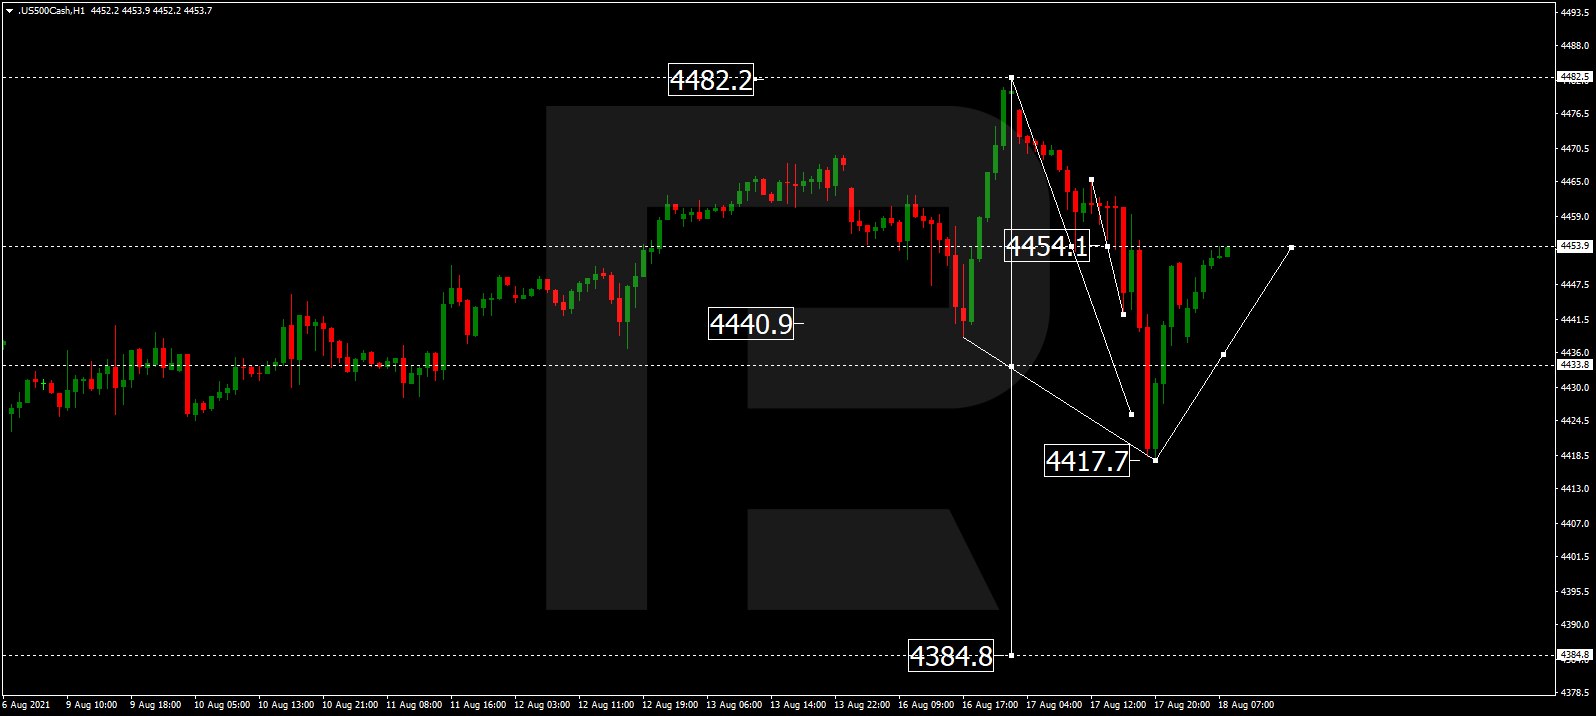
After finishing the descending impulse at 4417.7, the S&P index is correcting towards 4454.1. Possibly, the asset may rebound from the latter level and resume falling to reach 4436.0, thus forming a new consolidation range. If later the price breaks this range to the downside, the market may form a new descending structure with the target at 4384.8; if to the upside – start another growth towards 4480.0.
Attention! Forecasts presented in this section only reflect the author’s private opinion and should not be considered as guidance for trading. RoboForex LP bears no responsibility for trading results based on trading recommendations described in these analytical reviews.












 Article by