Intraday Market Analysis – USD Keeps High Ground

By Orbex

USDCHF tests key resistance

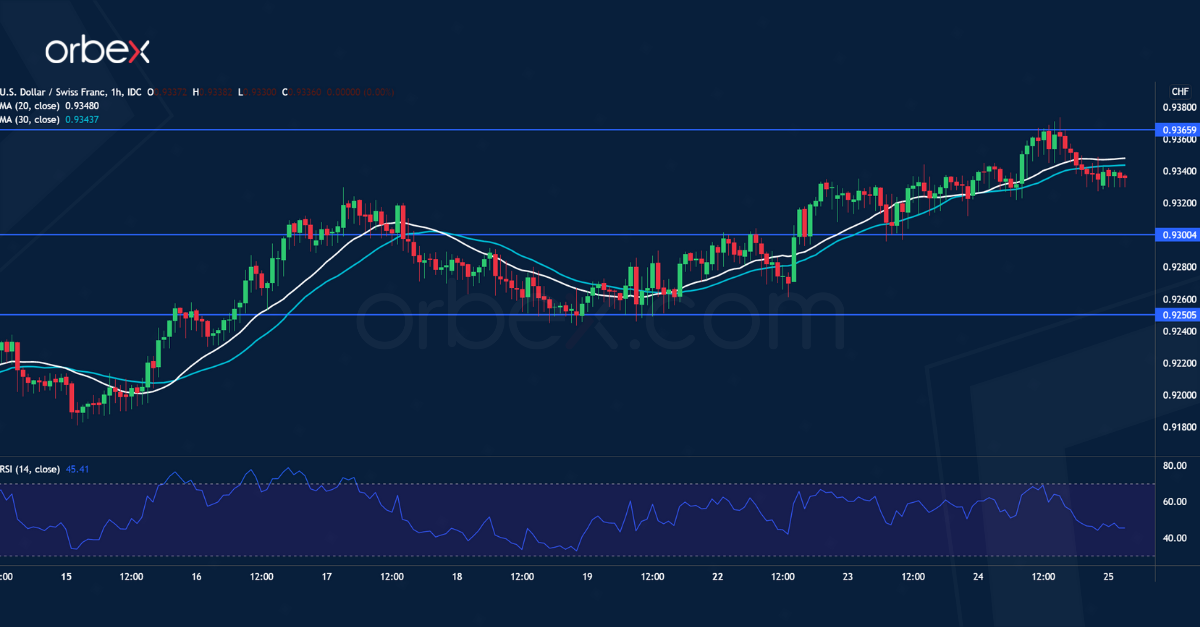
USDCHF

The US dollar consolidates gains after the FOMC minutes signaled for rate hikes if inflation stays high. A bullish MA cross on the daily chart is strong evidence for an upbeat sentiment.

The pair is testing last September’s peak at 0.9365. A breakout would flush the short interest out and attract momentum buyers.

An extended rally may carry the price to April’s high at 0.9470, a major resistance from the daily chart. An overbought RSI may cause a brief pullback. 0.9300 from the previous consolidation would be a new support.

EURGBP remains under pressure

EURGBP

The euro struggles due to fears of a new round of covid lockdowns across the continent.

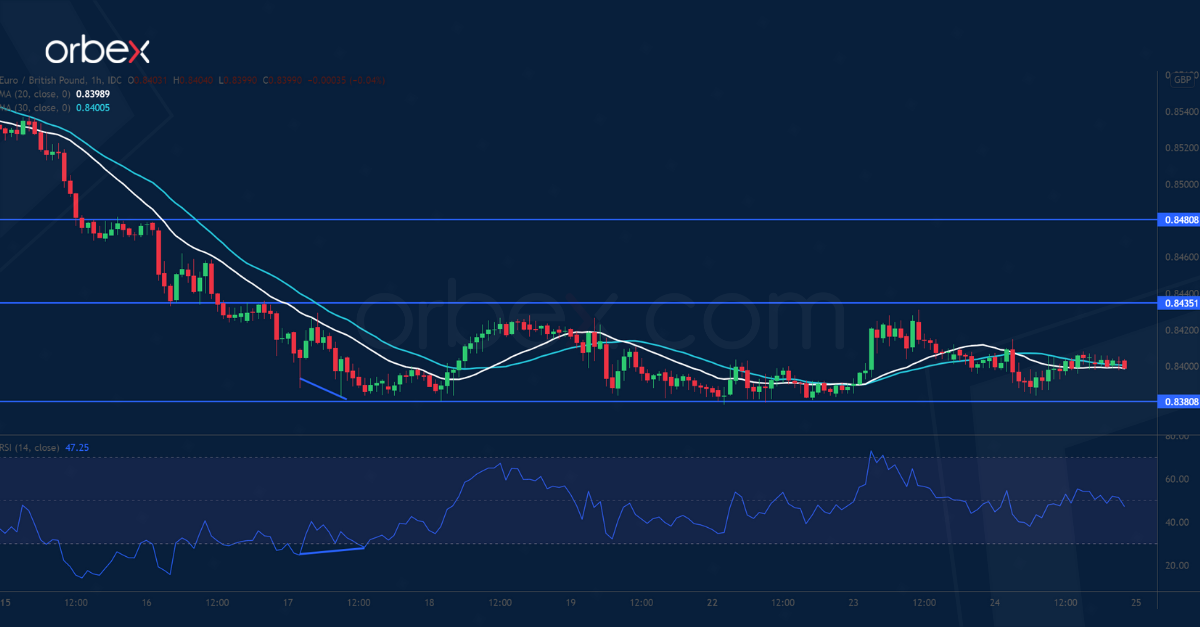
The fall below the daily support at 0.8400 has put the few buyers under pressure. A faded rebound suggests that the bears are still in control of the direction.

The RSI’s bullish divergence points to a deceleration in the sell-off. However, in the absence of confirmation, the current sideways action could be a mere consolidation. Buyers may remain cautious unless offers around 0.8435 get lifted. A break below 0.8380 may send the pair to 0.8300.

XAUUSD lacks support

XAUUSD

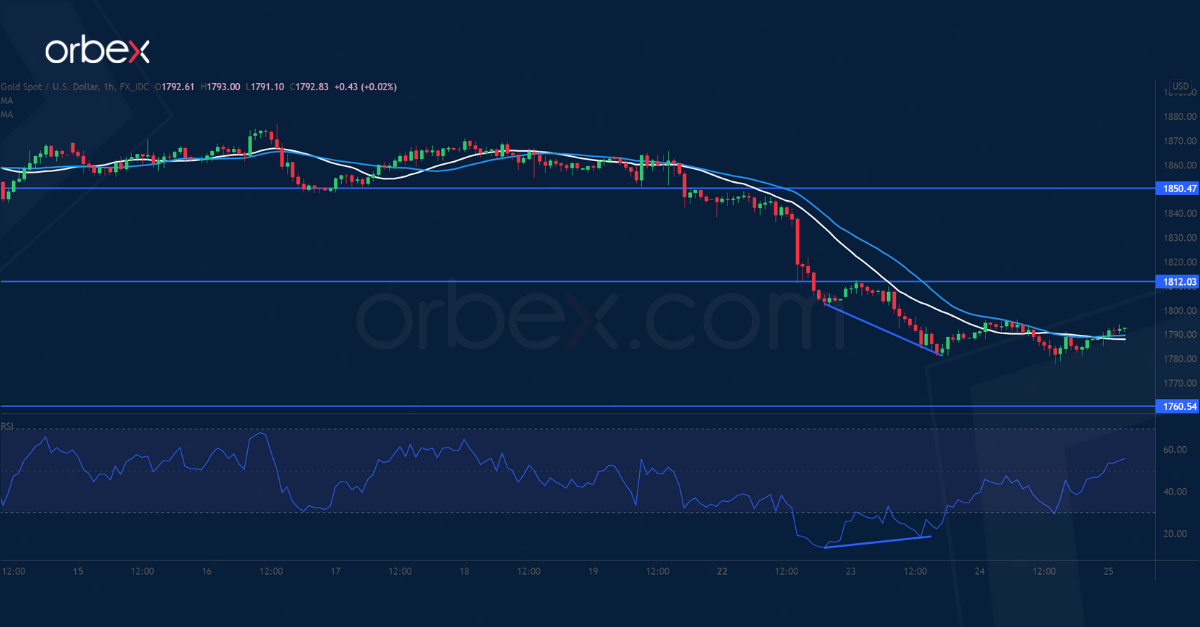
Gold extended losses as expectations for higher interest rates grew. The break below 1823 has forced leveraged buyers to liquidate their positions, stirring up volatility in the process.

The price is heading towards the origin of the November rally at 1760. A bullish RSI divergence shows that the downward pressure could be waning.

As the RSI dips into the oversold territory, buyers have started to bid again from the demand area. 1812 is a key hurdle to lift or the metal could plunge to September’s low at 1730.


Orbex-LogoArticle by Orbex

Orbex is a fully licensed broker that was established in 2011. Founded with a mission to serve its traders responsibly and provides traders with access to the world’s largest and most liquid financial markets. www.orbex.com

Crypto inclusion in Biden’s infrastructure bill is misguided : deVere CEO

By George Prior

– Cryptocurrency exchanges in the U.S. will be shunned by investors and the Biden administration will force the multi-trillion dollar sector of the future of money away from America, affirms the boss of one of the world’s largest independent financial advisory, asset management and fintech organisations.

The comments from deVere Group’s CEO and founder Nigel Green follow the U.S. government signing the $1.2 trillion infrastructure bill into law, weighing on the shares of publicly owned, U.S.-based exchanges.

Why? Because within the infrastructure spending package is language increasing the tax reporting requirements for cryptocurrency transactions. This has been fiercely opposed by the digital currency sector and investors.

Mr Green says: “We’ve seen the U.S. infrastructure bill get signed, which initiated a sell-off from traders who are worried about increasingly levels of regulation and taxation.

“The inclusion of the extra reporting clauses for crypto is a huge miscalculation from the Biden administration.

“With additional reporting, which is onerous and costly, many investors will not choose a U.S.-based cryptocurrency exchange. They will simply go somewhere else; to another exchange, based away from the over-reach of the U.S. authorities.”

He continues: “And as such, this extra burden will likely move a large part of the growing cryptocurrency industry itself out of the United States.  This is a sector now worth more than $3 trillion – and it can only be expected to expand exponentially.”

Despite recent price drops in Bitcoin, after the fresh all-time high, Mr Green believes that inflation, amongst other factors, will help keep driving prices higher for the short to medium term.

“It’s a global issue as businesses have been raising prices as supply chain bottlenecks and a shortage of qualified workers push up costs.

“And it’s one that is likely to last until at least the beginning of the second quarter of 2022, when pressures should start to ease.

“Against this backdrop, and amid some peaks and troughs along the way as markets never move in a straight line with traders taking profit, we can expect to see the price of Bitcoin and other major cryptocurrencies continue their upwards trajectory.

“Bitcoin is widely regarded as a shield against inflation mainly because of its limited supply, which is not influenced by its price.”

This ‘inflation shield’, says the deVere CEO, will bring to the crypto market growing investment from major institutional investors, bringing with them capital, expertise and reputational pull – and further driving up prices.

The deVere boss concludes: “History will show that the inclusion of additional reporting for crypto transactions in the U.S. infrastructure bill was a huge error.

“It will have the effect of investors choosing non U.S.-based exchanges and moving much of the crypto sector – the industry of the future of money – out of America.”

About:

deVere Group is one of the world’s largest independent advisors of specialist global financial solutions to international, local mass affluent, and high-net-worth clients.  It has a network of more than 70 offices across the world, over 80,000 clients and $12bn under advisement.

How Many Indicators Should You Use When Trading Forex?

By Orbex

– When beginner traders start exploring a good trading platform, they probably are a bit daunted by all the different indicators that are available. The most popular trading platform MT4 comes with a standard several dozen.

How do you know which ones to use? Are they all worth it? Do you really need to know all of them and what they do?

The thing is, picking the right indicators is part of the art of becoming a trader. Unfortunately for beginner traders, that makes it harder for them to get advice on how to pick the best set of indicators.

Some traders use a lot, some use very few. Analysts, who like having as much information as possible, often recommend using several indicators at once. Brokers who want to help their clients make better decisions will frequently say you should use several indicators, and not rely on just one.

And they are right, for good reason

The thing is, it’s quite possible to have too many indicators. In turn, this can lead to a thing that many traders call “analysis paralysis”.

The point of indicators is to help cut through the market “noise”, so you pick the right points to trade. If you have too many indicators, they start to become noise themselves and make it harder for you to trade.

Part of the theory of using several indicators at once is to find confirmation on signals. If one indicator gives you a signal, and another doesn’t, then that trade is likely to be less sure than if two different indicators are giving the same signal. If you have three indicators giving you the same signal, then it’s even stronger.

Too many instructions

On the other hand, it is less likely for three independent indicators to give you an identical signal. That said, the likelihood of getting the same signal keeps dropping the more indicators you add. In fact, if you have a dozen indicators that you’re waiting for all of them to give you the same signal… well, that just might not ever happen. And you won’t actually get any trading done.

So, it comes back to risk management, which really is the core of successful trading. If you use more indicators, then you are likely to get stronger signals, but less often. That is, assuming these are independent indicators and not indicators that are based on the same mechanic, like different moving averages.

If you want to trade more often, then you might want to use fewer indicators. However, that means your signals are weaker, and your trades are less likely to work out.

It’s all about balance

In the end, the number of indicators you should use is a function of your strategy.

A lot of people will try to tell you to use more or fewer indicators. And there are plenty who want to sell you this awesome indicator that always works (but they need to sell it to you for some reason because they aren’t using it to become bazillionaires themselves).

The reality is that you should use indicators depending on your risk profile and trading style.

There isn’t a “right” or “wrong” number, so you shouldn’t let someone deter you based simply on how you don’t use “enough” indicators. You might instead adjust your risk profile to improve your profitability. Alternatively, having more indicators than someone else might work better for you because you take longer-term trades which offer better risk ratios.

Just be aware that when we analysts say you should use several indicators, it usually just means that we want you to trade safely. It doesn’t necessarily mean that you should go out and get an encyclopedic knowledge of all the indicators.


Orbex-LogoArticle by Orbex

Orbex is a fully licensed broker that was established in 2011. Founded with a mission to serve its traders responsibly and provides traders with access to the world’s largest and most liquid financial markets. www.orbex.com

Japanese Candlesticks Analysis 24.11.2021 (EURUSD, USDJPY, EURGBP)

Article By RoboForex.com

EURUSD, “Euro vs US Dollar”

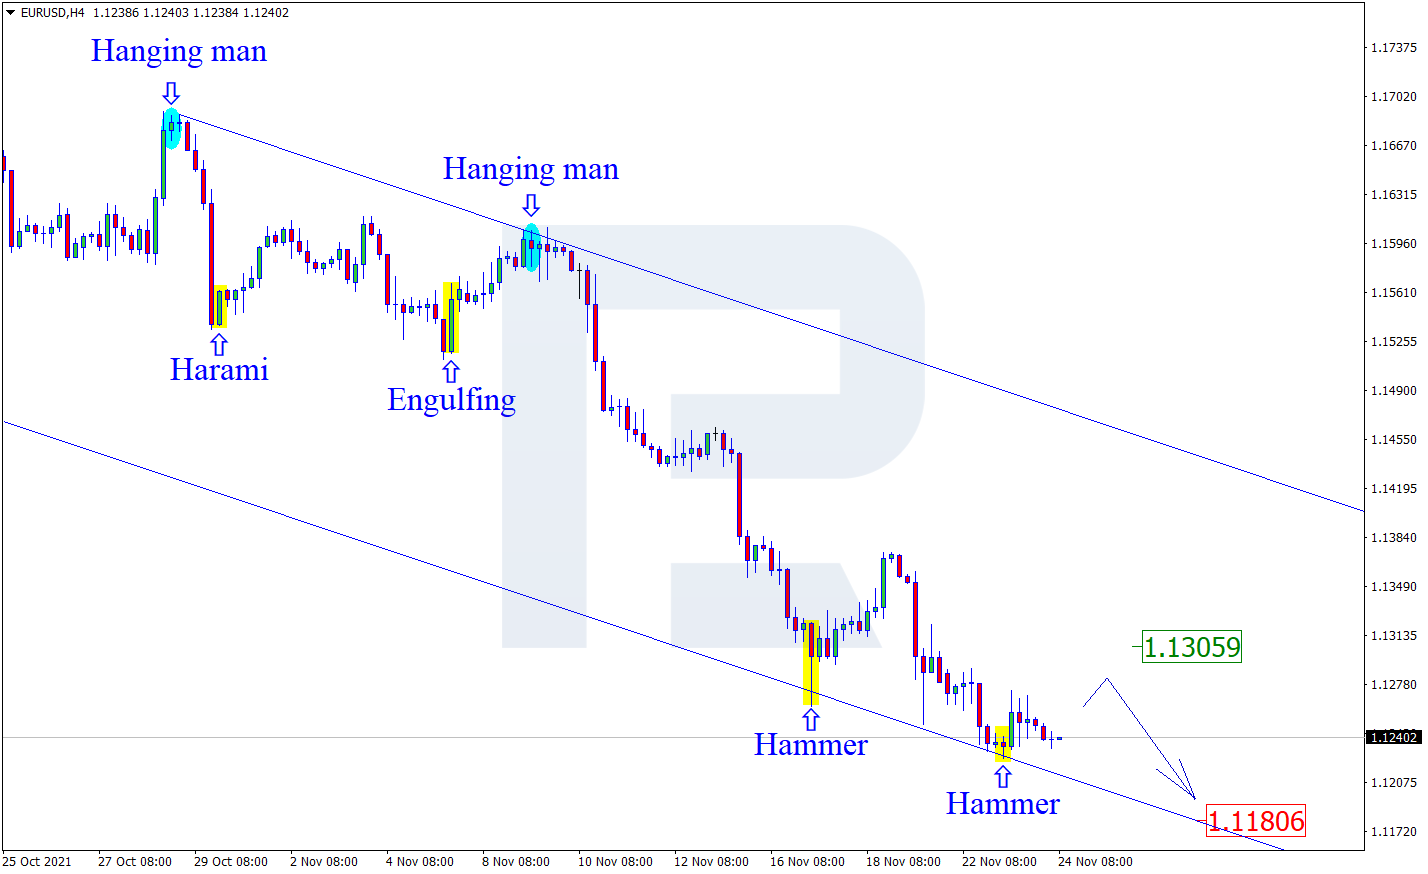
As we can see in the H4 chart, the asset has formed several reversal patterns, including Hammer and Doji, close to the support level. At the moment, EURUSD may reverse and start a new correctional impulse. In this case, the upside correctional target may be at 1.1305. Later, the market may rebound from the resistance area and resume the descending tendency. However, an alternative scenario implies that the price may continue falling to reach 1.1180 without correcting towards the resistance area.

EURUSD
Risk Warning: the result of previous trading operations do not guarantee the same results in the future

USDJPY, “US Dollar vs Japanese Yen”

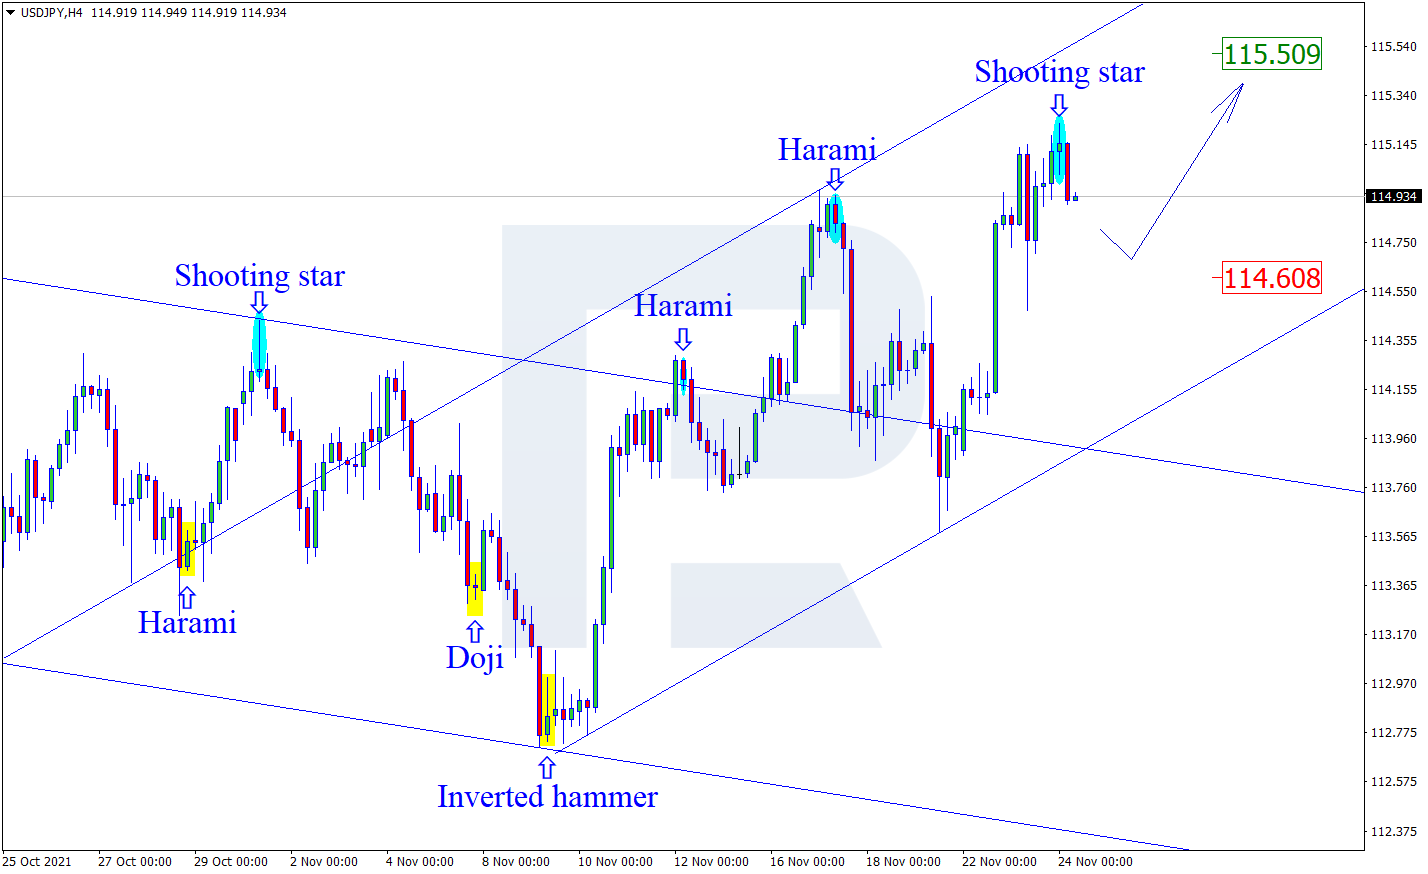
As we can see in the H4 chart, USDJPY has formed several reversal patterns, for example, Shooting Star, while testing the resistance area. At the moment, USDJPY may reverse and start a new wave to the downside towards the support level. In this case, the downside target may be at 114.60. At the same time, an opposite scenario implies that the price may continue growing to reach 115.50 without correcting and reaching the support level.

USDJPY
Risk Warning: the result of previous trading operations do not guarantee the same results in the future

EURGBP, “Euro vs Great Britain Pound”

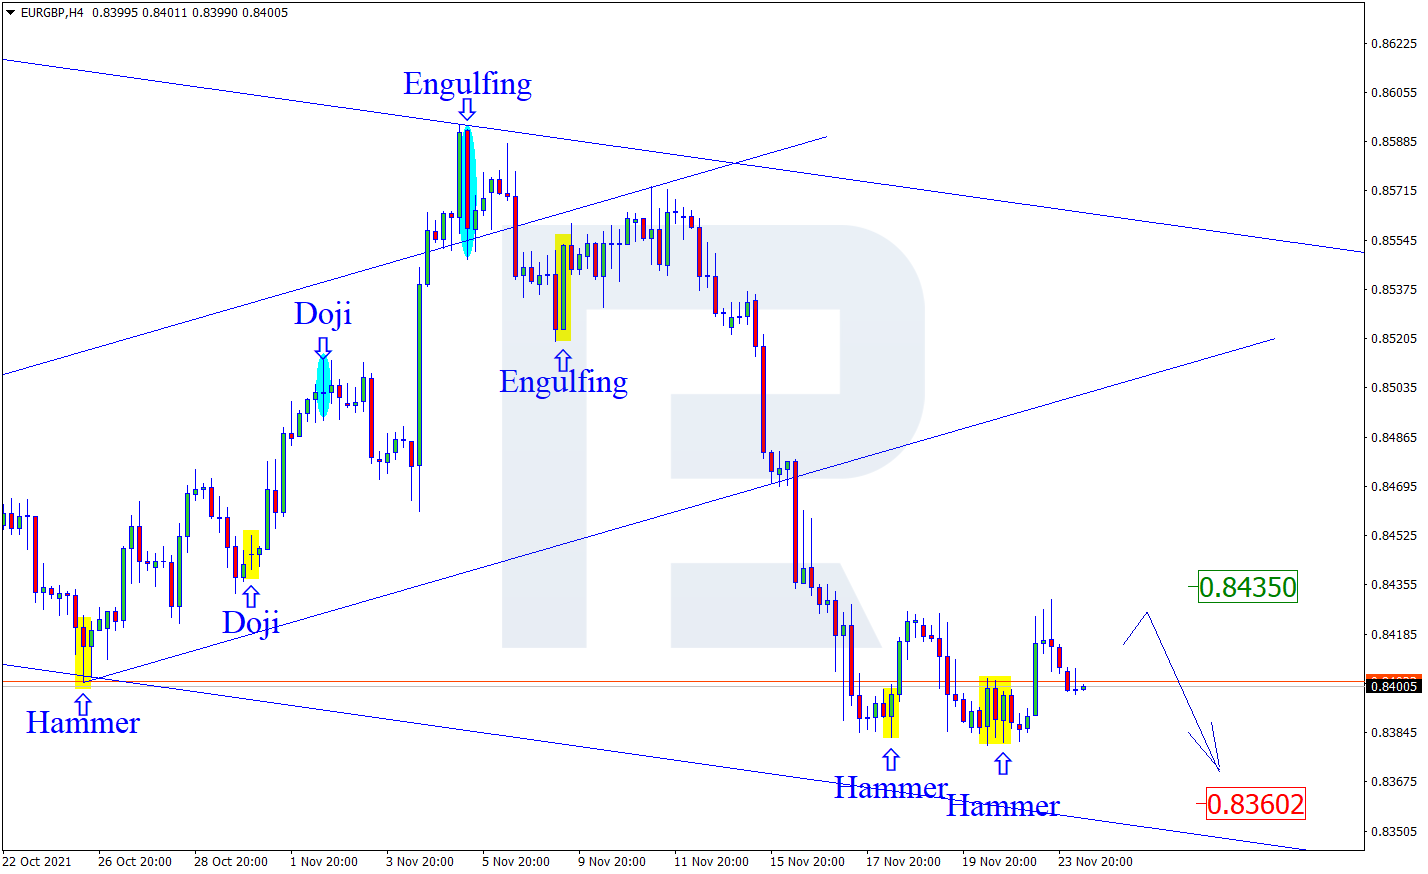
As we can see in the H4 chart, after forming several reversal patterns, such as Hammer and Inverted Hammer, near the support level, EURGBP is reversing and may start another growth towards the resistance area. In this case, the upside target may be at 0.8435. Later, the market may test the area, rebound from it, and resume the descending tendency. Still, there might be an alternative scenario, according to which the asset may continue falling to reach 0.8360 without correcting towards the resistance area.

EURGBP

Article By RoboForex.com

Attention!
Forecasts presented in this section only reflect the author’s private opinion and should not be considered as guidance for trading. RoboForex LP bears no responsibility for trading results based on trading recommendations described in these analytical reviews.

Financial ETF Sector XLF Pullback Sets Up A New $43.60 Upside Target

By TheTechnicalTraders 

– The recent downward price rotation in the Financial Sector ETF (XLF) may have frightened some traders. My research, however, suggests this move is setting up a future bullish price target near $43.60 – a more than +11% move. The end of the year Christmas Rally phase of the markets should drive spending and Q4:2021 expectations powerfully into the first quarter of 2022. Unless something big breaks this market trend, traders should continue to expect a “melt-up” bullish price trend through at least early January 2022.

Sign up for my free trading newsletter so you don’t miss the next opportunity!

The Financial Sector continues to deliver strong earnings and revenue data each quarter. The way consumers and assets prices have reacted after the COVID market collapse says quite a bit about the ability of financial firms to generate future profits. Financial firms are actively engaged in financial services, traditional banking, real estate and other investments, and corporate financing. The rising inflation trends and consumer spending activities suggest the US economy is still rallying after the COVID stimulus and recovery.

Financial ETF Sector May Rally 10% to 15%, or more, by January 2022

My analysis of Financial Sector XLF suggests this recent pullback in price may stall and start a new bullish price rally targeting the $43.60 level – a full 100% Fibonacci Price Extension of the last rally in XLF.

This Daily XLF chart shows the extended rally in early 2021 and the brief pause in the price rally between June 2021 and early September 2021. Now that we’ve entered Q4:2021 and the US economy appears to be strengthening in the post-COVID recovery, I expect that most sectors, and the US major indexes, will rally throughout the end of 2021 and into early 2022.

This recent pullback in XLF sets up a solid buying opportunity for traders targeting a +10% rally that may last well into January/February 2022 – or longer.

Financial ETF Sector

Longer-term Financial Trends Suggest Another Rally Above $44 May Start Soon

Over the past 6+ months, moderate rally phases in XLF have shown a range of about $4.00 to $4.50. I’ve highlighted two recent rally phases in XLF on this longer-term XLF Daily chart below with gold rectangles. I believe the next rally from the recent pullback will be similar in size and prompt a moderate upward price move targeting the $43.60 level – or higher.

Although there are some concerns related to the continuing recovery in the US markets, I believe the momentum of the US recovery and the strength in the US Dollar will push many US sectors higher over the next 60+ days. Closing out Q4:2021 and starting Q1:2022 with a reasonably strong rally that may surprise many traders.

The Financial Sector is likely to present very strong Q4:2021 revenues and earnings data as long as the global markets don’t push some crisis event or other issue that could detract from the US economic recovery. Right now, the most significant issues seem to be China and Europe.

Where The Financial ETF Sector May Go next

My opinion is that any moderate price weakness in the Financial Sector will be short-lived and will resolve into a bullish price rally, or “melt-upward” type of trend, as we move into early December 2021. Once the US Debt Ceiling issue resolves, I believe the Financial sector will begin a very strong rally pushing prices above $44 or $45 as Q4:2021 earnings expectations drive investors’ focus into Technology, Consumer Retail, Financials, and Real Estate.

The strength of the US Dollar is driving large amounts of capital into US assets and stocks right now. Based on my research, it is very likely that the US major indexes and certain sectors will continue to rally into early January 2022. If my analysis proves accurate, we may see a +11% to +18% rally in XLF before the end of January.

WANT TO LEARN MORE ABOUT THE FINANCIAL ETF SECTOR AND OTHERS?

Follow my research and learn how I use specific tools to help me understand price cycles, setups, and price target levels for the ETF sectors. Over the next 12 to 24+ months, I expect large price swings in the US stock market and other asset classes across the globe. I believe the markets are starting to transition away from the continued central bank support rally phase. Next, a revaluation phase may begin as global traders attempt to identify emerging trends. Precious Metals will likely start to act as a proper hedge as caution and concern drive traders/investors into Metals.

Kindly take a minute to learn about my Total ETF Portfolio (TEP) technology and how it can help you identify and trade better sector setups. My team and I have built these strategies to help us identify the strongest and best trade setups in any market sector. Every day, we deliver these setups to our subscribers along with the TEP ETF sectors system trades. You owe it to yourself to see how simple it is to trade 30% to 40% of the time to generate incredible results.

Have a great day!

Chris Vermeulen

TheTechnicalTraders.com

Murrey Math Lines 24.11.2021 (USDJPY, USDCAD)

Article By RoboForex.com

USDJPY, “US Dollar vs. Japanese Yen”

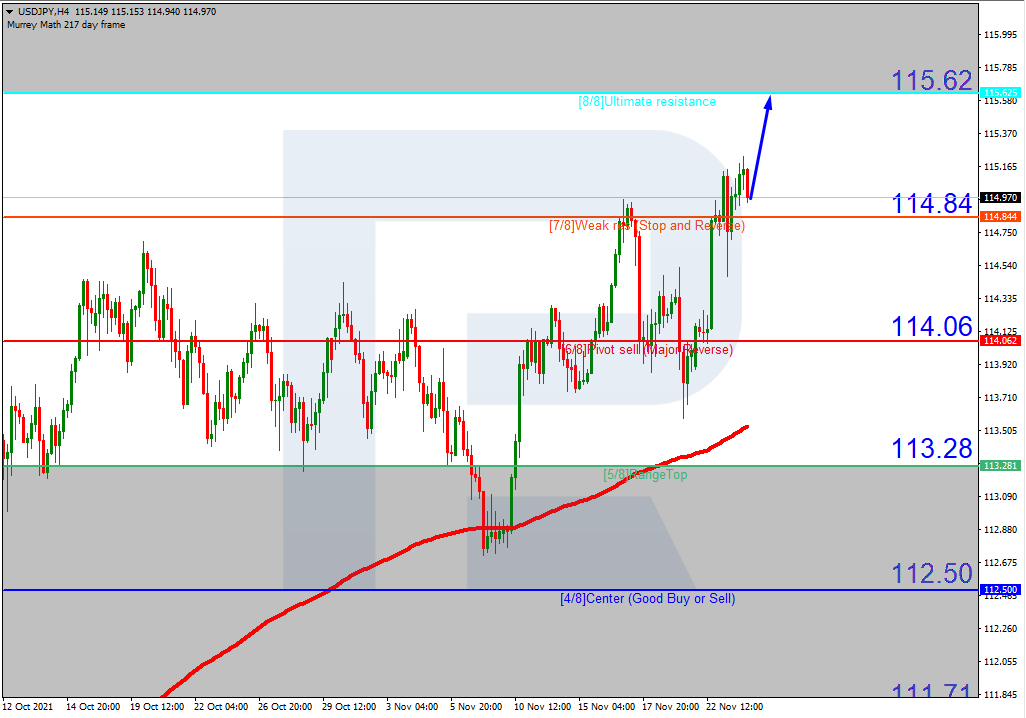
As we can see in the H4 chart, USDJPY is trading above the 200-day Moving Average, thus indicating an ascending tendency. Having broken 7/8 and fixed above it, the price is expected to continue growing to reach the resistance at 8/8. However, this scenario may no longer be valid if the price breaks 7/8 to the downside. After that, the instrument may reverse and correct towards the support at 6/8.

USDJPYH4
Risk Warning: the result of previous trading operations do not guarantee the same results in the future

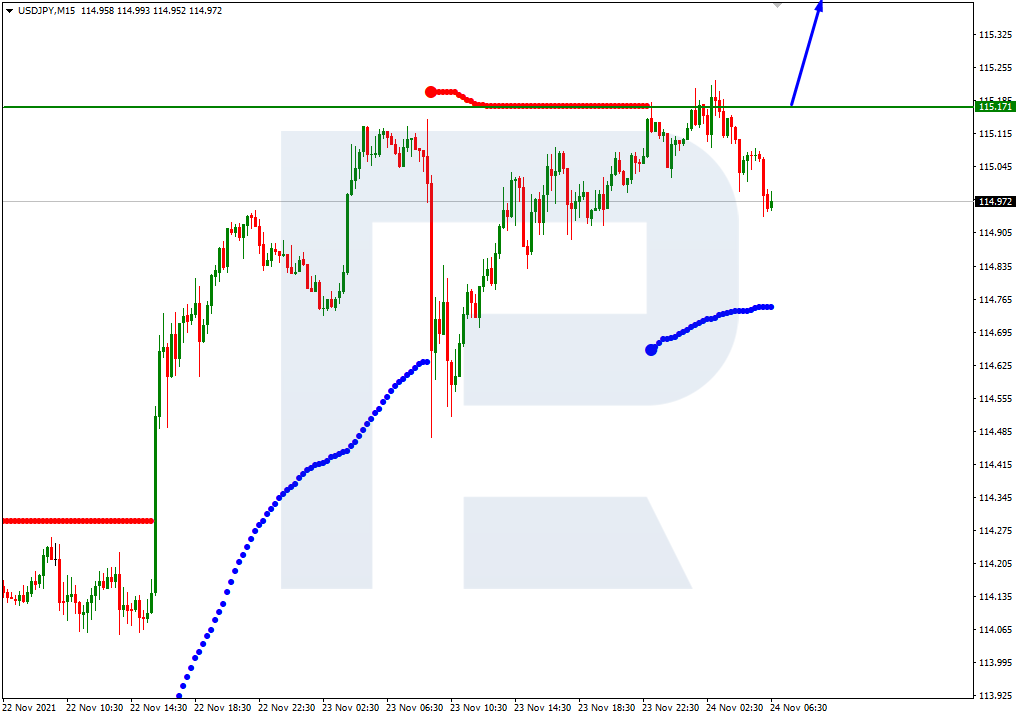
In the M15 chart, the pair may break the upside line of the VoltyChannel indicator and, as a result, continue its growth.

USDJPY_M15
Risk Warning: the result of previous trading operations do not guarantee the same results in the future

USDCAD, “US Dollar vs Canadian Dollar”

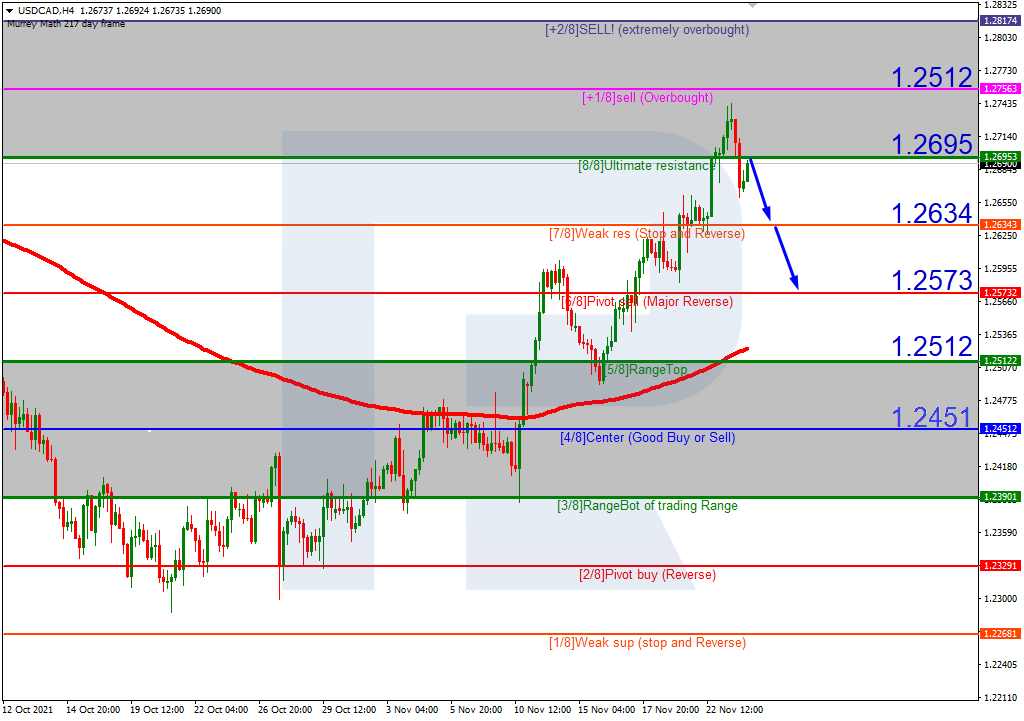
As we can see in the H4 chart, USDCAD is re-testing the resistance at 8/8. In this case, the price is expected to rebound from this level and then resume falling towards the support at 6/8. Still, this scenario may no longer be valid if the price breaks 8/8 to the upside. After that, the instrument may grow to reach the resistance at +1/8.

USDCAD_H4
Risk Warning: the result of previous trading operations do not guarantee the same results in the future

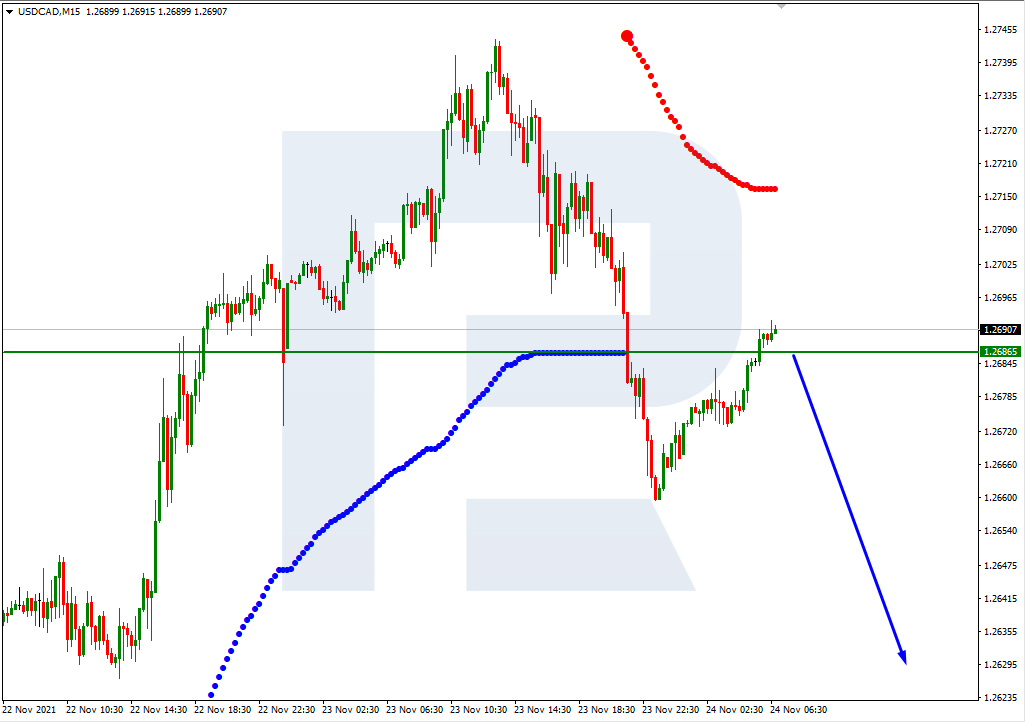
In the M15 chart, the pair may break the downside line of the VoltyChannel indicator and, as a result, continue falling to reach 6/8 from the H4 chart.

USDCAD_M15

Article By RoboForex.com

Attention!
Forecasts presented in this section only reflect the author’s private opinion and should not be considered as guidance for trading. RoboForex LP bears no responsibility for trading results based on trading recommendations described in these analytical reviews.

AUDUSD Triple Zigzag Hints At Bullish Growth

By Orbex

AUDUSD

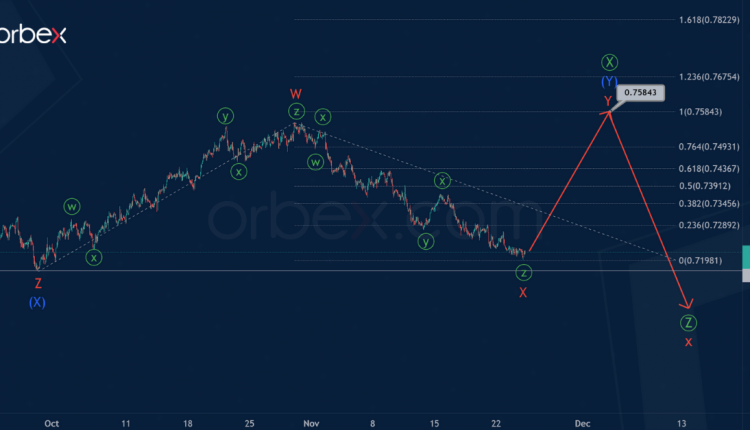
The AUDUSD currency pair suggests the development of a bearish intervening wave x of the cycle degree. It hints at a triple zigzag Ⓦ-Ⓧ-Ⓨ-Ⓧ-Ⓩ.

At the time of writing, a bullish intervening wave Ⓧ is formating, taking the form of an intermediate double (W)-(X)-(Y) zigzag. Currently, the intermediate intervening wave (X), followed by the development of the final actionary wave (Y), has begun.

Wave (Y) can take the form of a double zigzag W-X-Y of the minor degree. The W and X sub-waves have already completed their pattern. And each of them is a triple zigzag of the minute degree.

Thus, in the near future, the rate could increase in the minor wave Y towards the 0.758 area. At that level, intermediate waves (W) and (Y) will be equal.

AUDUSD

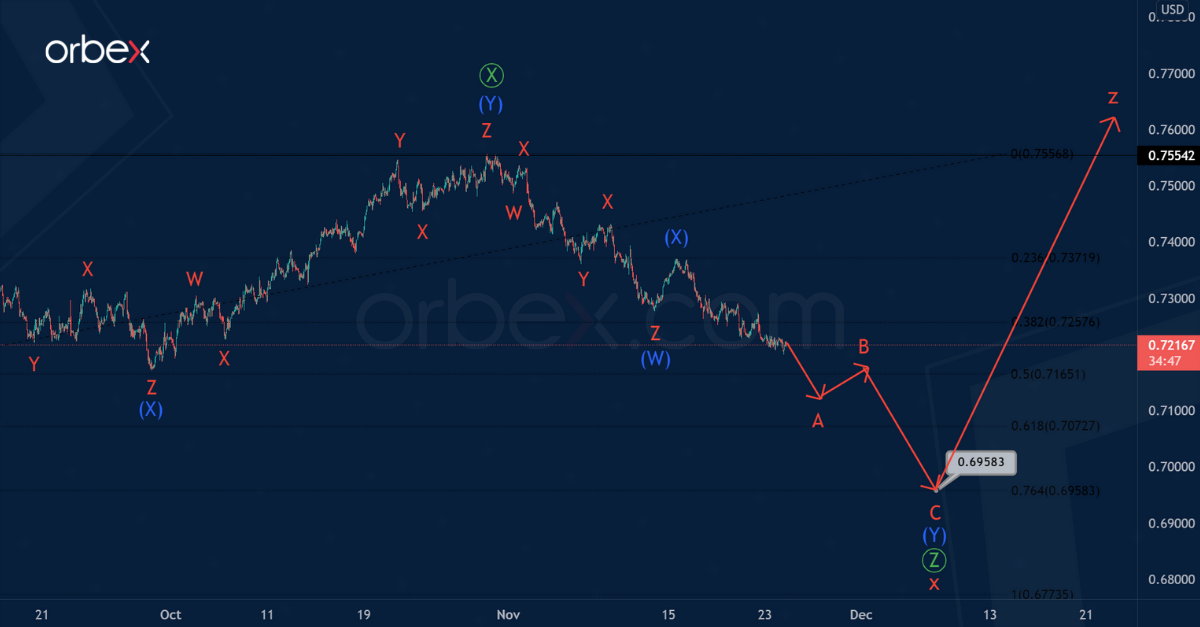
Let’s consider an alternative scenario in which the formation of the primary intervening wave Ⓧ has already come to an end. It took the form of an intermediate double zigzag.

Now the market is in the final part of the primary wave Ⓩ and most likely, it is a double zigzag. This wave can complete the minor standard zigzag near 0.695 level, as shown on the chart.

At the level of 0.695, primary wave Ⓩ will be at 76.4% of wave Ⓨ. After reaching the specified price level, the cycle intervening wave x will end. Then prices could rise within the cycle wave z above the maximum of 0.755.


Orbex-LogoArticle by Orbex

Orbex is a fully licensed broker that was established in 2011. Founded with a mission to serve its traders responsibly and provides traders with access to the world’s largest and most liquid financial markets. www.orbex.com

The Analytical Overview of the Main Currency Pairs on 2021.11.24

by JustForex

The EUR/USD currency pair

Technical indicators of the currency pair:
  • Prev Open: 1.1234
  • Prev Close: 1.1248
  • % chg. over the last day: +0.12%

Europe continues to face power shortages in the region. Electricity prices in some countries are approaching historic highs. The business activity index in Europe increased unexpectedly, which was a surprise to analysts who had expected a slowdown in activity, especially in the manufacturing sector. However, there are no fundamental reasons for the euro to rise now as the ECB continues to print money actively.

Trading recommendations
  • Support levels: 1.1256, 1.1168
  • Resistance levels: 1.1386, 1.1436, 1.1535, 1.1613, 1.1667, 1.1717

From a technical point of view, the EUR/USD pair is bearish on the hour time frame. The Euro continues to show weakness, but the price is narrowing in a triangle, suggesting an impulsive movement. The MACD indicator has become inactive, but there are signs of divergence at several time frames, so traders should expect a technical rebound. Under such market conditions, traders should consider sell positions from the resistance levels near the moving average since the price has deviated strongly from the averages. Buy trades should be considered only from the support levels of the higher time frame, given the buyers’ initiative, but only with short targets.

Alternative scenario: if the price breaks out through the 1.1386 resistance level and fixes above, the mid-term uptrend will likely resume.

EUR/USD
News feed for 2021.11.24:
  • – German Ifo Business Climate (m/m) at 11:00 (GMT+2);
  • – US Prelim GDP (q/q) at 15:30 (GMT+2);
  • – US Core Durable Goods Orders (m/m) at 15:30 (GMT+2);
  • – US Initial Jobless Claims (w/w) at 15:30 (GMT+2);
  • – US PCE price index (m/m) at 17:00 (GMT+2);
  • – US New Home Sales (m/m) at 17:00 (GMT+2);
  • – US Michigan Consumer Sentiment (m/m) at 17:00 (GMT+2);
  • – US FOMC Meeting Minutes at 21:00 (GMT+2).

The GBP/USD currency pair

Technical indicators of the currency pair:
  • Prev Open: 1.3392
  • Prev Close: 1.3378
  • % chg. over the last day: -0.10%

In the UK, there is an increase in business activity. Data for October showed an increase in the manufacturing sector, while in the services sector, the data was negative. With expectations of an interest rate hike from the Bank of England, the British pound might be strengthened soon.

Trading recommendations
  • Support levels: 1.3360
  • Resistance levels: 1.3434, 1.3507, 1.3575, 1.3685, 1.3748

On the hourly time frame, the trend on GBP/USD is bearish. The MACD indicator has become inactive. The currency pair has formed a clear flat corridor with the range of 1.3360-1.3508. Under such market conditions, traders should consider sell positions from the upper border of the range. Buy trades should be considered only from the lower border of the range, given the buyers’ initiative.

Alternative scenario: if the price breaks out through the 1.3507 resistance level and consolidates above, the bullish scenario will likely resume.

GBP/USD
There is no news feed for today.

The USD/JPY currency pair

Technical indicators of the currency pair:
  • Prev Open: 114.87
  • Prev Close: 115.12
  • % chg. over the last day: +0.22%

Japan’s business activity index showed an improvement for October. The lifting of the restrictions has already been reflected in the economic data more than a month ago. The economic situation in Japan will improve slowly. However, the JPY will be losing its position against the USD because the Bank of Japan does not plan to cut its stimulus program at the moment.

Trading recommendations
  • Support levels: 114.38, 113.79, 113.32, 112.87, 112.30
  • Resistance levels: 115.15, 115.50

The global trend on the USD/JPY currency pair is bullish. The MACD indicator is positive, but there are the first signs of divergence. Under such market conditions, it’s better to look for buy positions from the buyers’ initiative zone near the moving average. Sell positions should be considered from the resistance levels of higher time frames, given there is sellers’ initiative, but only with short targets.

Alternative scenario: if the price falls below 113.79, the uptrend will likely be broken.

USD/JPY
News feed for 2021.11.24:
  • – Japan Manufacturing PMI (m/m) at 02:30 (GMT+2).

The USD/CAD currency pair

Technical indicators of the currency pair:
  • Prev Open: 1.2698
  • Prev Close: 1.2668
  • % chg. over the last day: -0.23%

The Canadian dollar is a commodity currency, so the USD/CAD currency pair highly depends on the dynamics of the dollar index and oil prices. Yesterday, the dollar index was trading in a narrow range, while the oil prices increased by more than 3%, despite the possible oil reserves released by the USA, Japan, China, and India. As a result, the USD/CAD currency pair increased due to the strengthening of the Canadian dollar.

Trading recommendations
  • Support levels: 1.2646, 1.2598, 1.2571, 1.2483, 1.2416, 1.2388
  • Resistance levels: 1.2729

From a technical point of view, the trend of the USD/CAD currency is bullish. The MACD indicator has become inactive. There are signs of divergence on several time frames while indicating a weakness of buyers. Under such market conditions, it is better to look for buy trades from the support levels near the moving average since the price has strongly deviated from the average values. Sell deals should be considered from the resistance levels of the higher time frames.

Alternative scenario: if the price breaks down through the 1.2571 support level and fixes below, the downtrend will likely resume.

USD/CAD
News feed for 2021.11.24:
  • – US Crude Oil Reserves (w/w) at 17:30 (GMT+2).

by JustForex


This article reflects a personal opinion and should not be interpreted as an investment advice, and/or offer, and/or a persistent request for carrying out financial transactions, and/or a guarantee, and/or a forecast of future events.

Intraday Market Analysis – EUR Stays Under Pressure

By Orbex

EURUSD struggles to rebound

EURUSD

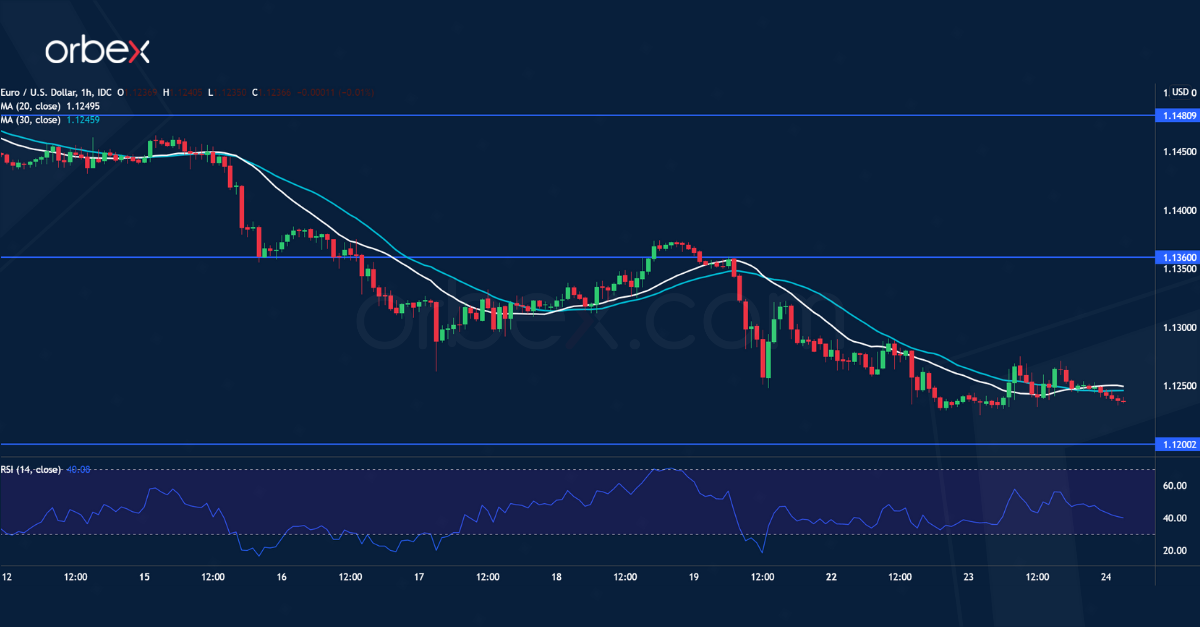
The euro bounced back after PMI readings in the eurozone exceeded expectations. The pair is testing July 2020’s lows around 1.1200.

The RSI’s oversold situation on the daily chart may limit the downward pressure for now. We can expect a ‘buying-the-dips’ crowd as price action stabilizes. Sentiment remains fragile though and sellers may fade the next rebound.

The bulls will need to lift 1.1360 before a reversal could take shape. Failing that, a bearish breakout would trigger a new round of sell-off towards 1.1100.

NZDUSD lacks support

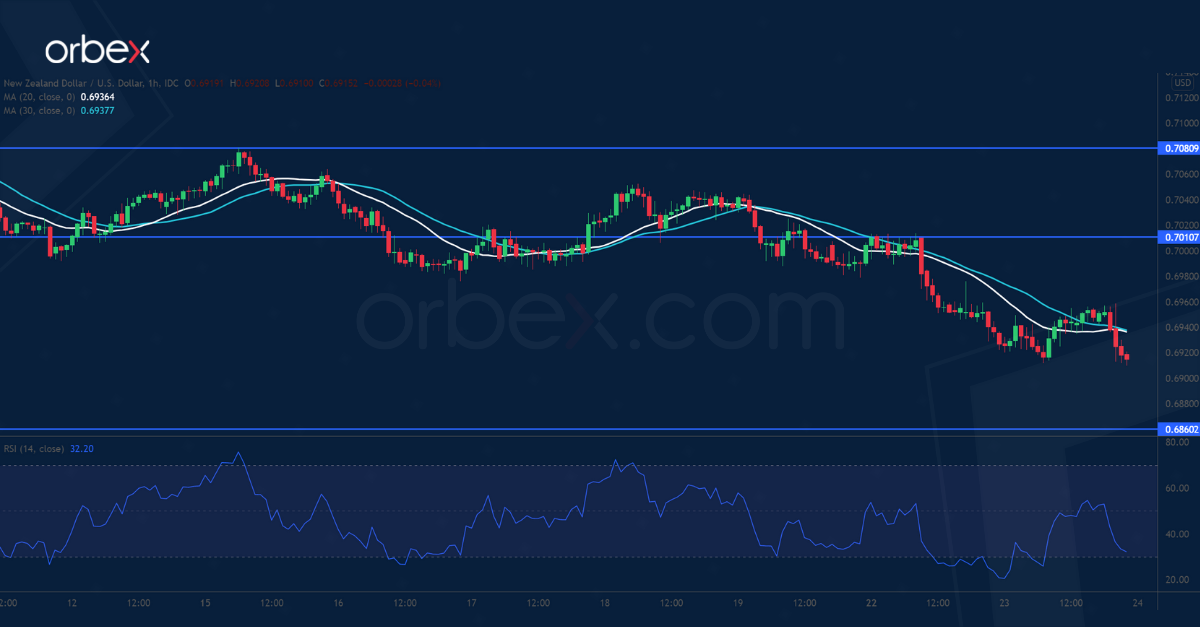
NZDUSD

The New Zealand dollar softened after the RBNZ met market expectations and raised its cash rate by 25bps.

The downward pressure has increased after 0.6980 failed to contain the sell-off. The pair has given up all gains from the October rally, suggesting a lack of interest in bidding up the kiwi.

An oversold RSI caused a rebound as short-term traders took profit and the bears were swift in selling into strength. The directional bias remains bearish unless 0.7010 is cleared. The September low at 0.6860 is the next support.

UKOIL bounces back

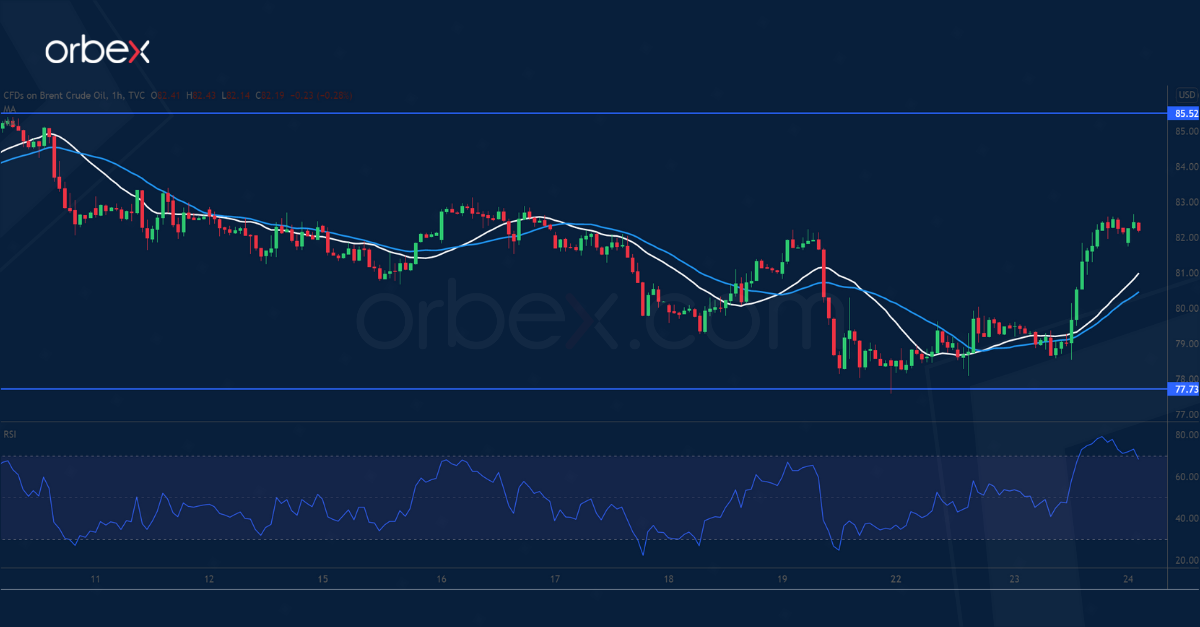
UKOIL

Brent crude recovers on speculation that OPEC+ may lower production to counter a release of strategic reserves.

A break below 79.30 has shaken out the weak hands. The price has met buying interest over the daily demand zone around 77.70, which coincides with last July’s peak. A surge above 82.00 puts the bears on the defensive.

Short-covering would exacerbate short-term volatility. An overbought RSI may cause a brief pullback. Then 85.50 is a key hurdle before the uptrend could resume.


Orbex-LogoArticle by Orbex

Orbex is a fully licensed broker that was established in 2011. Founded with a mission to serve its traders responsibly and provides traders with access to the world’s largest and most liquid financial markets. www.orbex.com

The FOMC protocols are expected to be published today

by JustForex

At the close of the New York Stock Exchange, the Dow Jones index increased by 0.55%, the S&P 500 index added 0.17%, and the NASDAQ index decreased by 0.50%. The Nasdaq technology showed the drop since rising Treasury yields put pressure on major technology stocks. At the same time, gains in bank stocks and energy stocks helped limit broader market losses.

FOMC protocols are expected to be released today, along with a number of other important US economic data before tomorrow’s bank holiday. Any hints from the Fed to accelerate the pace of QE reduction or to raise interest rates could push the dollar index higher. If the pace of the cuts remains the same, the dollar index may start a technical correction.

A rise in the dollar index usually leads to higher government bond yields and lower gold and silver prices, which have an inverse correlation to Treasury yields. Gold has already dropped below $1800 per troy ounce and this downward trend is likely to continue.

European stock markets were mostly down yesterday. German DAX decreased by 1.11%, French CAC 40 decreased by 0.85%, Italian FTSE MIB lost 1.62%, Spanish IBEX decreased by 0.07%. The only exception was the British FTSE 100, which added 0.15%. In the UK, there is an increase in business activity. Data for October showed a rise in the manufacturing sector, while in the services sector the data was negative. With expectations of an interest rate hike from the Bank of England, the British pound might be strengthened soon.

After fixing a record daily sickness rate, Germany is considering options to tighten its anti-covids measures, including introducing regional lockdowns as the Netherlands has already done. Meanwhile, Germany has one of the lowest rates of vaccinated citizens in Western Europe. Analysts believe that a new wave of disease in Europe will cause more economic problems in December.

The United States, China, India, Japan, South Korea, and the United Kingdom plan to release oil from strategic reserves to decrease global oil prices. Biden’s decision to use the US strategic oil reserve calls for a release of 50 million barrels. But the long-awaited coordinated release of oil with other major consuming countries has so far only increased oil prices by more than 3%, which was unexpected for the White House. Analysts believe that the release of inventories is hardly enough to meet global needs. Barclays Bank raised its forecast for average oil prices for the next 2022 to $77 and $80 a barrel of WTI and Brent, respectively.

The Turkish lira dropped another 10% while continuing to fall, to 12 per dollar after Erdogan acted at lower interest rates. Turkey’s inflation rate is second after Venezuela and Zimbabwe.

On Wednesday, the Reserve Bank of New Zealand raised its interest rate by 25 basis points to 0.75%. Analysts had expected an increase of 50 b.p. This is the second rate hike within the last 2 months. This is the Central Bank of New Zealand’s response to the fight against inflation. New Zealand consumer prices increased to 4.9% in annual terms, well above the RBNZ target of 1.0-3.0%.

Asia-Pacific stock markets are decreasing in Wednesday trading. Technology sector companies are among the leaders of the fall on Asian exchanges because of the increase in government bond yields. The growth of government bond yields leads to an increase in the discount rate used for the valuation of shares. In addition, it affects the technology companies most of all because the perspectives of the rapid growth of profits are laid in these companies.

Main market quotes:

S&P 500 (F) 4,690.70 +7.76 (+0.17%)

Dow Jones 35,813.80 +194.55 (+0.55%)

DAX 15,937.00 −178.69 (−1.11%)

FTSE 100 7,266.69 +11.23 (+0.15%)

USD Index 96.49 −0.06 (−0.06%)

Important events for today:
  • – Japan Manufacturing PMI (m/m) at 02:30 (GMT+2);
  • – New Zealand RBNZ Interest Rate Decision (m/m) at 03:00 (GMT+2);
  • – New Zealand RBNZ Monetary Policy Statement (m/m) at 03:00 (GMT+2);
  • – New Zealand RBNZ Press Conference at 04:00 (GMT+2);
  • – German Ifo Business Climate (m/m) at 11:00 (GMT+2);
  • – US Prelim GDP (q/q) at 15:30 (GMT+2);
  • – US Core Durable Goods Orders (m/m) at 15:30 (GMT+2);
  • – US Initial Jobless Claims (w/w) at 15:30 (GMT+2);
  • – US PCE price index (m/m) at 17:00 (GMT+2);
  • – US New Home Sales (m/m) at 17:00 (GMT+2);
  • – US Michigan Consumer Sentiment (m/m) at 17:00 (GMT+2);
  • – US Crude Oil Reserves (w/w) at 17:30 (GMT+2);
  • – US Natural Gas Storage (w/w) at 19:00 (GMT+2);
  • – US FOMC Meeting Minutes at 21:00 (GMT+2).

by JustForex


This article reflects a personal opinion and should not be interpreted as an investment advice, and/or offer, and/or a persistent request for carrying out financial transactions, and/or a guarantee, and/or a forecast of future events.