Equity bulls jittery, dollar sinks as investors digest inflation data

Lukman Otunuga

By Lukman Otunuga Senior Research Analyst, ForexTime

Most Asian shares ventured into negative territory this morning while European stocks markets have opened up marginally lower open after the December U.S. inflation report reinforced Fed rate hike expectations.

The U.S. consumer price index (CPI) jumped 7% year-on-year, matching the median forecast from economists surveyed by Bloomberg and up from 6.8% in November. Core inflation, which strips out volatile items like food and energy, rose 5.5%, well above the 4.9% reported in the previous month.

Markets initially offered a calm reaction to the hot report with Wall Street closing modestly higher on Wednesday. The most notable price action was seen in FX markets, with king dollar breaking down as Treasury yields pulled back, while gold bugs were injected with renewed confidence. The December CPI report has presented further evidence of persistent price pressures, especially with inflation registering its biggest annual gain since 1982.

As expectations intensify over the Fed raising interest rates as soon as March, this may weigh more heavily on global stocks. while supporting the dollar and Treasury yields in the medium term. Given how markets remain sensitive to comments from Fed officials, today could see more volatility with numerous Fed speakers on the roster.

Dollar Index (DXY) slams into 95.00

The dollar tumbled to a two-month low against a basket of currencies yesterday after the inflation figures for December matched expectations. Investors may have seen this data as bearish for the world’s reserve currency as they were possibly expecting the figures to be even hotter. Nevertheless, the headline surged 7% last month, its biggest year-on-year increase since June 1982 and seven of the last nine releases have now come in above consensus. Traders are currently pricing in an 84% probability of at least one rate hike by mid-March 2022.

Looking at the technical picture, the Dollar Index remains under pressure on the daily charts. A breakdown below 95.00 could open the doors towards 94.56 and 94.00, respectively.

Commodity spotlight – Gold

After notching its sharpest weekly loss since November, gold bulls have returned with a vengeance this week.

The precious metal continues to draw strength from a weaker dollar and slight pullback in Treasury yields with prices trading around $1826 as of writing. Inflation risks could also be supporting upside gains for gold which has often been considered a hedge against rising prices. With inflation in the United States jumping in December, this could encourage some investors to hold onto their gold investments.

However, the precious metal is certainly not out of the woods yet. The zero-yielding asset tends to perform poorly in a high interest rate environment. So, with the Fed expected to hike as soon as March, the road ahead for gold bugs could be filled with bumps and obstacles. On top of this, the dollar may regain its mojo on rate hike bets with Treasury yields pushing higher. Should this become a reality, gold could be in store for fresh pain down the road.

Technically, the precious metal has the potential to push higher towards $1845 if a daily close above $1831 is achieved. Alternatively, a decline back below $1810 could prices move lower towards $1800, $1786 and $1770.

Disclaimer: The content in this article comprises personal opinions and should not be construed as containing personal and/or other investment advice and/or an offer of and/or solicitation for any transactions in financial instruments and/or a guarantee and/or prediction of future performance. ForexTime (FXTM), its affiliates, agents, directors, officers or employees do not guarantee the accuracy, validity, timeliness or completeness, of any information or data made available and assume no liability as to any loss arising from any investment based on the same.


Forex-Time-LogoArticle by ForexTime

ForexTime Ltd (FXTM) is an award winning international online forex broker regulated by CySEC 185/12 www.forextime.com


Has Boris Johnson’s Time As PM Run Out?

By Orbex

The latest series of political scandals in the UK made an incursion into the markets today.

Specifically, the Financial Times ran a headline suggesting this was the worst political situation since moving into 10 Downing Street. The headline said there was a mutiny among Tory MPs, following yet another revelation that the PM held a party in the middle of national lockdowns.

Naturally, this led to some speculation that the PM could be pressured to step down. And this would be the third resignation in a row for Conservative PMs. But, despite the headlines, there might be some indications that Johnson could ride it out, and that it’s unlikely he will resign.

It’s down to the polls

Tory MPs have become increasingly restless since late November when polls showed that the majority of Britons had shifted their support to Labor. Since then, the personal approval of Johnson has continued to crater. In fact, just 31% of the public approve of his government, against 61% who disapprove, according to the latest polls.

However, despite the anger of many party leaders, at least according to YouGov, a majority of Tory party members don’t want the PM to resign (not yet at least). Less than a third of Conservative respondents said they wanted a new leader.

Change doesn’t necessarily mean an improvement

One of the reasons that Conservatives may not want a new PM could be tactical.

The current leading contender to replace Johnson is Chancellor Rishi Sunak. He has more support on Whitehall and is a favourite among betters. Nonetheless, he is still embroiled in the same party scandals as Johnson.

And Johnson might have more support among Conservatives because the PM’s participation in media coverage overshadows Sunak’s. If he were to become PM, the situation would reverse, and he would face a similar popularity challenge as Johnson.

The bottom line is that there isn’t much advantage to replacing the PM if the new PM will have the same public perception problems. This might be the crude math that Downing Street is doing, as other potential candidates who aren’t involved in the party scandals have significantly lower public approval at the moment.

What does it mean for the markets?

Markets tend to hate uncertainty. But the resignation of the PM would probably not cause any change in terms of fiscal policy. Especially if it’s Sunak who replaces him since presumably he would keep the same policies he’s already implementing as Chancellor. Despite the media focus on the scandals, as far as the markets are concerned, there won’t be much impact.

What could have a bigger impact, however, is if Johnson doesn’t resign, and keeps cratering in the polls. That would encourage Labor to mount a harder opposition, although it would help prevent Johnson from facing a no-confidence vote. The next elections won’t happen until 2024, when the public might forget about the scandal.

At this juncture, no one is expecting a snap election. Replacing the PM could leave the markets unaffected. Nevertheless, if talk of a snap election starts to surface, then we might want to start reevaluating our UK-exposed portfolios.


Orbex-LogoArticle by Orbex

Orbex is a fully licensed broker that was established in 2011. Founded with a mission to serve its traders responsibly and provides traders with access to the world’s largest and most liquid financial markets. www.orbex.com

NZDUSD 5 Wave Impulse Could Lead To New Highs

By Orbex

NZDUSD

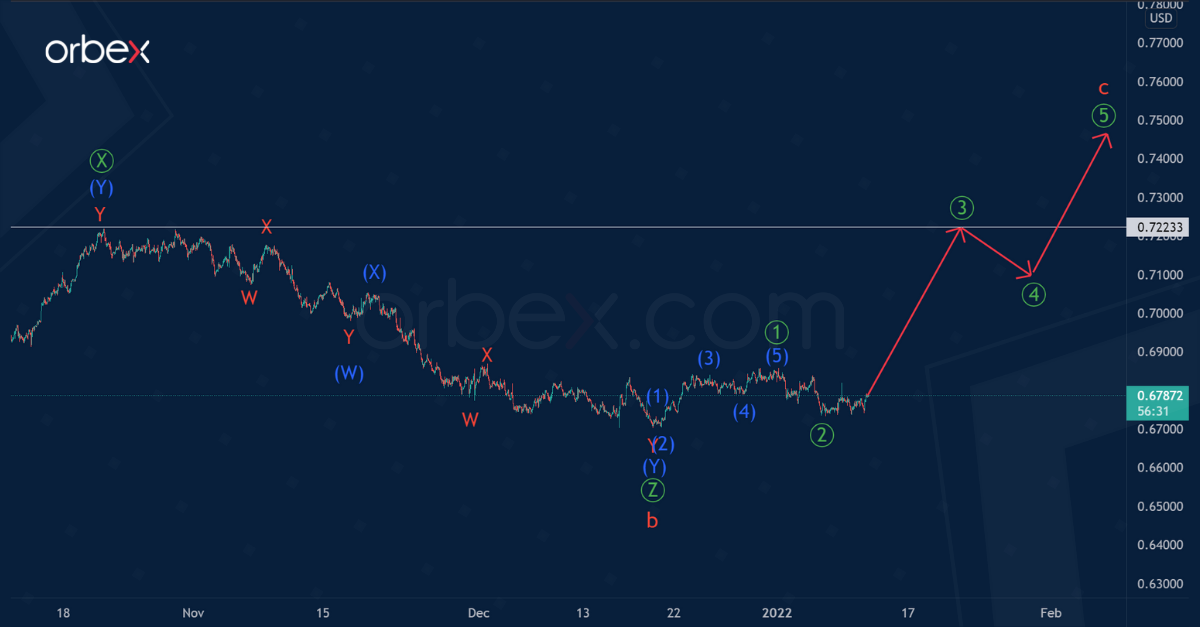
In the long term, the formation of the NZDUSD currency pair hints at a cycle zigzag pattern, which consists of three main sub-waves a-b-c.

On the current chart, we see the second half of a major correction wave b of the cycle degree. It seems to be complete, taking the form of a primary triple zigzag Ⓦ-Ⓧ-Ⓨ-Ⓧ-Ⓩ.

After the completion of the correction pattern, the market turned around, and we saw the development of the initial part of the cycle wave c. This wave is likely to take the form of a simple 5-wave impulse, as shown in the chart, consisting of five primary sub-waves ①-②-③-④-⑤.

The first two primary sub-waves ①-② have ended. The end of wave ③ could be at the previous maximum of 0.722.

NZDUSD

Alternatively, the formation of wave b of the cycle degree can continue. Therefore, the primary wave Ⓩ could be a triple (W)-(X)-(Y)-(X)-(Z) zigzag of the intermediate degree.

The first four parts of the intermediate pattern have visibly ended. Then the price could begin to decline in the final intermediate wave (Z).

Wave (Z) could take the form of a minor triple zigzag W-X-Y-X-Z.

The fall of the exchange rate in the alternative could reach the level of 0.640. At that level, primary wave Ⓩ will be at 161.8% of primary wave Ⓨ.


Orbex-LogoArticle by Orbex

Orbex is a fully licensed broker that was established in 2011. Founded with a mission to serve its traders responsibly and provides traders with access to the world’s largest and most liquid financial markets. www.orbex.com

Intraday Market Analysis – USD Under Pressure

By Orbex

GBPUSD rally gains traction

GBPUSD

The US dollar fell after the Fed Chair’s remark that no decision has been made on quantitative tightening. The pair showed some weakness near the daily resistance at 1.3600.

The RSI’s double top in the overbought area led some buyers to take chips off the table. However, a follow-up close above the resistance indicates that the bulls are still in control of the direction.

Sentiment remains upbeat and 1.3700 from the start of the November sell-off would be the next target. 1.3570 is a fresh support in case of a pullback.

NZDUSD bounces off major support

NZDUSD

The New Zealand dollar recovers as risk appetite returns following Jerome Powell’s testimony.

The previous rebound towards 0.6830 met strong selling pressure. Its failure to achieve a new high suggests that the bearish bias lingers. The drop below 0.6740 further weighs on the kiwi. A bounce could still be an opportunity to sell into strength.

The bulls need to clear 0.6835 in order to turn the tide, and 0.6730 is a fresh support. A bearish breakout may test the base of December’s bounce at 0.6700.

EURJPY maintains uptrend

EURJPY

The euro recoups losses as traders dump safe-haven currencies. The fall below 130.80 has shaken out some weak hands.

Nonetheless, the upward bias remains intact after the single currency saw solid demand over the psychological level of 130.00. The RSI’s oversold situation compounded the attractiveness of the discount.

A rise above 131.60 would bring in momentum traders and clear the path for an extended rally to 132.55 near last October’s peak. 129.10 is the second line of defence in case of a deeper retracement.


Orbex-LogoArticle by Orbex

Orbex is a fully licensed broker that was established in 2011. Founded with a mission to serve its traders responsibly and provides traders with access to the world’s largest and most liquid financial markets. www.orbex.com

Fibonacci Retracements Analysis 12.01.2022 (GBPUSD, EURJPY)

Article By RoboForex.com

GBPUSD, “Great Britain Pound vs US Dollar”

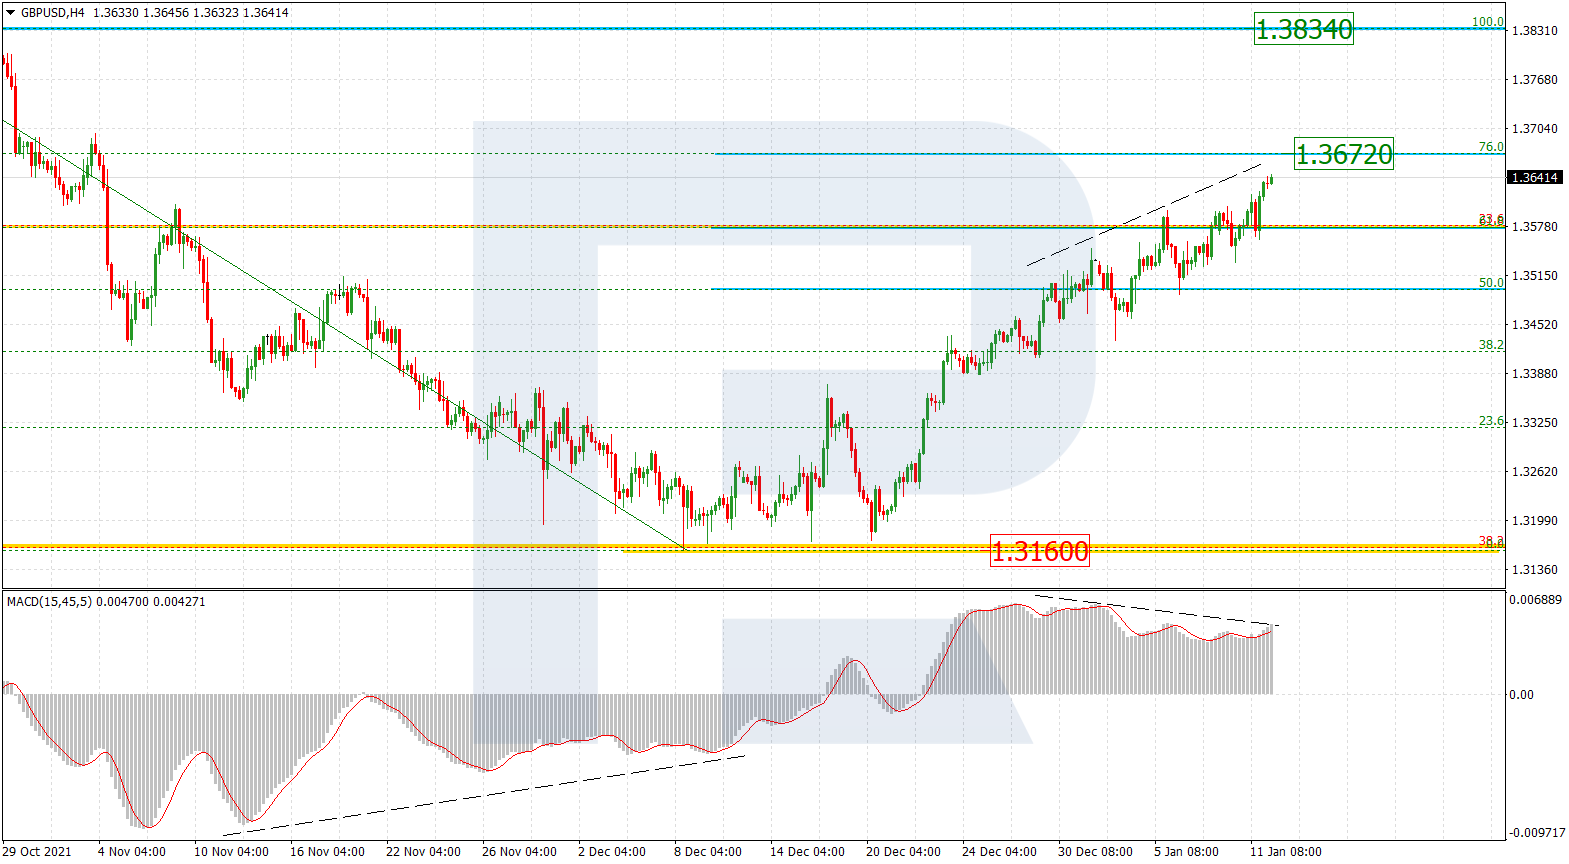
As we can see in the H4 chart, GBPUSD has reached 61.8% fibo after convergence on MACD and may boost its growth towards 76.0% fibo at 1.3672. After that, the pair may start a new correction to the downside before attacking the high at 1.3824. The key support is at 1.3160.

GBPUSD_H4
Risk Warning: the result of previous trading operations do not guarantee the same results in the future

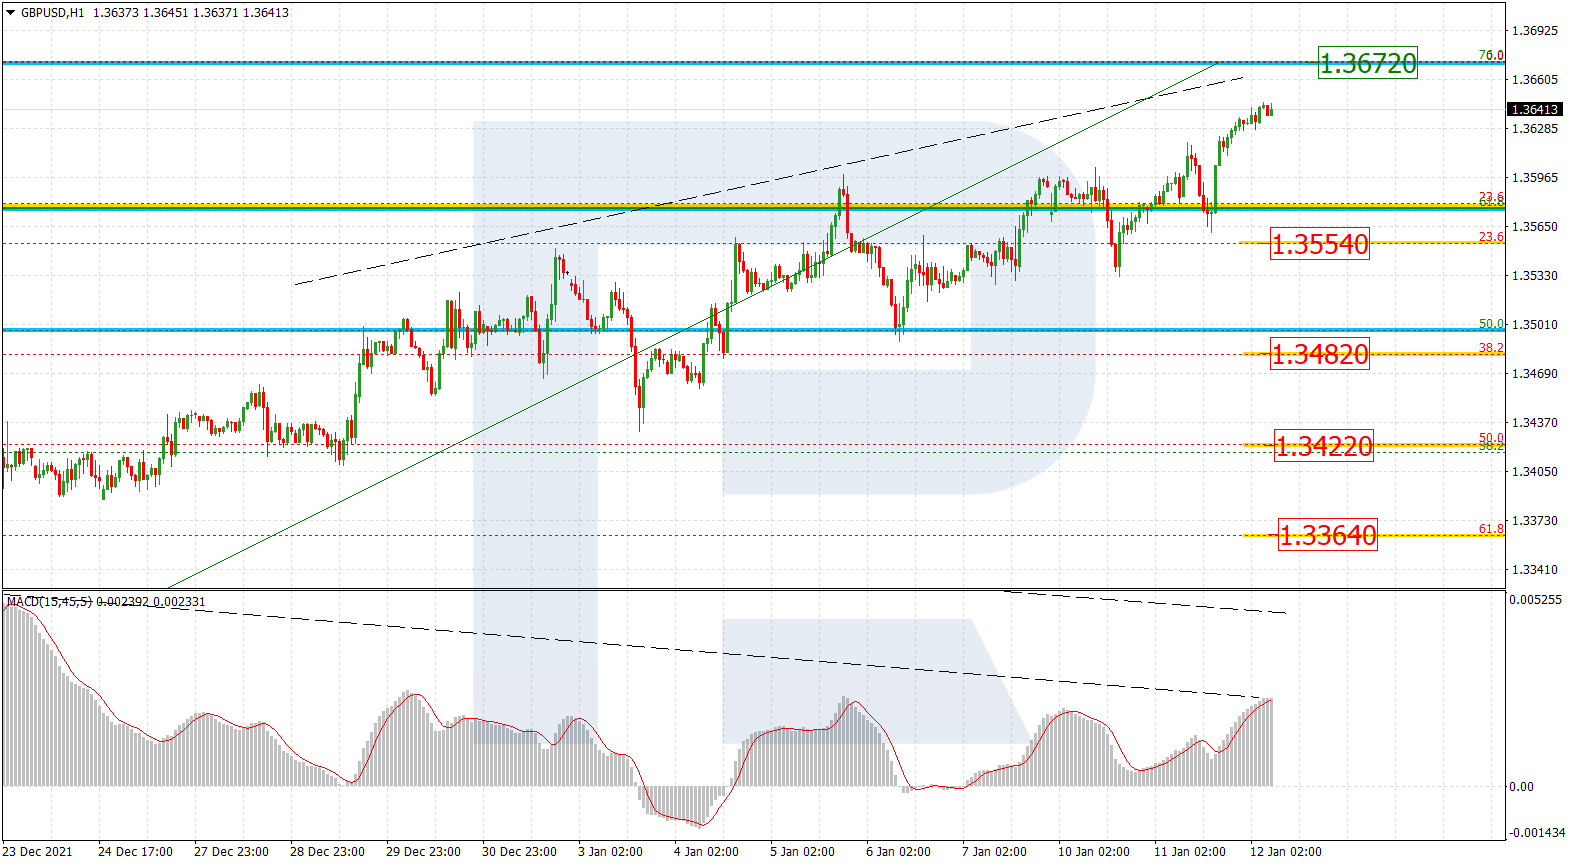
The H1 chart shows a more detailed structure of divergence on MACD and potential correctional targets – 23.6%, 38.2%, 50.0%, and 61.8% fibo at 1.3554, 1.3482, 1.3422, and 1.3364 respectively.

GBPUSD_H1
Risk Warning: the result of previous trading operations do not guarantee the same results in the future

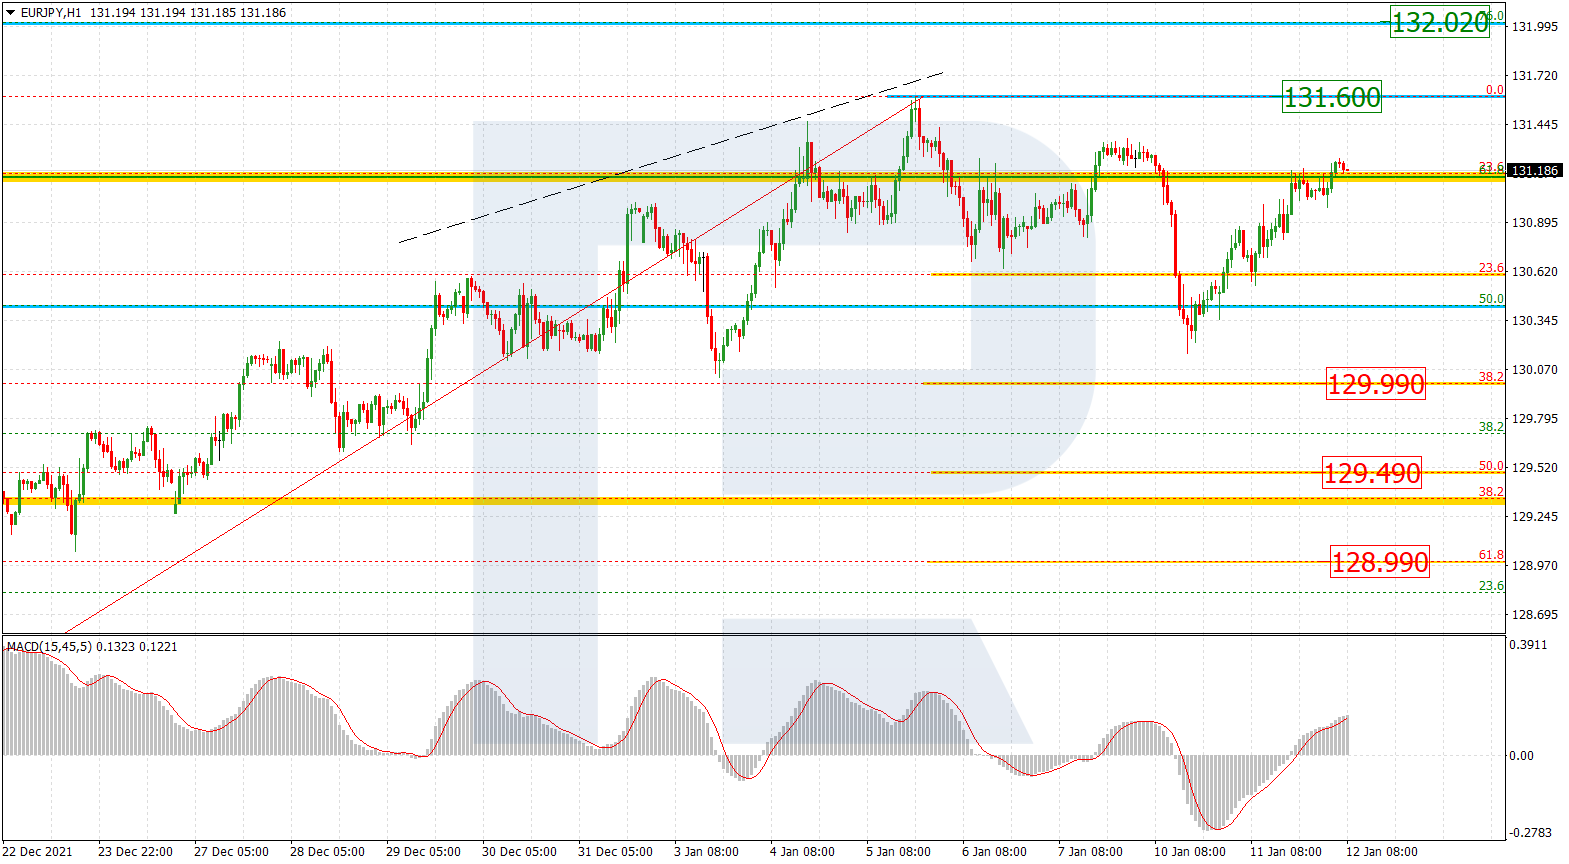
EURJPY, “Euro vs. Japanese Yen”

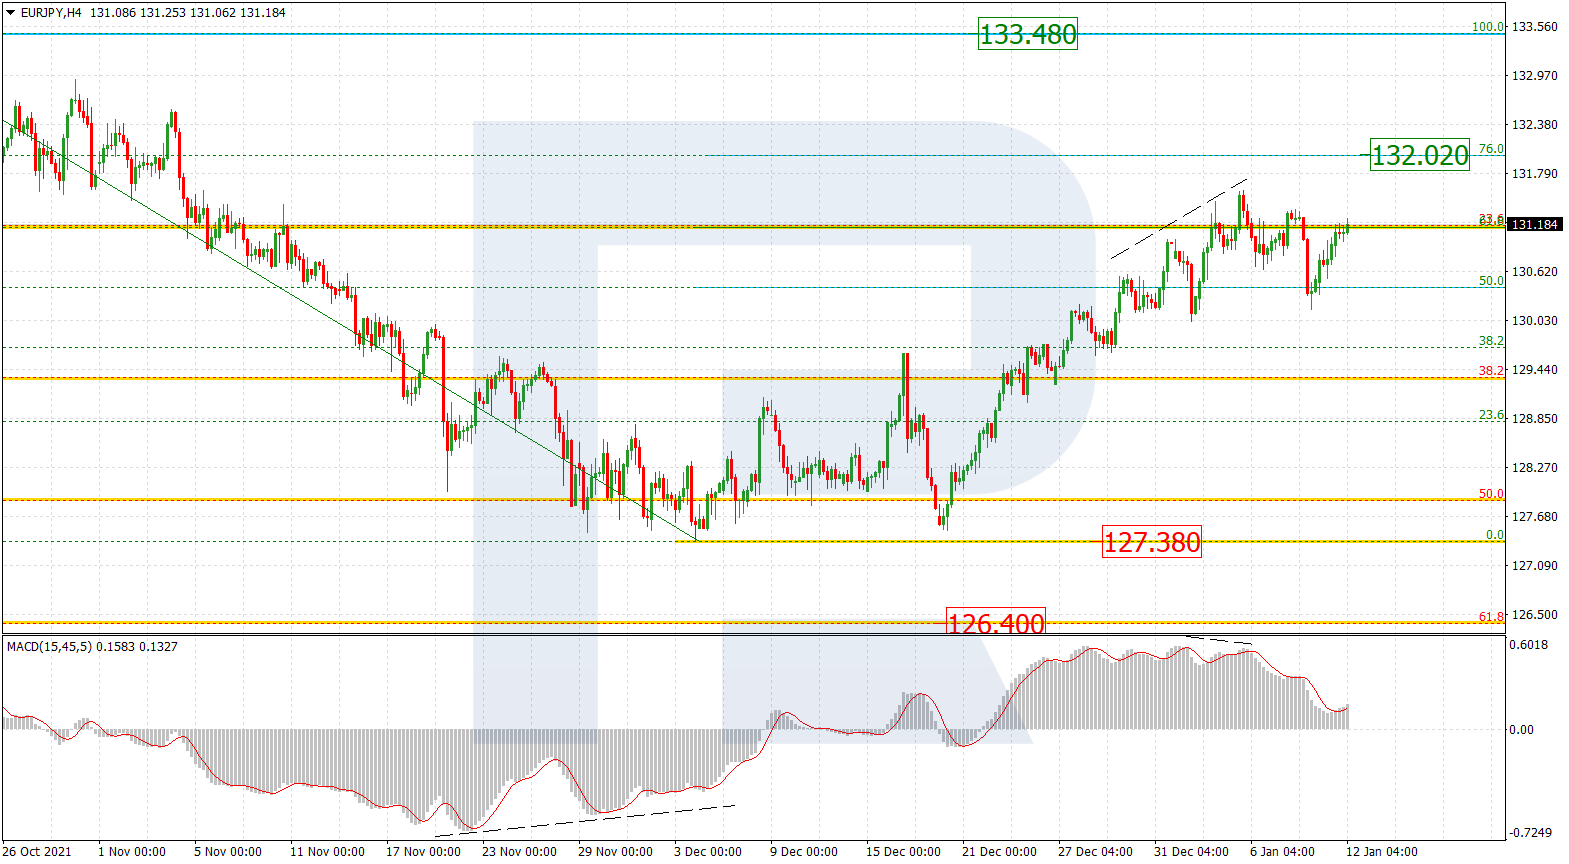
As we can see in the H4 chart, having completed a slight correction, EURJPY is moving upwards; it may soon update the local high and continue growing to reach 76.0% fibo at 132.02. After testing the high, the asset may start a new correction to the downside before attacking the high at 133.48. The support remains at the low at 127.38.

EURJPY_H4
Risk Warning: the result of previous trading operations do not guarantee the same results in the future

The H1 chart shows that the pair may is growing towards the local high at 131.60. If the asset fails to break it, the price may start a new short-term decline to reach 38.2%, 50.0%, and 61.8% fibo at 129.99, 129.49, and 128.99 respectively.

EURJPY_H1

Article By RoboForex.com

Attention!
Forecasts presented in this section only reflect the author’s private opinion and should not be considered as guidance for trading. RoboForex LP bears no responsibility for trading results based on trading recommendations described in these analytical reviews.

Murrey Math Lines 12.01.2022 (USDJPY, USDCAD)

Article By RoboForex.com

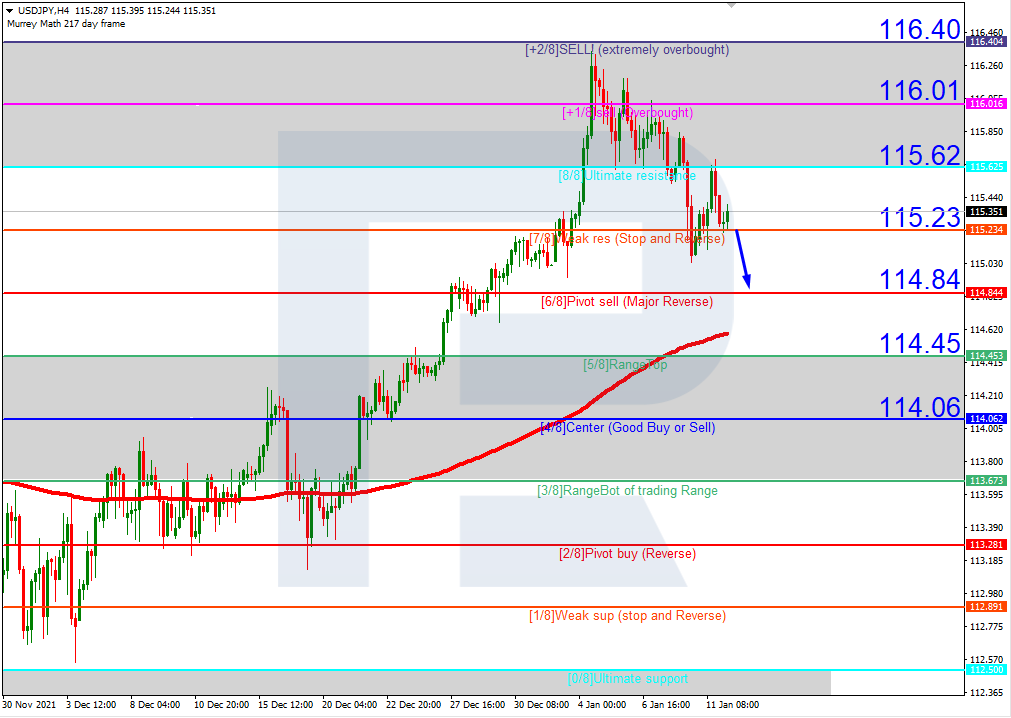
USDJPY, “US Dollar vs. Japanese Yen”

As we can see in the H4 chart, USDJPY has rebounded from the resistance at 8/8. In this case, the price is expected to break 7/8 and correct downwards to reach the support at 6/8. However, this scenario may no longer be valid if the price breaks 8/8 to the upside. After that, the instrument may reverse and grow towards the resistance at +2/8.

USDJPYH4
Risk Warning: the result of previous trading operations do not guarantee the same results in the future

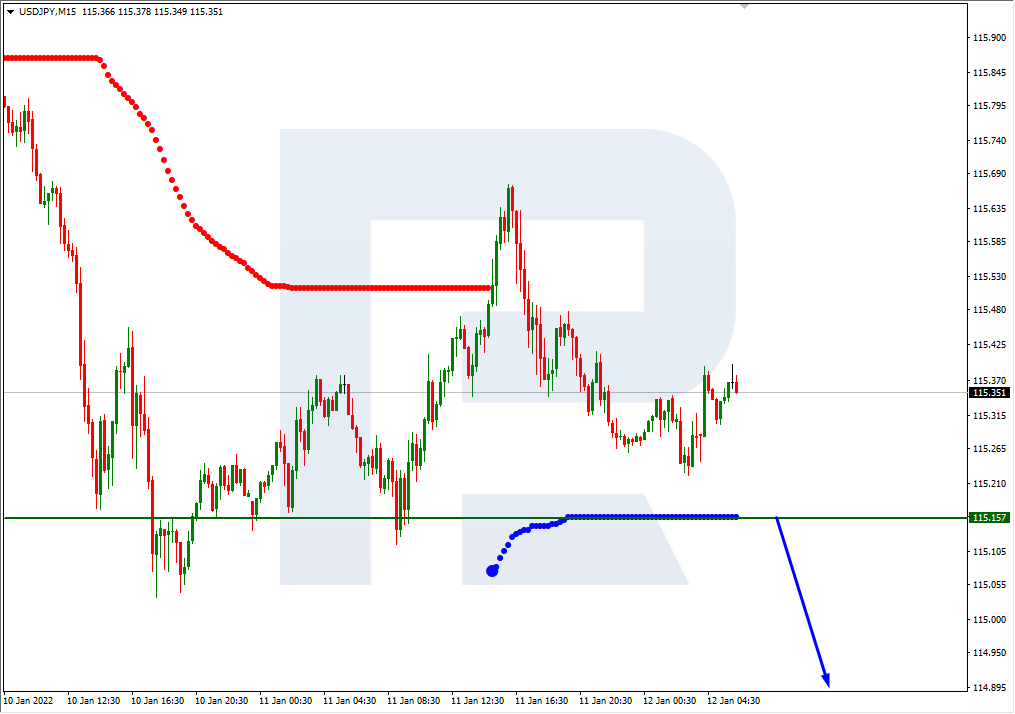
In the M15 chart, the pair may break the downside line of the VoltyChannel indicator and, as a result, continue falling.

USDJPY_M15
Risk Warning: the result of previous trading operations do not guarantee the same results in the future

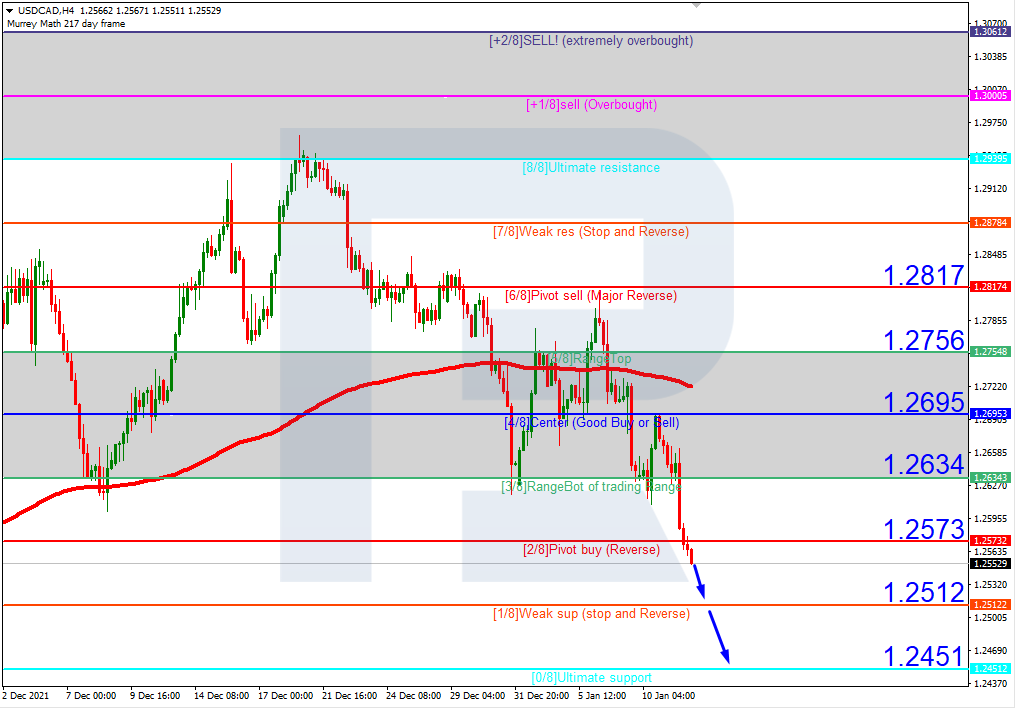
USDCAD, “US Dollar vs Canadian Dollar”

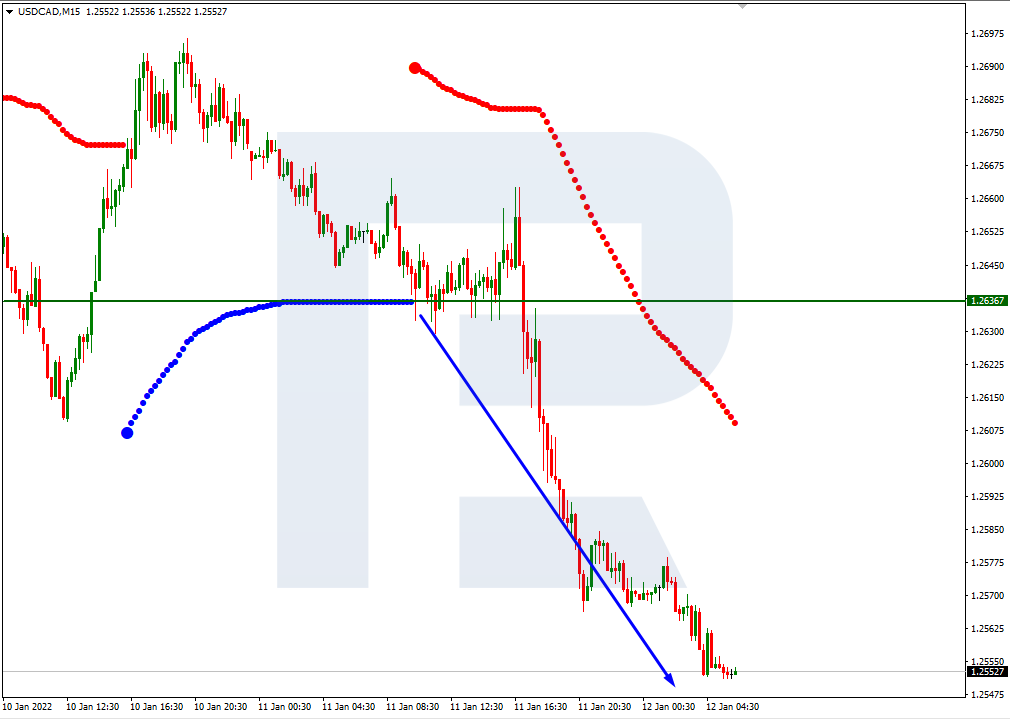
In the H4 chart, USDCAD is trading below the 200-day Moving Average, thus indicating a descending tendency. In this case, the price is expected to test 1/8, break it, and continue falling towards the support at 0/8. Still, this scenario may no longer be valid if the price breaks the resistance at 2/8 to the upside. After that, the instrument may correct upwards to reach 4/8.

USDCAD_H4
Risk Warning: the result of previous trading operations do not guarantee the same results in the future

As we can see in the M15 chart, the pair has broken the downside line of the VoltyChannel indicator and, as a result, may continue trading downwards.

USDCAD_M15

Article By RoboForex.com

Attention!
Forecasts presented in this section only reflect the author’s private opinion and should not be considered as guidance for trading. RoboForex LP bears no responsibility for trading results based on trading recommendations described in these analytical reviews.

The Analytical Overview of the Main Currency Pairs on 2022.01.12

by JustForex

The EUR/USD currency pair

Technical indicators of the currency pair:
  • Prev Open: 1.1322
  • Prev Close: 1.1368
  • % chg. over the last day: +0.41%

The head of the Bundesbank said yesterday that inflation would remain elevated in the country for longer than initially expected. At the same time, ECB officials have a different view and believe that inflation will even decrease in the region this year. Over the past week, the ECB’s balance sheet increased by 6.9 billion euros, much less than the previous week’s 53 billion euros. The reduction in the balance of the ECB has a positive effect on the strength of the European currency. However, in the long term, a rate hike by the Fed will provide strong support for the dollar index, which will be reflected in the EURUSD quotes by a fall.

Trading recommendations
  • Support levels: 1.1330, 1.1305, 1.1288, 1.1271
  • Resistance levels: 1.1369, 1.1385, 1.1436, 1.1535, 1.1613, 1.1667, 1.1717

From a technical point of view, the EUR/USD trend on the hour time frame is bullish. The European currency is strengthening. But the price is now strongly deviating from its averages, while the MACD is pointing to the divergence, traders should expect a corrective movement downwards. Under such market conditions, it is better to consider sell deals from the 1.1369 resistance level, but with additional confirmation. Buy trades can be considered on the lower time frames from the support level 1.1330, but only with additional confirmation in the form of the buyers’ initiative.

Alternative scenario: if the price breaks down through the 1.1288 support level and fixes below, the mid-term uptrend will be broken.

EUR/USD
News feed for 2022.01.12:
  • – Eurozone Industrial Production (m/m) at 12:00 (GMT+2);
  • – US Consumer Price Index (m/m) at 15:30 (GMT+2).

The GBP/USD currency pair

Technical indicators of the currency pair:
  • Prev Open: 1.3570
  • Prev Close: 1.3633
  • % chg. over the last day: +0.46%

The British pound is strengthening for two main reasons. Firstly, the Bank of England raised its key interest rate in December and is likely to raise it again in February. Secondly, the 3-month LIBOR rates on the interbank lending market are two times higher than similar rates on the dollar index.

Trading recommendations
  • Support levels: 1.3601, 1.3581, 1.3551, 1.3528, 1.3396, 1.3352, 1.3257, 1.3220
  • Resistance levels: 1.3685

On the hourly time frame, the GBP/USD trend is bullish. The price is rising steadily, but the MACD indicator is still signaling divergence. Under such market conditions, traders should consider buy positions from the support level 1.3601 or 1.3581 but only with additional confirmation in the form of a buyers’ initiative. Sell trades can be considered from the resistance level of 1.3685.

Alternative scenario: if the price breaks down through the 1.3528 support level and consolidates below, the bearish scenario will likely resume.

GBP/USD
There is no news feed for today.

The USD/JPY currency pair

Technical indicators of the currency pair:
  • Prev Open: 115.15
  • Prev Close: 115.29
  • % chg. over the last day: +0.12%

Japan’s central bank governor Haruhiko Kuroda said today that the economy is on the road to recovery, accompanied by rising inflation. At the same time, Mr. Kuroda added that consumer inflation is likely to accelerate gradually due to rising energy costs and the expected increase in demand. The US consumer inflation data will be released today. Investors believe that inflation will exceed 7% in annual terms, which might lead to a sharp upward movement of the USD index, which in turn will be reflected in the USDJPY price growth.

Trading recommendations
  • Support levels: 115.09, 113.74
  • Resistance levels: 115.34, 115.64, 116.08, 116.50

The global USD/JPY currency pair trend is bullish. But the price is trading near the priority change level. The MACD indicator has become inactive. It is best to look for buy deals from the support levels on the lower time frames, near the priority change level. Sell positions are better to look from the resistance level of 115.64, but only with confirmation and with short targets.

Alternative scenario: if the price fixes below 115.09, the uptrend will likely be broken.

USD/JPY
News feed for 2022.01.12:
  • – Japan BOJ Gov Kuroda’s Speech at 03:00 (GMT+2).

The USD/CAD currency pair

Technical indicators of the currency pair:
  • Prev Open: 1.2675
  • Prev Close: 1.2571
  • % chg. over the last day: -0.82%

The Canadian dollar is a commodity currency, so it depends not only on the monetary policy of the Bank of Canada but also on the oil prices and the dollar index. Yesterday, oil prices jumped 4% ahead of weekly data on inventories and US consumer price index data. The rise in oil prices strengthens the Canadian dollar, which leads to a decline in USD/CAD quotes.

Trading recommendations
  • Support levels: 1.2502
  • Resistance levels: 1.2628, 1.2689, 1.2715, 1.2792, 1.2824, 1.2903, 1.2951

From a technical point of view, the USD/CAD currency pair is bearish. The price is steadily declining. But the MACD indicator began to signal a divergence. Under such market conditions, it is better to look for buy trades from 1.2503. It is best to look for sell deals from the resistance levels around the moving average or from the descending local trend line.

Alternative scenario: if the price breaks through the 1.2689 resistance level and fixes above, the downtrend is likely to be broken.

USD/CAD
There is no news feed for today.

by JustForex


This article reflects a personal opinion and should not be interpreted as an investment advice, and/or offer, and/or a persistent request for carrying out financial transactions, and/or a guarantee, and/or a forecast of future events.

GBPUSD Primary Zigzag Wave Ⓩ To Lower Prices

By Orbex

GBPUSD

The formation of the GBPUSD currency pair suggests the development of a large intervening wave x of the cycle degree. This most likely takes the form of a triple Ⓦ-Ⓧ-Ⓨ-Ⓧ-Ⓩ zigzag of the primary degree.

Most likely, the first four parts of this construction, that is the primary sub-waves Ⓦ-Ⓧ-Ⓨ-Ⓧ, have already completed their pattern fully. It is likely that the growth in the second intervening wave Ⓧ has come to an end. It looks fully formed with a double zigzag (W)-(X)-(Y) of the intermediate degree.

Thus, if the intervening wave Ⓧ is completed, then shortly a price decrease is expected in the final primary wave Ⓩ. It will probably take the form of an intermediate zigzag (A)-(B)-(C).

The end of the market decline in this wave could reach the level of 1.297. At that level, wave Ⓩ will be at 76.4% of primary wave Ⓨ.

GBPUSD

An alternative scenario shows the primary double Ⓦ-Ⓧ-Ⓨ zigzag ended. This could indicate the beginning of the development of the cycle actionary wave y.

In the next coming trading weeks, we can anticipate the development of primary sub-waves Ⓧ-Ⓩ, as shown in the chart.

The end of the wave Ⓧ is possible in the area of the 1.343 level. Then wave Ⓩ will most likely strive for equality with wave Ⓨ and could end around the 1.386 mark.


Orbex-LogoArticle by Orbex

Orbex is a fully licensed broker that was established in 2011. Founded with a mission to serve its traders responsibly and provides traders with access to the world’s largest and most liquid financial markets. www.orbex.com

Jerome Powell’s comments calmed investors and the stock market

by JustForex

In his speech to the US Senate, Fed Chairman Jerome Powell calmed down a little concerned about monetary policy tightening. Mr. Powell confirmed that the Fed plans to begin policy normalization, including ending bond purchases, raising rates, and allowing bonds on the balance sheet to mature later this year.

Key points from Powell’s speech:

  • The Fed still intends to complete the QE reduction in March;
  • There is a possibility that we will start cutting the balance sheet in 2022;
  • The economy no longer needs stimulative monetary policy;
  • The labor market is recovering quickly;
  • The acceleration of inflation is due in large part to the pandemic;
  • If necessary, we will start using tools to reduce inflation;
  • Inflationary pressures are very likely to last until mid-2023;
  • If more aggressive rate hikes are needed to lower inflation, the Fed will do so;
  • The Committee has not made any decision on the timing of rate hikes. We have to be nimble.

At the end of the day, the S&P 500 stock index (US500) increased by 0.92%, the Dow Jones Industrial Average (US30) added 0.51%, and the Nasdaq technology index (US100) jumped by 1.4%.

Investors know that the most powerful leverage the Fed can pull right now is to start cutting its balance sheet by selling bonds. Reducing the balance sheet will immediately have a negative effect on the stock market. However, while the excess dollar liquidity in the US banking system is still high and exceeds $1.5 trillion, investment banks and hedge funds will buy stock market drawdowns and move major indices up.

The recent pullback in the tech sector was precisely due to concerns that the Fed would be more hawkish and more aggressive in its policy going forward. However, Jerome Powell calmed the markets in his speech yesterday, which caused the tech sector to rise yesterday.

Analysts at JPMorgan believe that four 0.25% rate hikes will have little impact on the economy.

Yesterday, Fed member Bostick indicated that he expected three rate hikes in 2022, with risks pointing to a fourth increase due to the possibility of higher inflation. March is the right time for the first hike.

The US consumer inflation data will be released today. Investors are confident that inflation will exceed 7% in annual terms, which will be a record high in the last 40 years.

In the US, 1.35 million cases of coronavirus infection were detected overnight – an all-time pandemic record.

On Tuesday, major European stock indexes increased on positive statistics and strong corporate reports. The British FTSE 100 (UK100) gained 0.6%, German DAX (DE30) added 1.1%, French CAC 40 (FR40) jumped by 0.92%, Spanish IBEX 35 (ES35) increased by 0.66%, and Italian FTSE MIB added 0.68%. In December, the UK retail sales were well above pre-crisis levels, despite a new rise in COVID-19 in the country. Meanwhile, Spain’s industrial production jumped by 4.8% in annual terms in November, the highest since June 2021.

Oil jumped 4% ahead of weekly US inventory data. Oil buyers are betting on supply cuts due to expected demand. There is also information that hedge funds are buying oil in anticipation of sanctions against Russia. Large speculators have bought more than 100 million barrels in three weeks. The US Department of Energy predicts that the price of Brent crude will drop to $75/bbl in 2022 and $68/bbl in 2023.

Gold increased for the third day in a row on expectations of higher inflation in the US. Investors are betting that US consumer inflation will be above 7% and are buying gold as a hedge against inflation. However, it’s should be noted that gold failed its hedging mission several times last year since the dollar index and US Treasury yields, which have an inverse correlation to precious metals, rose on expectations of rising rates.

Main market quotes:

S&P 500 (F) (US500) 4,713.07 +42.78 (+0.92%)

Dow Jones (US30) 36,252.02 +183.15 (+0.51%)

DAX (DE40) 15,941.81 +173.54 (+1.10%)

FTSE 100 (UK100) 7,491.37 +46.12 (+0.62%)

USD Index 95.60 -0.39 (-0.41%)

Important events for today:
  • – Japan BOJ Gov Kuroda’s Speech at 03:00 (GMT+2);
  • – China Consumer Price Index (q/q) at 03:30 (GMT+2);
  • – China Producer Price Index (q/q) at 03:30 (GMT+2);
  • – Eurozone Industrial Production (m/m) at 12:00 (GMT+2);
  • – US Consumer Price Index (m/m) at 15:30 (GMT+2);
  • – US Crude Oil Reserves (w/w) at 17:30 (GMT+2).

by JustForex


This article reflects a personal opinion and should not be interpreted as an investment advice, and/or offer, and/or a persistent request for carrying out financial transactions, and/or a guarantee, and/or a forecast of future events.

Dollar Softens Ahead Of CPI Data

Lukman Otunuga

By Lukman Otunuga Senior Research Analyst, ForexTime

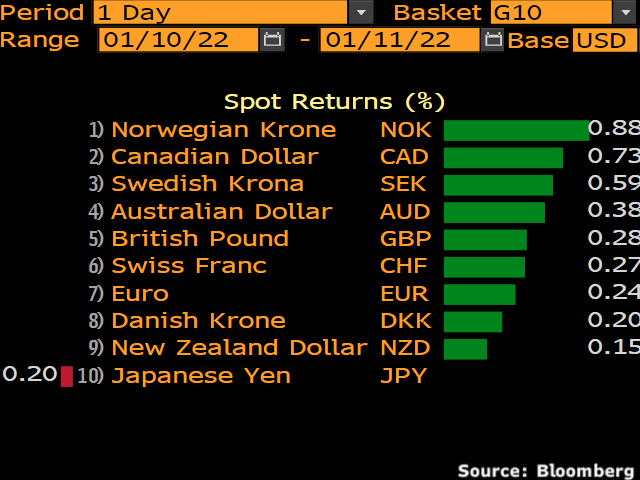
King dollar loosened its grip on the FX throne today, weakening against all G10 currencies excluding the Japanese Yen.

Dollar bulls were missing in action, even after Federal Reserve Chairman Jerome Powell stated during his Senate confirming hearing that the central bank was likely to raise interest rates this year. Given all the hype and mounting anticipation around the U.S. inflation data on Wednesday afternoon, the next few hours could become tense and nervy. We could experience a calm before the raging storm with dollar volatility certainly on the cards. In the meantime, this will be another evening where I wear my technical analysis hat, searching for potential trading setups on dollar crosses before the big event tomorrow!

Dollar Index (DXY) approaches support

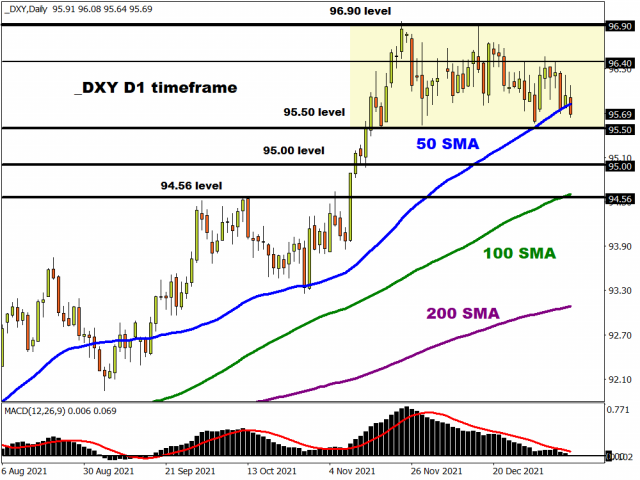
The DXY is inching closer to the 95.50 support level on the daily charts. A strong daily close below this level may open the doors towards 95.00 and 94.56. Should 95.50 prove to be reliable support, a rebound back towards 96.40 and 96.60 could become reality.

EURUSD same old story…

It pretty much felt like watching paint dry when looking at the EURUSD’s recent price action.

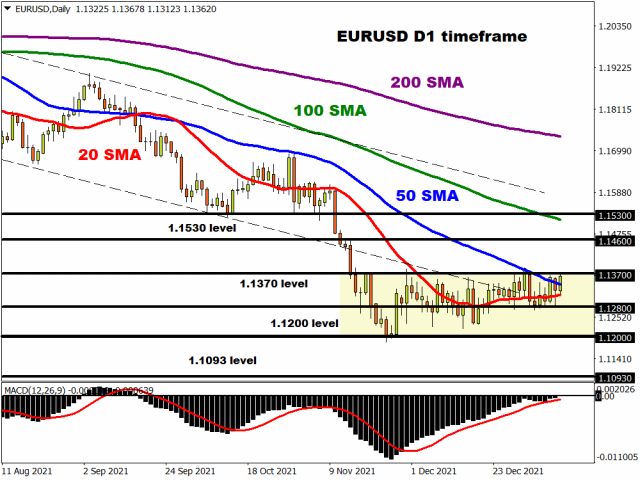
The currency pair remains trapped within a range with support at 1.1200 and resistance at 1.1370. A breakout could be on the horizon with a fresh fundamental catalyst getting the gears moving. Should bulls break above 1.1370, prices could test 1.1460 and 1.1530, respectively. A decline back below 1.1280 could signal a selloff towards 1.1200.

GBPUSD pushes higher

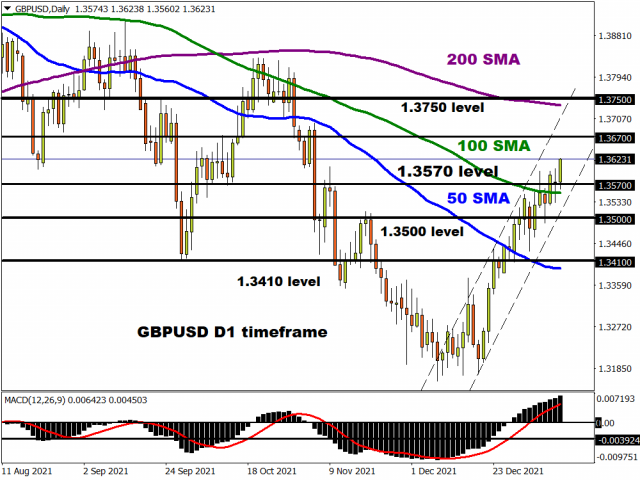
The GBPUSD has hit its highest level since November 4th.

Pound bulls remain supported by expectations over the Bank of England raising interest rates as early as next month. Talking technical, the upside momentum may push prices towards 1.3670 and 1.3750. Should 1.3570 prove to be unreliable support, prices may decline back towards 1.3500 and 1.3410.

AUDUSD set to head north?

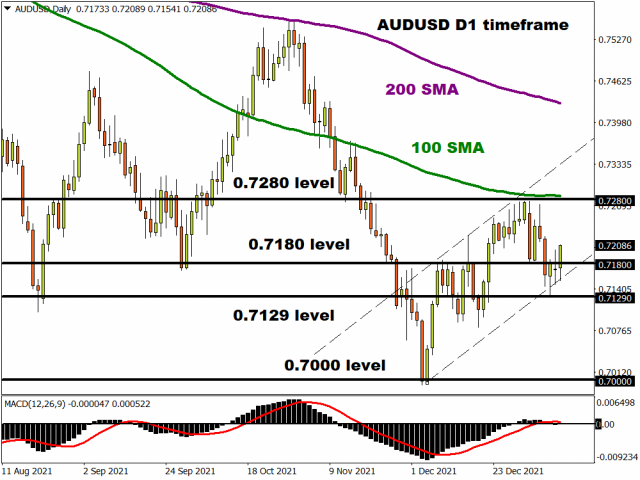
After creating a new higher low at 0.7129, bulls seem to be back in action.

However, the road ahead could be rocky and filled with a couple of obstacles. The MACD remains flat while resistance can be found at 0.7280 which is just above the 100-day Simple Moving Average. If bulls tire before reaching this point, prices may decline back towards 0.7180 and 0.7129.

USDJPY lingers below 115.50

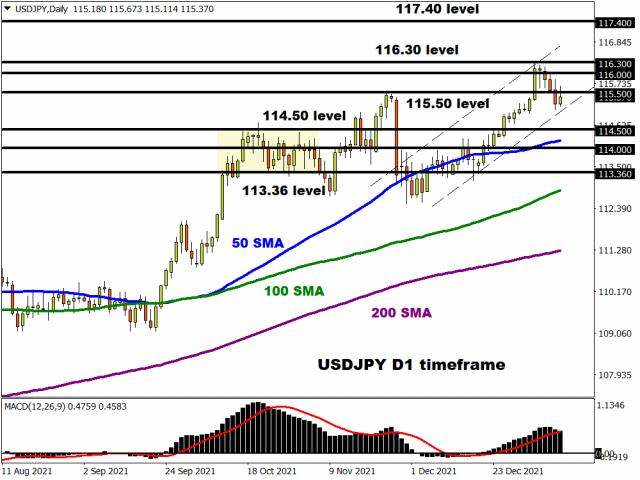
It will be interesting to see whether the USDJPY can push back above 115.50 or use this level as resistance to trade lower.

Sustained weakness below 115.50 could trigger a selloff towards 114.50, 114.00, and 113.360, respectively. Should bulls break above 115.50, this could suggest the resumption of the uptrend. Such an outcome may open doors towards 116.00, 116.30, and 117.40.

Disclaimer: The content in this article comprises personal opinions and should not be construed as containing personal and/or other investment advice and/or an offer of and/or solicitation for any transactions in financial instruments and/or a guarantee and/or prediction of future performance. ForexTime (FXTM), its affiliates, agents, directors, officers or employees do not guarantee the accuracy, validity, timeliness or completeness, of any information or data made available and assume no liability as to any loss arising from any investment based on the same.


Forex-Time-LogoArticle by ForexTime

ForexTime Ltd (FXTM) is an award winning international online forex broker regulated by CySEC 185/12 www.forextime.com