Ichimoku Cloud Analysis 04.03.2022 (XAGUSD, AUDUSD, EURGBP)

Article By RoboForex.com

XAGUSD, “Silver vs US Dollar”

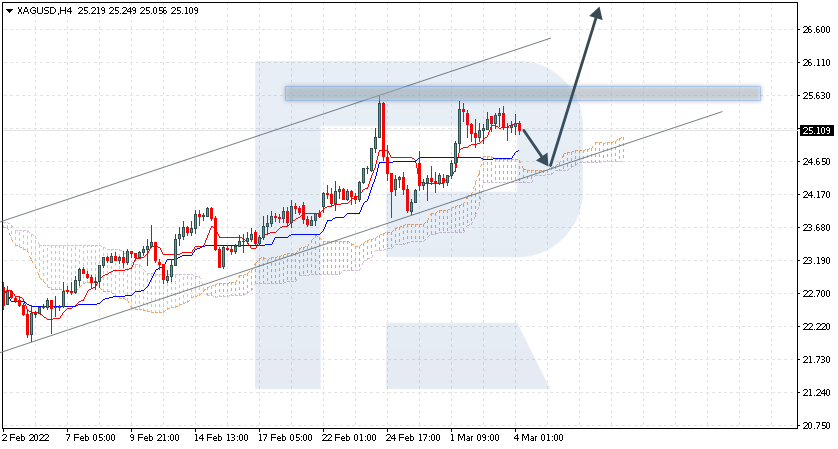
XAGUSD is trading at 25.10; the instrument is moving above Ichimoku Cloud, thus indicating an ascending tendency. The markets could indicate that the price may test the cloud’s upside border at 24.65 and then resume moving upwards to reach 26.95. Another signal in favour of a further uptrend will be a rebound from the rising channel’s downside border. However, the bullish scenario may no longer be valid if the price breaks the cloud’s downside border and fixes below 24.05. In this case, the pair may continue falling towards 23.15. To confirm further growth, the asset must break the resistance level and fix above 25.85.

XAGUSD
Risk Warning: the result of previous trading operations do not guarantee the same results in the future

AUDUSD, “Australian Dollar vs US Dollar”

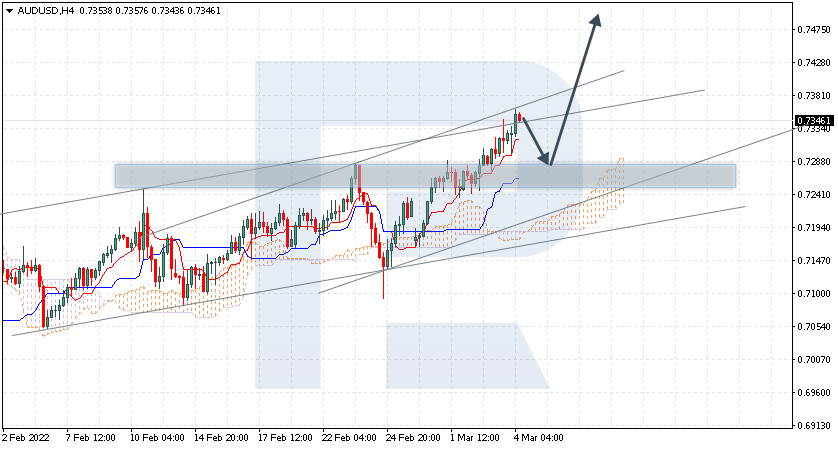
AUDUSD is trading at 0.7346; the instrument is moving above Ichimoku Cloud, thus indicating an ascending tendency. The markets could indicate that the price may test Tenkan-Sen and Kijun-Sen at 0.7285 and then resume moving upwards to reach 0.7485. Another signal in favour of a further uptrend will be a rebound from the support level. However, the bullish scenario may no longer be valid if the price breaks the cloud’s downside border and fixes below 0.7135. In this case, the pair may continue falling towards 0.7045. To confirm further growth, the asset must break the rising channel’s upside border and fix above 0.7385.

AUDUSD
Risk Warning: the result of previous trading operations do not guarantee the same results in the future

EURGBP, “Euro vs Great Britain Pound”

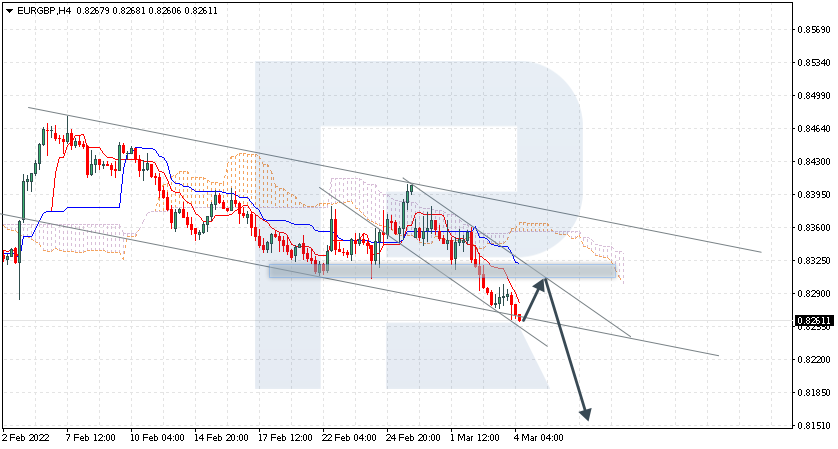
EURGBP is trading at 0.8261; the instrument is moving below Ichimoku Cloud, thus indicating a descending tendency. The markets could indicate that the price may test Tenkan-Sen and Kijun-Sen at 0.8305 and then resume moving downwards to reach 0.8155. Another signal in favour of a further downtrend will be a rebound from the descending channel’s upside border. However, the bearish scenario may no longer be valid if the price breaks the cloud’s upside border and fixes above 0.8395. In this case, the pair may continue growing towards 0.8485. To confirm further decline, the asset must break the descending channel’s downside border and fix below 0.8235.

EURGBP

Article By RoboForex.com

Attention!
Forecasts presented in this section only reflect the author’s private opinion and should not be considered as guidance for trading. RoboForex LP bears no responsibility for trading results based on trading recommendations described in these analytical reviews.

The Analytical Overview of the Main Currency Pairs on 2022.03.04

by JustForex

The EUR/USD currency pair

Technical indicators of the currency pair:
  • Prev Open: 1.1115
  • Prev Close: 1.1065
  • % chg. over the last day: -0.45%

The euro had its worst week against the dollar in nine months as the war in Ukraine, and the prospect of continued high commodity prices continue to dampen economic growth expectations in Europe. Analysts believe that all sanctions that are directly or indirectly imposed on Russia will also affect European countries.

Trading recommendations
  • Support levels: 1.1032
  • Resistance levels: 1.1213, 1.1273, 1.1392, 1.1459

From the technical point of view, the trend on the EUR/USD currency pair on the hourly time frame is bearish. The MACD indicator is in the negative area, but there are signs of divergence to the buying side. There is a narrowing of liquidity. Under such market conditions, it is best to look for sell trades on intraday time frames from the resistance level of 1.1213. Buy trades should be considered from the support level of 1.1032, but only after an additional confirmation in the form of a buyers’ initiative.

Alternative scenario: if the price breaks out through the 1.1213 resistance level and fixes above, the mid-term uptrend will likely resume.

EUR/USD
News feed for 2022.03.04:
  • – Eurozone Retail Sales (m/m) at 12:00 (GMT+2);
  • – US Nonfarm Payrolls (m/m) at 15:30 (GMT+2);
  • – US Unemployment Rate (m/m) at 15:30 (GMT+2).

The GBP/USD currency pair

Technical indicators of the currency pair:
  • Prev Open: 1.3401
  • Prev Close: 1.3348
  • % chg. over the last day: -0.40%

The British pound looks more stable than the euro. The UK economy is not so strongly connected with the Russian economy, so sanctions against the aggressor country will not harm the economic development of the UK.

Trading recommendations
  • Support levels: 1.3315, 1.3382, 1.3274, 1.3220
  • Resistance levels: 1.3442, 1.3486, 1.3529, 1.3560

On the hourly time frame, the GBP/USD currency pair trend is bearish. Volatility remains high, and the price is trading in a wide corridor. Under such market conditions, buy trades should be considered from the support level of 1.3315, but it is better with confirmation. The resistance level of 1.3442 is good for sell deals, but only with additional confirmation in the form of sellers’ initiative.

Alternative scenario: if the price breaks out through the 1.3442 resistance level and fixes above, the mid-term uptrend will likely resume.

GBP/USD
News feed for 2022.03.04:
  • – UK Construction PMI (m/m) at 11:30 (GMT+2).

The USD/JPY currency pair

Technical indicators of the currency pair:
  • Prev Open: 115.52
  • Prev Close: 115.46
  • % chg. over the last day: -0.05%

Prime Minister Kishida wants the new BOJ governor to work to end deflation. Markets are anticipating a change in leadership at the Bank of Japan (BOJ), anticipating possible changes in its massive asset purchases and yield curve controls, which have failed to raise inflation to its 2% target and have drawn criticism for hurting financial institutions’ profits. At the moment, the Bank of Japan is actively stimulating the economy with money, as the US Federal Reserve did last year.

Trading recommendations
  • Support levels: 114.86, 114.78, 114.41
  • Resistance levels: 115.69, 115.87, 116.32

The medium-term trend on the USD/JPY currency pair is bullish, but the structure is flatter, as the price has no single dynamics. The MACD indicator has become negative. Under such market conditions, it is best to look for buy deals on the lower time frames from the support level of 114.86, but with additional confirmation. For sell deals, a resistance level of 115.69 may be considered, but it is better to wait for the reaction of sellers.

Alternative scenario: if the price fixes below 114.86, the uptrend will likely be broken.

USD/JPY
There is no news feed for today.

The USD/CAD currency pair

Technical indicators of the currency pair:
  • Prev Open: 1.2629
  • Prev Close: 1.2679
  • % chg. over the last day: +0.39%

On Wednesday, the Bank of Canada raised its benchmark interest rate to 0.5%, the first in a series of small rate hikes this year to fight inflation that has reached its highest level in decades. Large foreign buyers are boycotting Russian oil because of the situation around Ukraine, trying to find alternative sources of supply, which is likely to push oil prices further. Disruptions to Russian oil exports due to Western sanctions outweigh the prospect of increased supplies from Iran due to a possible nuclear deal. However, if sanctions on Iran are lifted, oil prices may correct significantly.

Trading recommendations
  • Support levels: 1.2653, 1.2555, 1.2517
  • Resistance levels: 1.2723 1.2797

From the point of view of technical analysis, the USD/CAD currency pair trend is bearish. The MACD indicator has become positive, and the local downtrend line has been broken. Trade only with short targets because both oil and the dollar index are now inclined to grow. Under such market conditions, it is better to look for buy trades on the lower time frames from the support level of 1.2653, but it is better with additional confirmation. For sell deals, it is better to consider the resistance level of 1.2723.

Alternative scenario: if the price breaks through and consolidates above 1.2723, the downtrend will likely be broken.

USD/CAD
News feed for 2022.03.04:
  • – Canada Unemployment Rate (m/m) at 15:30 (GMT+2);
  • – Canada Ivey PMI (m/m) at 17:00 (GMT+2).

by JustForex


This article reflects a personal opinion and should not be interpreted as an investment advice, and/or offer, and/or a persistent request for carrying out financial transactions, and/or a guarantee, and/or a forecast of future events.

Financial markets are now completely dependent on the geopolitical situation in Eastern Europe

by JustForex

Wall Street closed in the red due to continued uncertainty surrounding the war in Ukraine. Russian terrorists are simply bombing Ukrainian cities and shooting civilians (in Kharkiv, Chernihiv, Sumy, Kyiv, and many smaller towns like Borodyanka). The number of civilian casualties is growing rapidly. Ukraine asks NATO countries to close the sky over Ukraine, but NATO refuses because it will directly interfere with the alliance in the war with Russia. As the stock market closed, the Dow Jones Index (US30) decreased by 0.29%, the S&P 500 Index (US500) lost 0.53%, and the NASDAQ Technology Index (US100) fell by 1.54%.

The US Financial Institutions Regulatory Authority (FINRA) has frozen over-the-counter trading in shares of several Russian companies listed in the United States.

Ukraine’s Zaporizhzhia nuclear power plant, the largest of its kind in Europe, caught fire on Friday morning after being attacked by Russian forces. Russian troops continued to surround and attack Ukrainian cities.

Mariupol, the main port on the Sea of Azov, was surrounded and heavily bombarded. Water and electricity have been cut off, and officials say they cannot evacuate the wounded. A video posted to Twitter from Mariupol and confirmed by Reuters shows parked cars on fire and continuous gunfire echoing in nearby apartment buildings.

Russian terrorists have captured the city of Kherson in southern Ukraine. Russian propaganda began to be broadcast on TV channels, and a crowd gathered the city to film footage of Kherson “joyfully” welcoming the Russian army. The same thing happened at the time in Donetsk and Luhansk. This is a tactic of Russian terrorists.

European stocks continue to decline amid fears about the consequences of sanctions against Russia. The German DAX (DE30) decreased by 2.16%, the French CAC 40 (FR40) lost 1.84%, the Spanish IBEX 35 (ES35) fell by 3.72%, and the British FTSE 100 (UK100) lost 2.57%. According to analysts, the rise in commodity prices after Russia’s attack on Ukraine, especially oil and natural gas, has reached such proportions that a further depreciation of the euro could drive inflation out of control in Europe. However, the ECB has been reluctant to respond to the situation so far, and it’s likely that the ECB’s monetary policy will not change until the second half of 2022. The impact of rising energy and gas prices could undermine the recovery in industrial and private consumption that was expected after the easing of COVID-19 restrictions and is likely to slow the normalization of European Central Bank policy.

Meanwhile, the London Stock Exchange (LSE) stopped trading in Russian companies’ depositary receipts, including Sberbank, Gazprom, Lukoil, EN+, and Polyus. The Bank of Russia decided not to resume trading on the Moscow Exchange today (for the fifth day in a row). At the same time, the Moscow Exchange imposed a ban on short sales on the euro in the foreign exchange and stock markets. Russian authorities have banned Russian brokers from selling securities owned by foreigners. Investors are trying to get out of Russian investments, but this is complicated by the suspension of trading and Moscow’s ban on the sale of foreign assets.

Asian markets are down today from the opening session. Japan’s Nikkei 225 (JP225) lost 2.23%, Hong Kong’s Hang Seng (HK50) decreased by 2.50%, Australia’s S&P/ASX 200 (AU200) lost 0.57%. Japan’s Nikkei index on Friday posted its biggest drop in almost two weeks amid an escalating situation in Ukraine. Japan’s unemployment rate increased to 2.8% in January 2022 from 2.7% a month earlier.

China’s pursuit of “shared prosperity” in the short term will focus on narrowing the growing wealth gap and shaping the country’s approach to regulating with sectors deemed critical to the economy. Analysts expect the move to see the real estate sector receive more support from regulators, which accounts for a quarter of the economy. At the same time, Internet firms and technology companies will be targeted for repression due to the misallocation of capital.

Main market quotes:

S&P 500 (F) (US500) 4,363.49 -23.05 (-0.53%)

Dow Jones (US30) 33,794.66 -96.69 (-0.29%)

DAX (DE40) 13,698.40 -301.71 (-2.16%)

FTSE 100 (UK100) 7,238.85 -190.71 (-2.57%)

USD Index 97.74 +0.35 (+0.36%)

Important events for today:
  • – Japan Unemployment Rate (m/m) at 01:30 (GMT+2);
  • – UK Construction PMI (m/m) at 11:30 (GMT+2);
  • – Eurozone Retail Sales (m/m) at 12:00 (GMT+2);
  • – US Nonfarm Payrolls (m/m) at 15:30 (GMT+2);
  • – US Unemployment Rate (m/m) at 15:30 (GMT+2);
  • – Canada Unemployment Rate (m/m) at 15:30 (GMT+2);
  • – Canada Ivey PMI (m/m) at 17:00 (GMT+2).

by JustForex


This article reflects a personal opinion and should not be interpreted as an investment advice, and/or offer, and/or a persistent request for carrying out financial transactions, and/or a guarantee, and/or a forecast of future events.

Dollar hits the highs as war brings tragic uncertainty

By The Market Research Team, ForexTime

The “fog of war” is often used during times of conflict with news flow stifled and unclear.

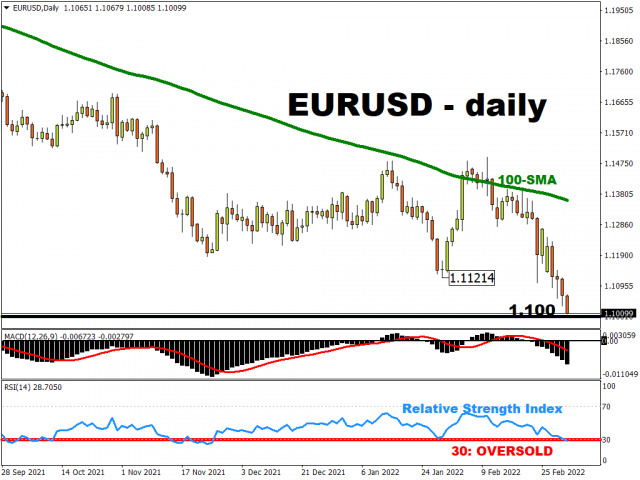
This is especially true in the current climate with traders trying to view the latest headlines coming out of Ukraine. Asian stock markets, and European and US futures are trading lower on news that fighting has reached Europe’s biggest nuclear plant. The euro has tumbled again, on reports that Russian forces have captured Europe’s largest nuclear plant in the Ukraine, and is close to 1.10 in EUR/USD.

Europe, the ECB and conflict

Euro assets have been hit hard and remain vulnerable.

The Russian offensive and its impact on eurozone growth is currently estimated in the region of 0.5-1.5% and the ECB is already making noises about treading very carefully when it comes to future monetary policy. Indeed, it is highly likely to express solidarity with Ukraine and express a cautious stance at its meeting next week. This comes after the latest minutes of February’s ECB meeting confirmed increasing unease about ultra-loose policy and a growing willingness to start normalising.

But this was before the Ukrainian crisis blew up.

This means all-important ECB staff projections will be stale next week and not take into account the rampant commodity prices seen recently. Policymakers will be in a very tough spot with stagflation fears growing. This is a situation of slow growth and high inflation, which frankly, is only going one way in the current environment.

EUR/USD has made new lows again today and is rapidly closing in on 1.10.

This is a key psychological level, and many traders expect it to be defended with huge options and stops around here. But the single currency is unloved and showing limited signs of reversal of its decline since early February.

If we do get a bounce, resistance after the 1.11 zone sits in the mid-figure area.


NFP and a hawkish Fed

Money markets have priced back in some Fed tightening after Chair Powell’s testimony midweek removed some doubts about the bank’s tightening plans. The world’s most powerful central banker all but confirmed a 25bp rate hike at the Fed meeting in March and Fed Fund futures have around six hikes priced back in by the end of the year.

We get the release of the normally all-important monthly NFP data today with consensus expecting a 400k headline print.

There will be focus on wage growth which may have increased to 6% with a drop in unemployment expected. Investors may have more attention on next week’s US CPI figures.

USD/JPY is usually the most volatile major on the release of the employment report, but the conflict in Ukraine has centred much focus on the collapse of euro assets. The yen is an obvious safe haven, but its attractiveness is being hampered by surging commodity and energy costs.

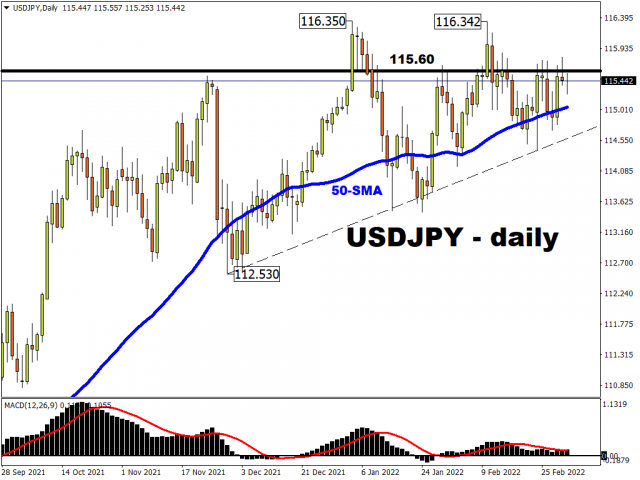
USD/JPY bulls need to close strongly above 115.60 to make gains towards 116.35 and above.


Disclaimer: The content in this article comprises personal opinions and should not be construed as containing personal and/or other investment advice and/or an offer of and/or solicitation for any transactions in financial instruments and/or a guarantee and/or prediction of future performance. ForexTime (FXTM), its affiliates, agents, directors, officers or employees do not guarantee the accuracy, validity, timeliness or completeness, of any information or data made available and assume no liability as to any loss arising from any investment based on the same.


Forex-Time-LogoArticle by ForexTime

ForexTime Ltd (FXTM) is an award winning international online forex broker regulated by CySEC 185/12 www.forextime.com

EURUSD Elliott Wave Analysis 3/4/2022

EURUSD Elliott Wave Analysis: EUR/USD resumes its negative trades to go far away from the 1.1250 level, a significant support level, increasing expectations of continuing the bearish trend until the end of the week.

  • The EUR/USD targets 1.10000 as the next level.
  • Expected trading region for Friday is between support 1.10000 and resistance 1.1250.
  • The direction on the hourly timeframe is a bearish trend.

EURUSD Elliott Wave Analysis On 1 Hour Time-Frame

On the hourly timeframe chart, the EUR/USD is witnessing a sharp fall, and it seems impulsive.

EURUSD Elliott Wave Analysis

There is no optimism for the change of direction unless the EUR/USD exceeds 1.11439.

Suppose that Euro/Dollar is in a bearish wave 5 and now it’s resuming its fall to reach 1.10000, which is considered an important support level for the EURUSD pair.

We don’t encourage you to buy in the current time unless the EUR/USD exceeds at least 1.11439 level.

How To Trade EUR/USD In The Current Time?

EURUSD is in the last bearish wave, and it’s invalid for selling.

Currently, we have to wait.

The EUR/USD should exceed the 1.11439 and 1.12331 levels so that the negative pressure (for buyers) will fade away.

EURUSD News 3/4/2022

The EURUSD is one of the major currencies affected by the war since Europe is at the heart of this conflict.

The Eurozone economy is expected to be affected by the developments of the Ukraine crisis, which will complicate the ECB’s path out of negative interest rate during this year 2022.

By elliottwavemonitor.com


What are nonfarm payrolls and why do markets care?

By Han Tan Chief Market Analyst at Exinity Group

The next nonfarm payrolls (NFP) report will be released at 8:30AM New York time tomorrow (Friday, March 4th).

Even though the Ukraine crisis right now remains a major driver of financial markets, investors and traders worldwide will still be closely monitoring this crucial piece of data out of the US economy.

What are nonfarm payrolls?

Nonfarm payrolls show how many jobs were added, or lost, in the US labor market in a particular month.

The term ‘nonfarm’ is used because the NFP excludes those working on farms due to the seasonal nature of their employment (think of the people hired only when it’s time to harvest a particular crop, but the job ends when the harvest is done).

For example, in January 2022, the nonfarm payrolls rose by 467,000, bringing the total number of people employed in the US closer to 150 million.

Why is the NFP important?

Two main reasons within today’s context:

  1. The NFP indicates how strong or weak the US economy is at that point in time.
  2. The strength of the US economy then dictates how high the Fed can raise interest rates.

Keep in mind that the US is the largest economy in the world and is also the largest consumer economy, having the highest household spending in the world.

American households, on average, spend nearly 3 times more than in any other country.

Hence, more people in the US with jobs (if the NFP reflects a rise in employment) means they have more money and ability to spend on goods and services. Typically, that is a good thing for US businesses (and for their stock prices) as they can sell more of their output to customers and generate more economic activity (expand their businesses, import more raw materials, hire even more workers, etc.).

However, a stronger-than-expected NFP report these days means that interest rates could be raised higher and faster in the US. And the likes of stocks and gold don’t typically enjoy the thought of higher interest rates.

What are markets expecting for the March 4th jobs report?

For the March 4th announcement, markets are forecasting that the US economy added 415,000 more jobs in February.

And it’s not just the NFP that markets will be focused on the first Friday of every month.

Here are some other key data that’s also released within the monthly US jobs report:

  • Unemployment rate (Feb forecast: 3.9%, lower than January’s 4%)
  • Average hourly earnings (Feb forecast: 5.8%, higher than January’s 5.7%)
  • Labor force participation rate (Feb forecast; 62.2%, same as January 2022)

But these figures in and of themselves lack meaning without the accompanying context.

Markets will be interpreting the upcoming US jobs report in terms of how it could affect the Fed’s plans to raise interest rates.

READ MORE: Why are markets obsessed about the Fed?


How might the nonfarm payrolls data influence the Fed?

  • A number larger than 415k should give the Federal Reserve enough confidence to raise rates more frequently this year.
  • On the other hand, a figure that’s much lower than 415k could force the Fed to reduce the frequency and the size of rate hikes planned for this year and beyond.


When is the next Fed meeting?

We’re less than a couple of weeks away from the FOMC’s two-day meeting slated for March 15-16th.

The Fed is widely expected to announce an interest rate hike of 25 basis points later this month, which would be the first of the several hikes slated for this year.

Markets are currently expecting a total of 5 rate hikes in 2022, at 25-basis points for each time the Fed hikes.

Although Fed officials have said that their main objective right now is to bring inflation back under control, the jobs data is also an important consideration before hiking interest rates.

READ MORE: Inflation everywhere! What does it mean for markets?


What does all this mean for the markets?

Here are some potential market outcomes for this Friday, post-NFP:

  1. Higher-than-expected NFP (well above 415k) = greater chances of Fed raising interest rates higher

    – stocks and gold move lower

    – the US dollar goes higher

  2. Lower-than-expected NFP (well below 415k) = Fed might have to think harder before raising interest rates

    – stocks and gold move higher, relieved from fears that interest rates wont rise too fast.

    – US dollar moderates (falls slightly) as markets lower their expectations for Fed rate hikes


Of course, the market reaction won’t be based purely on the NFP data, but also on other things weighing on investors’ minds this Friday, including the latest developments surrounding the Ukraine crisis.

Still, the upcoming US jobs report will be interpreted by fundamental investors and traders in trying to forecast the Fed’s next move. The shifts in those forecasts then tend to move prices in the markets.

These NFP-triggered price swings may continue until markets have a pretty good idea about when the Fed will be satisfied with the level of interest rates.


Disclaimer: The content in this article comprises personal opinions and should not be construed as containing personal and/or other investment advice and/or an offer of and/or solicitation for any transactions in financial instruments and/or a guarantee and/or prediction of future performance. ForexTime (FXTM), its affiliates, agents, directors, officers or employees do not guarantee the accuracy, validity, timeliness or completeness, of any information or data made available and assume no liability as to any loss arising from any investment based on the same.

Forex-Time-LogoArticle by ForexTime

ForexTime Ltd (FXTM) is an award winning international online forex broker regulated by CySEC 185/12 www.forextime.com

Will The US February NFP Signal Ongoing Recovery?

By Orbex

Last month’s NFP figures took everyone by surprise, coming in well above even the most optimistic expectations. It was one of many factors contributing to speculations that the Fed would become increasingly hawkish. That, in turn, helped support the dollar and keep stocks (particularly the Nasdaq) under pressure.

However, things have changed recently.

For most of February, there was quite a lot of talk that the Fed could raise rates by 50 basis points at their upcoming meeting. That would be a “double” rate hike, since typically the Fed moves by 25 basis points. Now that speculation has virtually vanished, 98% of analysts are expecting a “simple” rate hike.

What’s changing

Yesterday, as part of his testimony to Congress, Fed Chairman Powell virtually guaranteed a rate hike at the next meeting. This didn’t shake up the market so much, because that’s what was already expected. The big issue now appears to be what the Fed will do after the next meeting.

NFP could give us some insight into that, as the US economy has generally returned to pre-pandemic activity, although it remains about 5 million jobs less. So far, job creation has been relatively sluggish. That is, in comparison to what would be necessary to recover that number of jobs by the end of the year.

On the other hand, some economists point to changes in the underlying economic structure suggesting that recovering all the jobs wouldn’t be a mandatory requirement.

What to look out for

The consensus among analysts is that there were around 400K jobs created last month, compared to 467K in January. Many of them are expecting a slight reduction, considering February has three days less than January (or about 10% fewer days to hire someone).

In general, substantial jobs growth would give the Fed room to continue policy tightening. However, there is a substantial short-term risk due to the Ukraine situation, as Chairman Powell mentioned yesterday in his testimony. That could likely overshadow the US employment data, as far as a potential market reaction is concerned.

Wage growth over jobs growth

The other factor that could change the market’s outlook for the Fed is the average hourly earnings. These could grow by 5.8%, compared to 5.7% in the prior month. This is still below the inflation rate.

One of the main fears of the Fed is a wage-price cycle that could push inflation significantly higher. With inflation higher than wage growth, there’s less risk. On the other hand, it implies an erosion of consumer purchasing power. And that could be negative for the economy in the long run.

A not so strong dollar?

That could mean that the Fed might be looking to raise rates sharply in the short term, but be much slower to raise rates later. In fact, that would imply lower yields further along the bond curve, which is what usually attracts capital flows.

All that technical jargon basically means that if wages aren’t growing as fast, then the dollar might not get as strong. However, again, that is without considering the flight to safety right now due to the Ukraine crisis.

Test your strategy on how the USD will fare with Orbex – Open Your Account Now.


Orbex-LogoArticle by Orbex

Orbex is a fully licensed broker that was established in 2011. Founded with a mission to serve its traders responsibly and provides traders with access to the world’s largest and most liquid financial markets. www.orbex.com

USOIL Bullish Trend Could Reach 144.83

By Orbex

USOIL

USOIL looks at a global upward impulse wave a of the cycle degree. This consists of primary sub-waves ①-②-③-④-⑤.

After the end of the primary correction wave ④, an impulse came into formation.

Most likely, the primary fifth wave is now under construction. In the medium term, this will take the form of an intermediate (1)-(2)-(3)-(4)-(5) impulse.

The end of the entire wave ⑤ is likely to reach the 144.83 area. At that level, it will be at 161.8% of primary impulse ③.

USOIL

Alternatively, it’s possible that the intermediate impulse wave (3), which is part of the primary fifth wave, has ended.

Thus, if this assumption is true, then a correction sub-wave (4) of the intermediate degree will form in the market.

Wave (4) could have a standard zigzag internal structure. On the chart, the form of this correction is depicted by red trend lines and it’s marked with minor sub-waves A-B-C.

At that level, the correction will be at 61.8% of the intermediate impulse wave (3). Thus, the price could end near 85.43.


Orbex-LogoArticle by Orbex

Orbex is a fully licensed broker that was established in 2011. Founded with a mission to serve its traders responsibly and provides traders with access to the world’s largest and most liquid financial markets. www.orbex.com

Intraday Market Analysis – The Euro Struggles For Support

By Orbex

EURUSD sees limited bounce

EURUSD

The euro retreats as the ECB may dial back normalization amid the Ukraine crisis.

A fall below the daily support at 1.1130 was an invalidation of the February rebound and forced buyers to bail out. The lack of support means that short-term sentiment has turned bearish once again.

An oversold RSI may lift the pair temporarily due to profit-taking, but trend followers could be looking to sell into strength. 1.1230 is the closest resistance. A new round of sell-off may push the euro beyond 1.1050.

USDCAD breaks support

USDCAD

The Canadian dollar jumped after the Bank of Canada raised its key interest rate to 0.5%. A break below the demand zone, around 1.2680, has put buyers on the defensive.

The daily support at 1.2640 was a major level. And its breach could trigger a sell-off towards 1.2560, threatening the rally from late January. Further south, January’s low at 1.2450 is a key floor to keep the greenback afloat.

An oversold RSI may lead short-term sellers to exit, driving up the price briefly, but a rebound may be capped by 1.2700.

USOIL bounces higher

USOIL

WTI crude skyrocketed as the war in Ukraine could drag on pushing up energy prices. The rally accelerated after it broke above the psychological tag of 100.00.

The RSI’s overbought situation in both hourly and daily charts indicates overextension. Profit-taking may drive the price back down and let the bulls take a breather.

104.00 is the immediate support in this case. Sentiment is overwhelmingly bullish and pullbacks could be limited. 120.00 would be the next stop when volatility comes around again.


Orbex-LogoArticle by Orbex

Orbex is a fully licensed broker that was established in 2011. Founded with a mission to serve its traders responsibly and provides traders with access to the world’s largest and most liquid financial markets. www.orbex.com

Japanese Candlesticks Analysis 03.03.2022 (USDCAD, AUDUSD, USDCHF)

Article By RoboForex.com

USDCAD, “US Dollar vs Canadian Dollar”

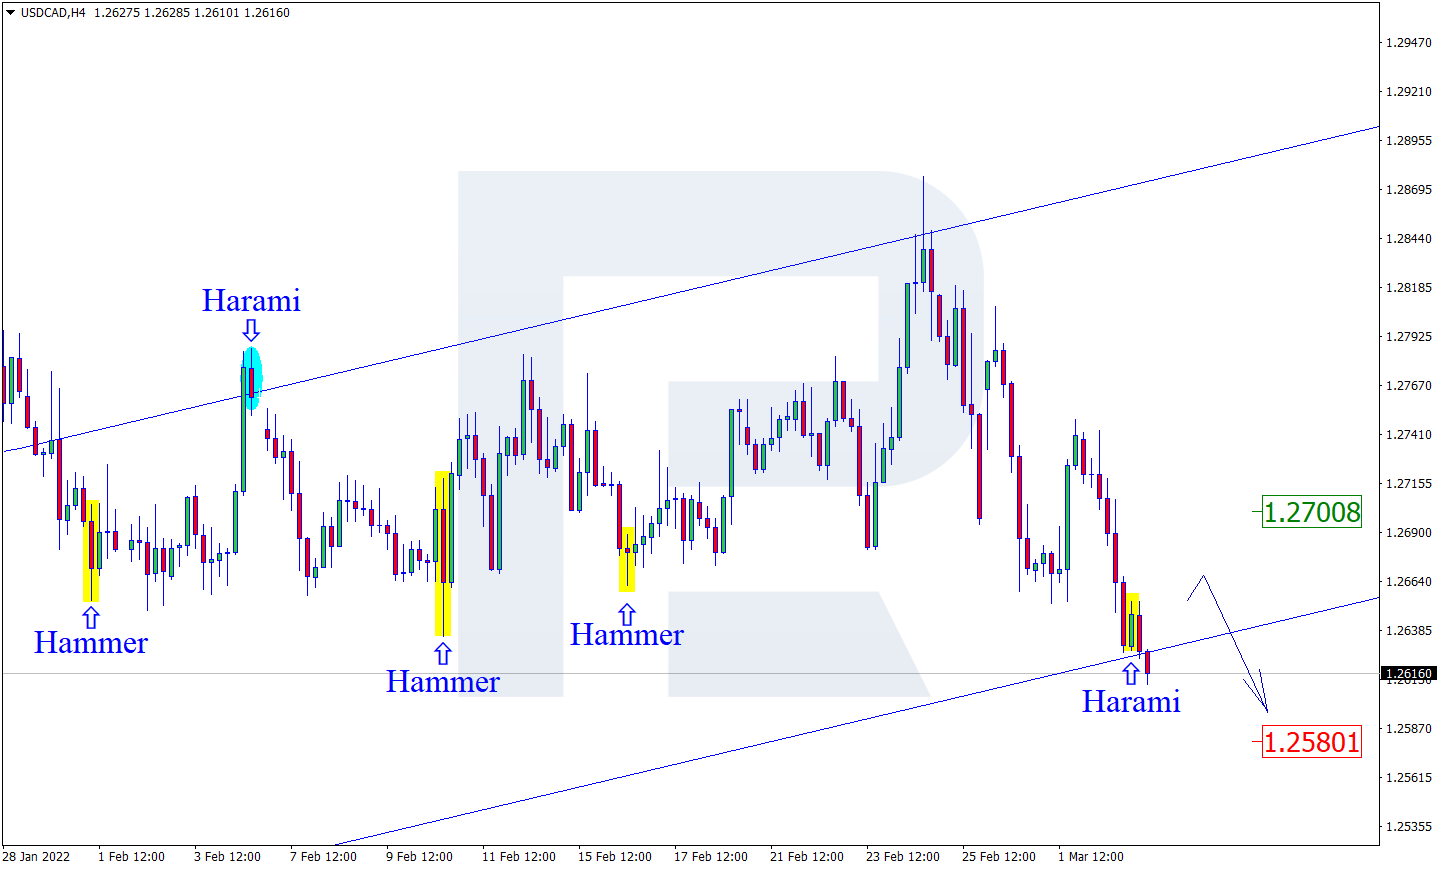
As we can see in the H4 chart, after forming a Harami reversal pattern close to the support level, USDCAD is reversing and may form a new ascending impulse. In this case, the upside target may be the resistance area at 1.2700. However, an alternative scenario implies that the asset may fall to reach 1.2580, rebound from it, and then resume trading upwards.

USDCAD
Risk Warning: the result of previous trading operations do not guarantee the same results in the future

AUDUSD, “Australian Dollar vs US Dollar”

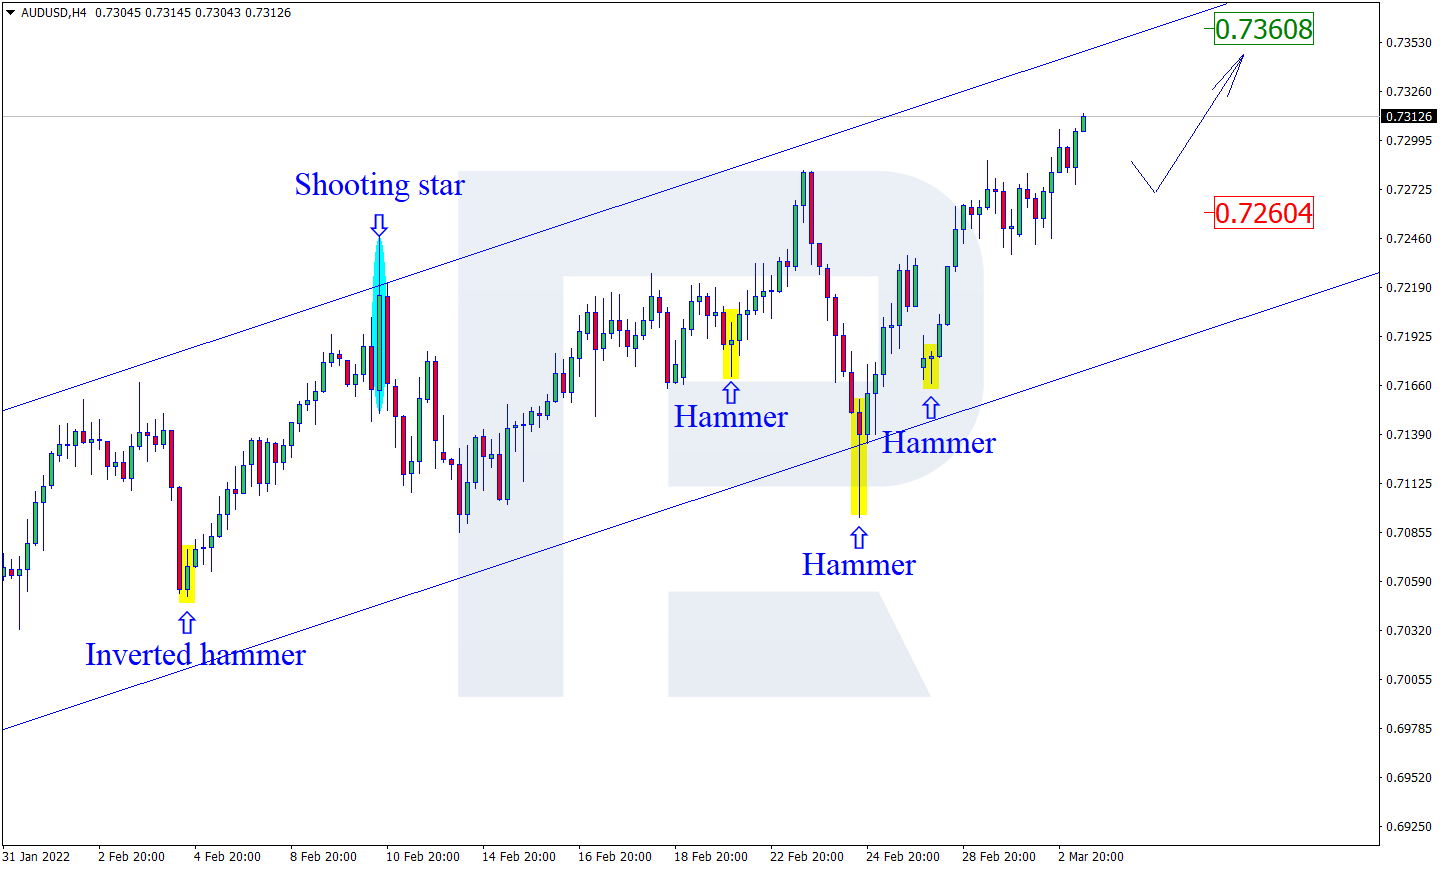
As we can see in the H4 chart, during the pullback, AUDUSD has formed a Hammer reversal pattern near the support area. At the moment, the asset is reversing and starting a new growth. In this case, the upside target may be the resistance level at 0.7360. After testing the level, the price may break it and continue the ascending impulse. At the same time, an opposite scenario implies that the price may correct to reach 0.7260 before resuming the uptrend.

AUDUSD
Risk Warning: the result of previous trading operations do not guarantee the same results in the future

USDCHF, “US Dollar vs Swiss Franc”

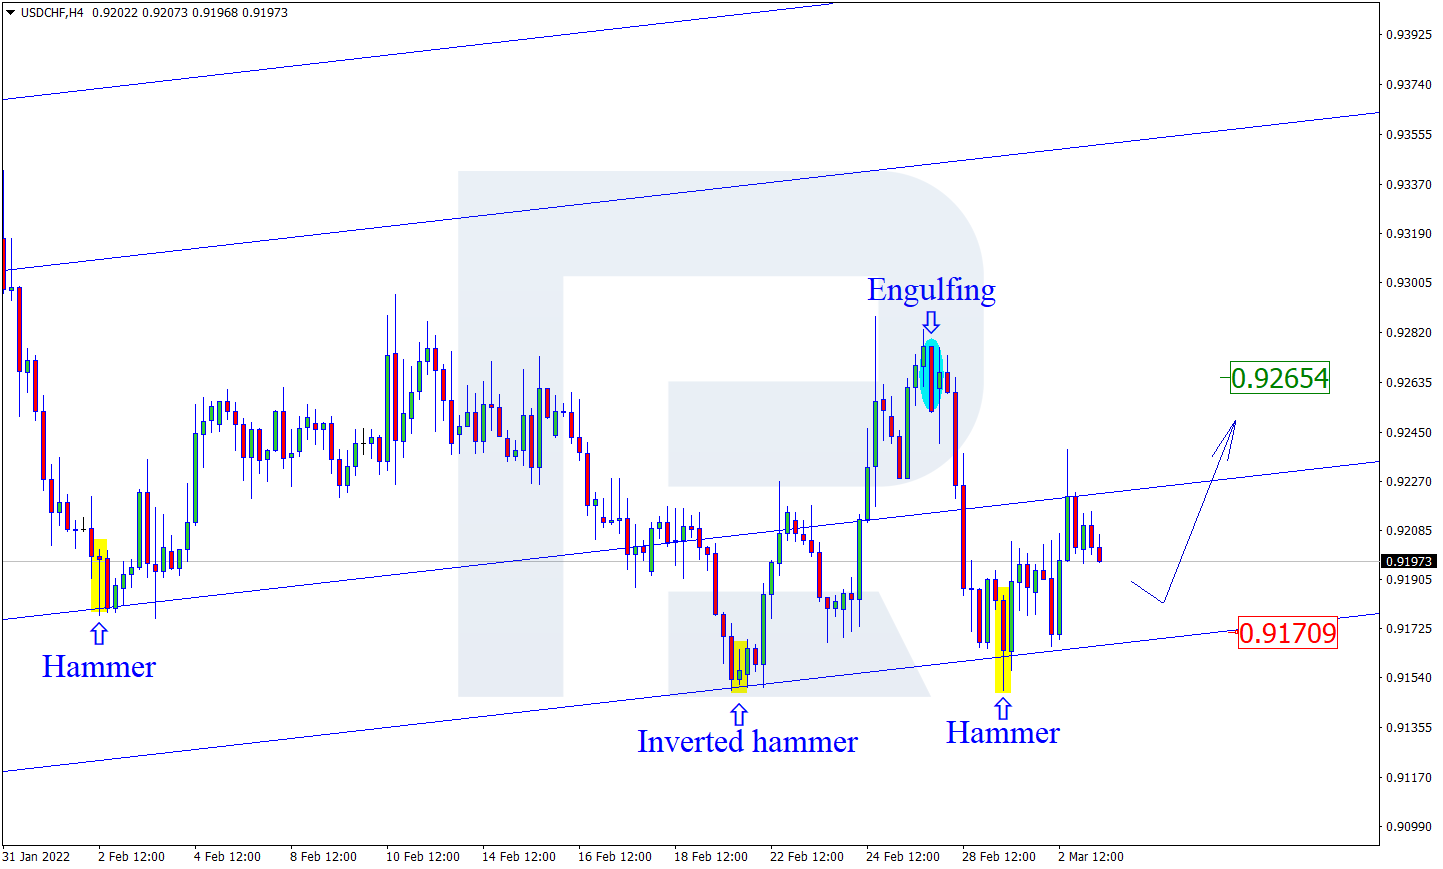
As we can see in the H4 chart, after testing the support area, the pair has formed several reversal patterns, for example, Hammer. At the moment, USDCHF is reversing in the form of a new ascending impulse. In this case, the upside target may be at 0.9265. Still, there might be an alternative scenario, according to which the asset may correct to reach 0.9170 first and then resume growing.

USDCHF

Article By RoboForex.com

Attention!
Forecasts presented in this section only reflect the author’s private opinion and should not be considered as guidance for trading. RoboForex LP bears no responsibility for trading results based on trading recommendations described in these analytical reviews.