The Analytical Overview of the Main Currency Pairs on 2022.03.10

by JustForex

The EUR/USD currency pair

Technical indicators of the currency pair:
  • Prev Open: 1.0896
  • Prev Close: 1.1075
  • % chg. over the last day: +1.64%

Yesterday, the European currency showed the sharpest daily jump in almost six years after it became known that the foreign ministers of Ukraine and Russia will hold negotiations in Turkey today. The ECB will hold a meeting on monetary policy and an interest rate decision. Analysts believe that amid the war in Ukraine, the ECB will not change anything in monetary policy.

Trading recommendations
  • Support levels: 1.0993, 1.0930, 1.0823
  • Resistance levels: 1.1065, 1.1144, 1.1291

From the technical point of view, the EUR/USD currency pair trend on the hourly time frame is bearish, but there are signs that the price may change a priority. The MACD indicator has become positive. The price has adopted the structure of sideways movement with a wide range. In such market conditions, it is better to look for sell trades on the intraday time frames from the resistance level of 1.1065. Buy trades can be looked at from the support of 1.0993 or 1.0930, but only with short targets since there is no fundamental reason for the Euro to strengthen right now.

Alternative scenario: if the price breaks out through the 1.1065 resistance level and fixes above, the mid-term uptrend will likely resume.

EUR/USD
News feed for 2022.03.10:
  • – Eurozone ECB Monetary Policy Statement at 14:45 (GMT+2);
  • – Eurozone ECB Interest Rate Decision at 14:45 (GMT+2);
  • – Eurozone ECB Press Conference at 15:30 (GMT+2);
  • – US Consumer Price Index (m/m) at 15:30 (GMT+2);
  • – US Initial Jobless Claims (w/w) at 15:30 (GMT+2).

The GBP/USD currency pair

Technical indicators of the currency pair:
  • Prev Open: 1.3099
  • Prev Close: 1.3186
  • % chg. over the last day: +0.66%

There are no major economic events related to the UK this week, so the British pound has remained stable in recent days. Today, the US publishes data on consumer inflation, which could significantly shake the dollar, as analysts expect another acceleration of inflation in the United States. If the actual value is worse than expected, the dollar index could strengthen sharply, and the next week’s Fed meeting is likely to decide on a more aggressive increase in interest rates. A rise in the dollar index will cause the GBP/USD to fall. If the real inflation value turns out to be better than expected, the opposite may happen – a decrease in the dollar index and an increase of GBP/USD.

Trading recommendations
  • Support levels: 1.3127, 1.3091
  • Resistance levels: 1.3274, 1.3315, 1.3418

On the hourly time frame, the trend on the GBP/USD currency pair is bearish. Volatility is high, sellers’ pressure has stopped, the price started trading in a sideways range. The MACD indicator has become positive. Under such market conditions, buy trades should be considered from the support level of 1.3127, but better with confirmation. For sell deals, there are no optimal entry points now.

Alternative scenario: if the price breaks out through the 1.3275 resistance level and fixes above, the mid-term uptrend will likely resume.

GBP/USD
There is no news feed for today.

The USD/JPY currency pair

Technical indicators of the currency pair:
  • Prev Open: 115.67
  • Prev Close: 115.86
  • % chg. over the last day: +0.16%

The monetary policy of the central bank of Japan is now aimed at making the Japanese yen cheaper (USD/JPY growth), and the US Federal Reserve will begin to tighten monetary policy this month. Therefore, investors often transfer their funds to the yen in case of any panic moods in the market.

Trading recommendations
  • Support levels: 115.89, 115.41, 115.13, 114.71, 114.41
  • Resistance levels: 116.32

The medium-term trend on the USD/JPY currency pair is bullish. The MACD indicator is in the positive zone, but there are signs of divergence. Under such market conditions, it is best to look for buy deals on the lower time frames from the support level of 115.89, but with additional confirmation. Sell deals may be considered from the resistance level of 116.32, but it is better to wait for the reaction of sellers.

Alternative scenario: if the price fixes below 115.41, the uptrend will likely be broken.

USD/JPY
News feed for 2022.03.10:
  • – Japan Producer Price Index (m/m) at 01:50 (GMT+2).

The USD/CAD currency pair

Technical indicators of the currency pair:
  • Prev Open: 1.2885
  • Prev Close: 1.2805
  • % chg. over the last day: -0.62%

The Canadian dollar is a commodity currency, so it is highly dependent not only on the monetary policy of the Bank of Canada but also on the dynamics of oil prices and the dollar index. The dollar index fell yesterday, while oil showed its biggest drop in almost two years after the United Arab Emirates, a member of the Organization of Petroleum Exporting Countries and their allies (OPEC+), said it would support increased production. This situation led to a sharp decline in USD/CAD quotes.

Trading recommendations
  • Support levels: 1.2790, 1.2653, 1.2555, 1.2517
  • Resistance levels: 1.2871, 1.2890

From a technical point of view, the USD/CAD currency pair trend is bullish. The price trades between the moving averages, indicating a more flat structure within a bullish trend. It is worth trading only with short targets, as both oil and the dollar index are still fundamentally inclined to rise. Under such market conditions, it is better to look for buy trades on lower time frames from the support level of 1.2790, but it is better with additional confirmation. For sell deals, it is better to consider the resistance level of 1.2871.

Alternative scenario: if the price breaks through and consolidates below 1.2726, the downtrend will likely resume.

USD/CAD
There is no news feed for today.

by JustForex


This article reflects a personal opinion and should not be interpreted as an investment advice, and/or offer, and/or a persistent request for carrying out financial transactions, and/or a guarantee, and/or a forecast of future events.

Intraday Market Analysis – The Euro Makes A Reversal Attempt

By Orbex

EURUSD bounces back

EURUSD

The euro rallies on news that the EU may issue a joint bond to fund energy and defense.

The pair found bids near May 2020’s lows (1.0810). An oversold RSI on the daily chart prompted sellers to take profit, easing the downward pressure. A rally above the immediate resistance at 1.0940 and a bullish MA cross may improve sentiment in the short term.

However, buyers will need to clear the support-turned-resistance at 1.1160 before they could hope for a meaningful rebound. 1.0910 is the support in case of a pullback.

GBPUSD inches higher

GBPUSD

The sterling claws back losses as risk appetite makes a timid return across the board.

Following a three-month-long rebound on the daily chart, a lack of support at 1.3200 and a bearish MA cross shows strong selling pressure. A bounce-back above 1.3200 may only offer temporary relief as sellers potentially look to fade the rebound.

1.3350 is a key hurdle that sits along the 20-day moving average. 1.3080 is fresh support and its breach could trigger a new round of sell-off below the next daily support at 1.2880.

USOIL breaks support

USOIL

WTI crude tumbled after the UAE said consider boosting production.

The parabolic climb came to a halt at 129.00 and pushed the RSI into an extremely overbought condition on the daily chart. A bearish RSI divergence suggested a loss of momentum and foreshadowed a correction as traders would be wary of chasing the rally.

A fall below 115.00 led buyers to bail out, triggering a wave of liquidation. 105.00 is the next support and a breakout could bring the price back to 95.00 near the 30-day moving average.


Orbex-LogoArticle by Orbex

Orbex is a fully licensed broker that was established in 2011. Founded with a mission to serve its traders responsibly and provides traders with access to the world’s largest and most liquid financial markets. www.orbex.com

Today, investors’ attention is focused on the ECB meeting, US inflation, and the talks between foreign ministers of Russia and U

by JustForex

US stock indices ended Wednesday’s trading with solid growth. Falling prices for oil and other commodities have supported the US stock market. The sharp rise in oil and other commodities has raised fears among investors about further rising inflation and a potential slowdown in economic growth. As the stock market closed yesterday, the Dow Jones index (US30) increased by 2%, the S&P 500 index (US500) added 2.57%, and the NASDAQ technology index (US100) jumped by 3.59%.

The US consumer inflation data will be released today, which could significantly shake the dollar as analysts expect another acceleration of US inflation. If the actual value is worse than expected, the dollar index may strengthen sharply. The Fed is expected to decide to raise interest rates more aggressively next week, although Fed Chairman Jerome Powell said last week that the increase would be 25 basis points. If the actual value is better than expected or meets expectations, the dollar index, on the other hand, may fall, which will have a positive impact on major US stock indices.

Amazon has announced its first share split since the dot-com boom, announcing to investors on Wednesday that they will receive 20 shares for every share (20:1) they currently own. The company’s stock jumped 8% in the after-hours session. The company also said that its board of directors has decided to make a buyback up to $10 billion.

European indices strengthened substantially yesterday, showing the largest growth in two years. Several factors contributed to this. Firstly, investors were attracted by Ukrainian President Volodymyr Zelensky’s interview for the American ABC News, in which he said that he “cooled down” about Ukraine’s accession to NATO and added that he was open to a dialogue on the future of the “DNR” and “LNR.” Secondly, the foreign ministers of Ukraine and Russia will meet in Turkey today. Thirdly, the United Arab Emirates, a member of the Organization of Petroleum Exporting Countries and their allies (OPEC+), supports increasing oil production. All these factors caused a positive mood.

At the closing of the stock exchange, German DAX (DE30) gained 7.92%, French CAC 40 (FR40) added 7.13%, Spanish IBEX 35 (ES35) increased by 4.88%, British FTSE 100 (UK100) jumped by 3.25%. Today, the ECB will hold its monetary policy meeting to decide the interest rate. Analysts believe that amid the war in Ukraine, the ECB will not change anything in monetary policy. Still, investors should closely follow Christine Lagarde’s speech hints at a press conference.

After it became known yesterday that the United Arab Emirates would support an increase in oil production amid possible supply problems from Russia, oil prices fell the most in almost two years.

On Thursday, Asian stocks rose, following rising on Wall Street, as planned diplomatic talks between Russia and Ukraine have supported investor sentiment. Japan’s Nikkei 225 (JP225) gained 3.94%, Hong Kong’s Hang Seng (HK50) added 1.27%, and Australia’s S&P/ASX 200 (AU200) rose 1.10%. Japan’s Producer Price Index, which measures inflation between factories, rose to 9.3% from 8.9% in annual terms. This is the first sign that consumer inflation will also begin to increase.

Main market quotes:

S&P 500 (F) (US500) 4,277.88 +107.18 (+2.57%)

Dow Jones (US30) 33,286.25 +653.61 (+2.00%)

DAX (DE40) 13,847.93 +1,016.42 (+7.92%)

FTSE 100 (UK100) 7,190.72 +226.61 (+3.25%)

USD Index 97.98 -1.08 (-1.09%)

Important events for today:
  • – Japan Producer Price Index (m/m) at 01:50 (GMT+2);
  • – Eurozone ECB Monetary Policy Statement at 14:45 (GMT+2);
  • – Eurozone ECB Interest Rate Decision at 14:45 (GMT+2);
  • – Eurozone ECB Press Conference at 15:30 (GMT+2);
  • – US Consumer Price Index (m/m) at 15:30 (GMT+2);
  • – US Initial Jobless Claims (w/w) at 15:30 (GMT+2);
  • – US Natural Gas Storage (w/w) at 17:30 (GMT+2).

by JustForex


This article reflects a personal opinion and should not be interpreted as an investment advice, and/or offer, and/or a persistent request for carrying out financial transactions, and/or a guarantee, and/or a forecast of future events.

EURUSD could rock when clock strikes 13:30GMT

By Han Tan Chief Market Analyst at Exinity Group

Get ready for a (potentially) tumultuous Thursday, especially for euro traders (which likely includes most FX traders, seeing as EURUSD is the world’s most popularly traded currency pair).

At 13:30 GMT today (Thursday, March 10th 2022), there are two major events that are set to happen simultaneously:

  • The US February inflation (consumer price index) data is released
  • European Central Bank President, Christine Lagarde, will be holding a press conference, about 45 minutes after the ECB announces its policy decision


What are markets expecting for the US inflation data?

The US consumer price index (CPI) is forecasted to grow by 7.9% last month compared to prices in February 2021.

If so, that would be the highest CPI figure since January 1982.

NOTE: The CPI measures how fast consumer prices are changing.

The main way that the Federal Reserve a.k.a. the Fed suppresses inflation is by raising interest rates.

If the CPI announcement at 13:30GMT today shows higher-than-expected inflation, that should also mean that the Fed has little choice but to raise interest rates in the US more frequently this year (markets are now forecasting 6 rate hikes for 2022), and even perhaps by a larger amount each time.


What are markets expecting out of ECB’s Lagarde?

Now this one is a lot trickier.

Back in early February, the European Central Bank had already announced to the markets that it intends to ease away from its supportive measures that had been rolled out amid the pandemic.

But that was before Russia invaded Ukraine.

Now, with war raging on and casting a dark cloud over how markets view the Eurozone’s economic performance in the months ahead, the ECB might have to reverse course and continue supporting the economy.

To be clear, the ECB isn’t expected to make any actual policy adjustments today.

However, given the forward-looking nature of markets, investors and traders are more concerned with what the ECB intends to do in the future.

Hence markets will be eager to know whether the ECB will press on with raising interest rates (perhaps in September) to combat inflation, knowing that such a move could unintentionally worsen the EU’s economic performance (higher interest rates tends to lower consumption spending as well) … or worse, trigger a recession.


How might EURUSD react to ECB announcement + US inflation?

SCENARIO 1:

US inflation higher than 7.9% (that encourages the Fed to hike rates higher and faster)

+

ECB’s Lagarde saying there’s less chance of a rate hike

=

potentially EURUSD being dragged lower back towards 1.08.


———–

SCENARIO 2:

US inflation that’s substantially lower than 7.9% (that suggests consumer prices are cooling and the Fed can afford to be less aggressive with rate hikes)

+

ECB’s Lagarde saying that she and her colleagues will press ahead with rate hikes this year

=

potentially EURUSD being boosted back above 1.11, and testing the January-2022 low of 1.11214 for resistance.


Disclaimer: The content in this article comprises personal opinions and should not be construed as containing personal and/or other investment advice and/or an offer of and/or solicitation for any transactions in financial instruments and/or a guarantee and/or prediction of future performance. ForexTime (FXTM), its affiliates, agents, directors, officers or employees do not guarantee the accuracy, validity, timeliness or completeness, of any information or data made available and assume no liability as to any loss arising from any investment based on the same.


Forex-Time-LogoArticle by ForexTime

ForexTime Ltd (FXTM) is an award winning international online forex broker regulated by CySEC 185/12 www.forextime.com

Mid-Week Technical Outlook: Hidden Jewels & Gems

By Lukman Otunuga Senior Research Analyst, ForexTime

Global equities staged a rebound on Wednesday after days of turmoil and uncertainty over Russia’s invasion of Ukraine.

The mood across markets slightly improved as investors placed hopes on EU leaders fending off a recession caused by geopolitical risks. In the commodities arena, gold prices reversed course to dip below $2000 while oil bulls took the day off. There was action across the FX space as the dollar and yen weakened with the EURUSD among other currency pairs snatching our attention. Volatility has certainly been the name of the game over the past few days. While this comes with risk, it also presents potential setups across equity, foreign exchange, and commodity markets.

There are a couple of jewels and gems hidden beneath all the noise. However, technical analysis remains a suitable tool to unearth these opportunities.

EURUSD breakout or throwback?

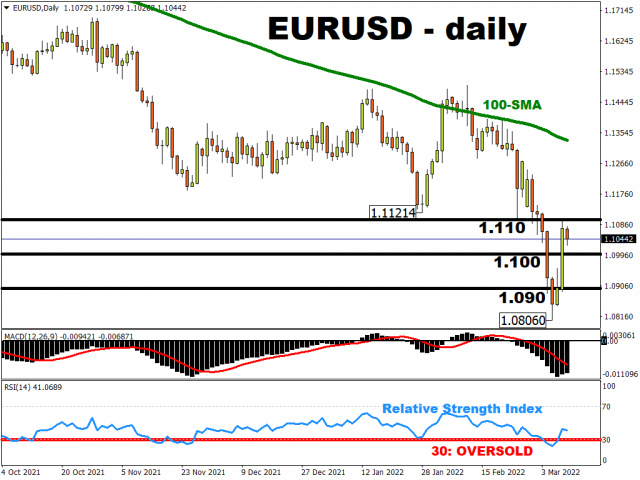
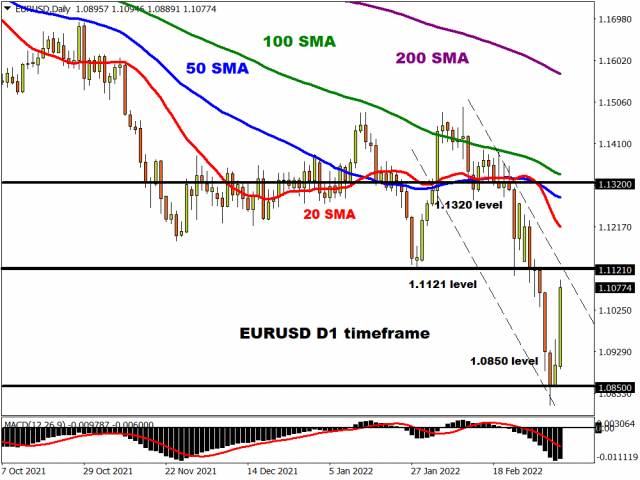
It may be wise to keep a close eye on how the EURUSD behaves around 1.1121 on Thursday.

With the European Central Bank (ECB) widely expected to leave interests rates unchanged and the dollar drawing strength from the overall uncertainty, the EURUSD is poised to decline. Given how prices are approaching a key dynamic level, anything could be on the table. A strong breakout above 1.1121 may open the doors towards 1.1320. Alternatively, sustained weakness under 1.1121 could trigger a decline back towards 1.0850.

GBPUSD above major resistance

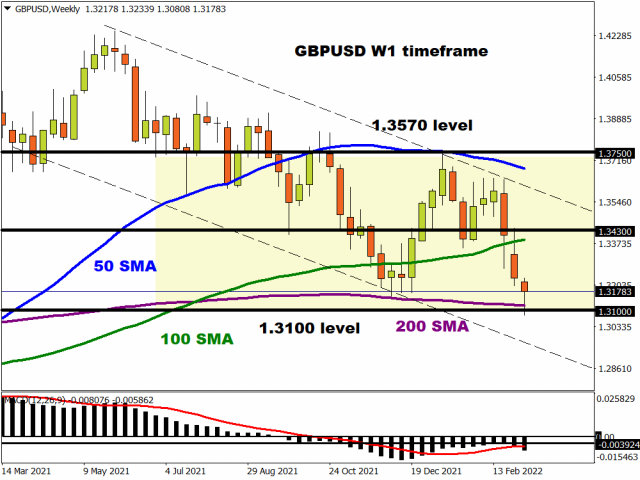
If you want clarity on the GBPUSD, just take a look at the weekly charts.

Prices remain in a bearish weekly channel and there have been consistently lower lows and lower highs. Strong support can be found at 1.3100 which is also where the 200-week Simple Moving Average resides. Should bears secure a weekly close below this support, a decline back towards 1.3000 and lower could be on the cards. Alternatively, a rebound from this level could signal a move to 1.3430 and potentially higher.

USDJPY same old story

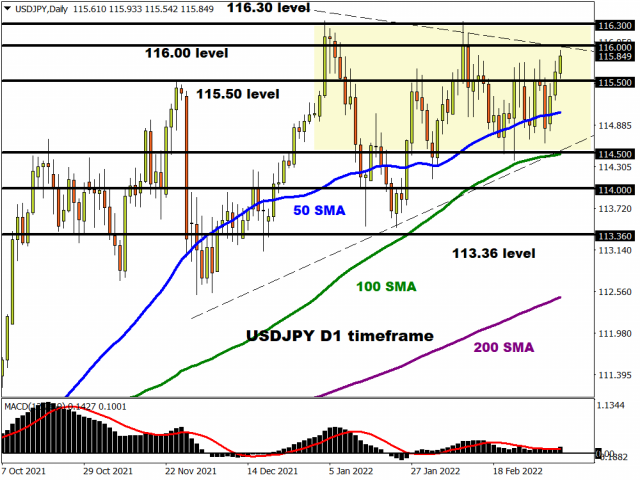
It’s the same old story for the USDJPY. Prices remain trapped within a range with multiple levels of support and resistance levels on both sides. The currency pair needs a fresh directional catalyst and this could come in the form of the pending US inflation report on Thursday. In the meantime, a breakout above 116.00 could open a path towards 116.30 and 117.40. If prices slip below 115.50, then the next level of interest can be found at 114.50.

AUDUSD bears still lingering

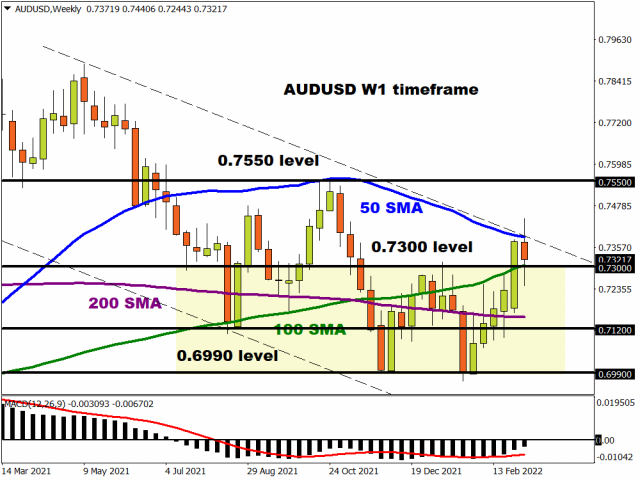
The AUDUSD experienced a rebound over the past few weeks with bulls pushing the currency beyond 0.7300. Interestingly, prices still remain in a bearish channel on the weekly charts with 0.7300 acting as a pivotal point. Sustained weakness under this level could trigger a selloff towards 0.7120 and 0.6990.

EURJPY trend reversal?

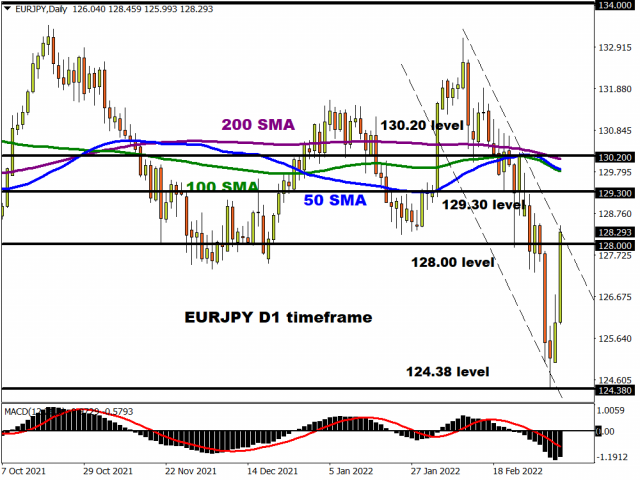
The EURJPY has jumped over 200 pips today thanks to a weakening Japanese Yen. Prices could turn bullish on the daily charts if a strong daily close above 129.30 is achieved. A selloff back below 128.00 may trigger a steep decline towards 124.38.

GBPJPY to push higher on shorter timeframe

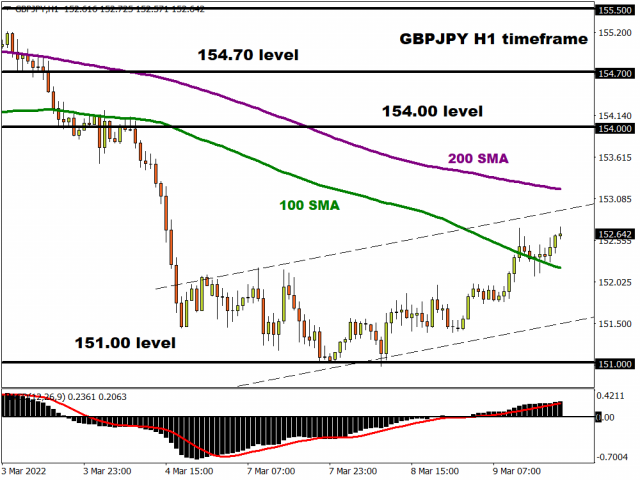
Things are looking bullish for the GBPJPY on the hourly charts. The upside momentum could take prices to 153.30 and 154.00 before bears re-enter the scene. A move below 152.20 could trigger a selloff towards 151.00.

Is the party over for gold bugs?

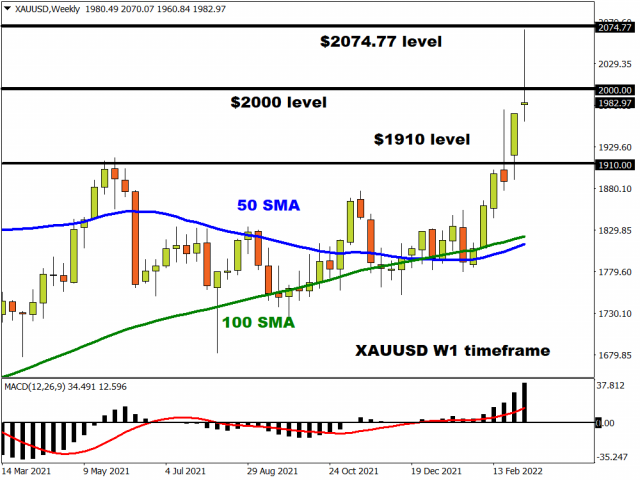
They say a picture says 1000 words. Well, then check out gold on the weekly timeframe. The forming pin bar on the weekly charts is bad news for bulls with a weekly close back below $2000 signalling further downside. It is worth keeping in mind that gold prices may be influenced by the US inflation report on Thursday.

 Oil bulls twist ankles

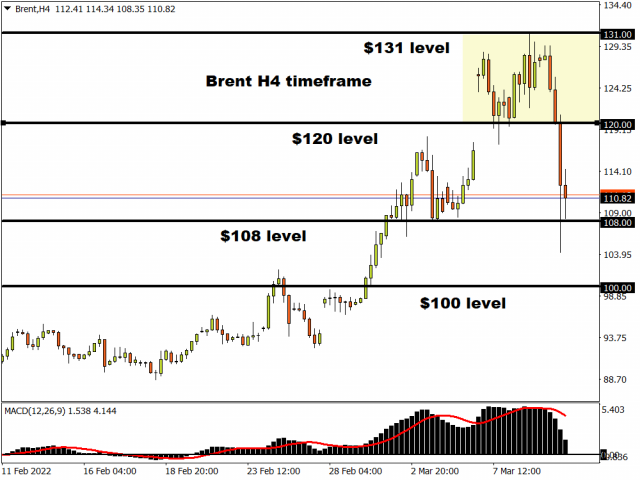
Yesterday we questioned whether oil bulls were unstoppable? It looks like they have tripped over something or injured themselves today as prices tumble. Brent crude is trading around the $108 level after punching above $131 on Tuesday. A strong breakdown below $108 is likely to encourage a decline back towards $100.

S&P500 respects bearish channel

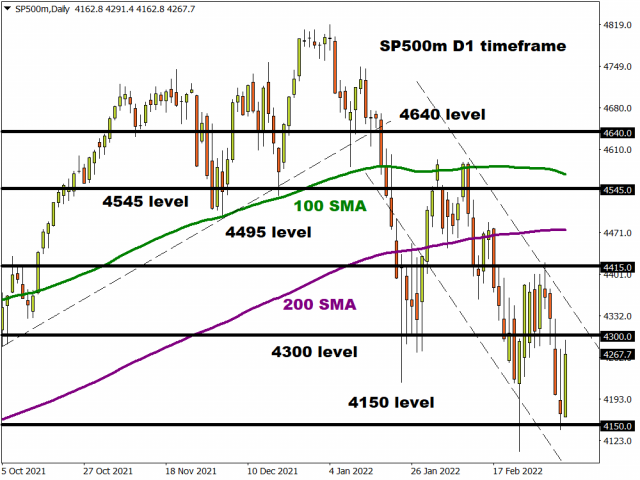
Despite today’s sharp rebound, the S&P500 remains in a bearish channel on the daily charts. If 4300 proves to be reliable resistance, a decline back towards 4150 and lower could become reality. Above 4300, the next key levels of interest can be found at 4415 and 4470 – a level just below the 200-day Simple Moving Average.

Disclaimer: The content in this article comprises personal opinions and should not be construed as containing personal and/or other investment advice and/or an offer of and/or solicitation for any transactions in financial instruments and/or a guarantee and/or prediction of future performance. ForexTime (FXTM), its affiliates, agents, directors, officers or employees do not guarantee the accuracy, validity, timeliness or completeness, of any information or data made available and assume no liability as to any loss arising from any investment based on the same.


Forex-Time-LogoArticle by ForexTime

ForexTime Ltd (FXTM) is an award winning international online forex broker regulated by CySEC 185/12 www.forextime.com

The great Amazon land grab – how Brazil’s government is clearing the way for deforestation

By Gabriel Cardoso Carrero, University of Florida; Cynthia S. Simmons, University of Florida, and Robert T. Walker, University of Florida 

Imagine that a group of politicians decide that Yellowstone National Park is too big, so they downsize the park by a million acres, then sell that land in a private auction.

Outrageous? Yes. Unheard of? No. It’s happening with increasing frequency in the Brazilian Amazon.

The most widely publicized threat to the Amazonian rainforest is deforestation. A new study by European scientists released March 7, 2022, finds that tree clearing and less rainfall over the past 20 years have left over 75% of the region increasingly less resilient to disturbances, suggesting the rainforest may be nearing a tipping point for dieback. Fewer trees mean less moisture evaporating into the atmosphere to fall again as rain.

We have studied the Amazon’s changing hydroclimate, the role of deforestation and evidence that the Amazon is being pushed toward a tipping point – as well as what that means for different regions, biodiversity and climate change.

While the rise in deforestation is clear, less well understood are the sources driving it – particularly the way public lands are being converted to private holdings in a land grab we’ve been studying
for the past decade.

Much of this land is cleared for cattle ranches and soybean farms, threatening biodiversity and the Earth’s climate. Prior research has quantified how much public land has been grabbed, but only for one type of public land called “undesignated public forests.” Our research provides a complete account across all classes of public land.

We looked at Amazonia’s most active deforestation frontier, southern Amazonas State, starting in 2012 as rates of deforestation began to increase because of loosened regulatory oversight. Our research shows how land grabs are tied to accelerating deforestation spearheaded by wealthy interests, and how Brazil’s National Congress, by changing laws, is legitimizing these land grabs.

How the Amazon land grab began

Brazil’s modern land grab started in the 1970s, when the military government began offering free land to encourage mining industries and farmers to move in, arguing that national security depended on developing the region. It took lands that had been under state jurisdictions since colonial times and allocated them to rural settlement, granting 150- to 250-acre holdings to poor farmers.

Federal and state governments ultimately designated over 65% of Amazonia to several public interests, including rural settlement. For biodiversity, they created conservation units, some allowing traditional resource use and subsistence agriculture. Leftover government lands are generally referred to as “vacant or undesignated public lands.”

Tracking the land grab

Studies have estimated that by 2020, 32% of “undesignated public forests” had been grabbed for private use. But this is only part of the story, because land grabbing is now affecting many types of public land.

Importantly, land grabs now impact conservation areas and indigenous territories, where private holdings are forbidden.

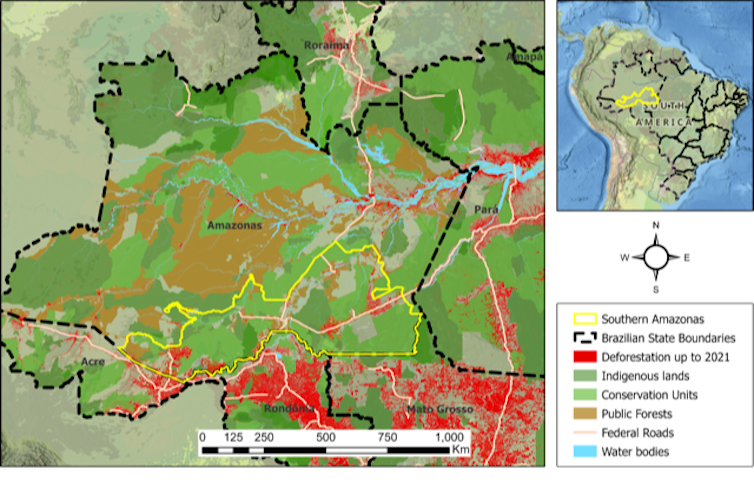
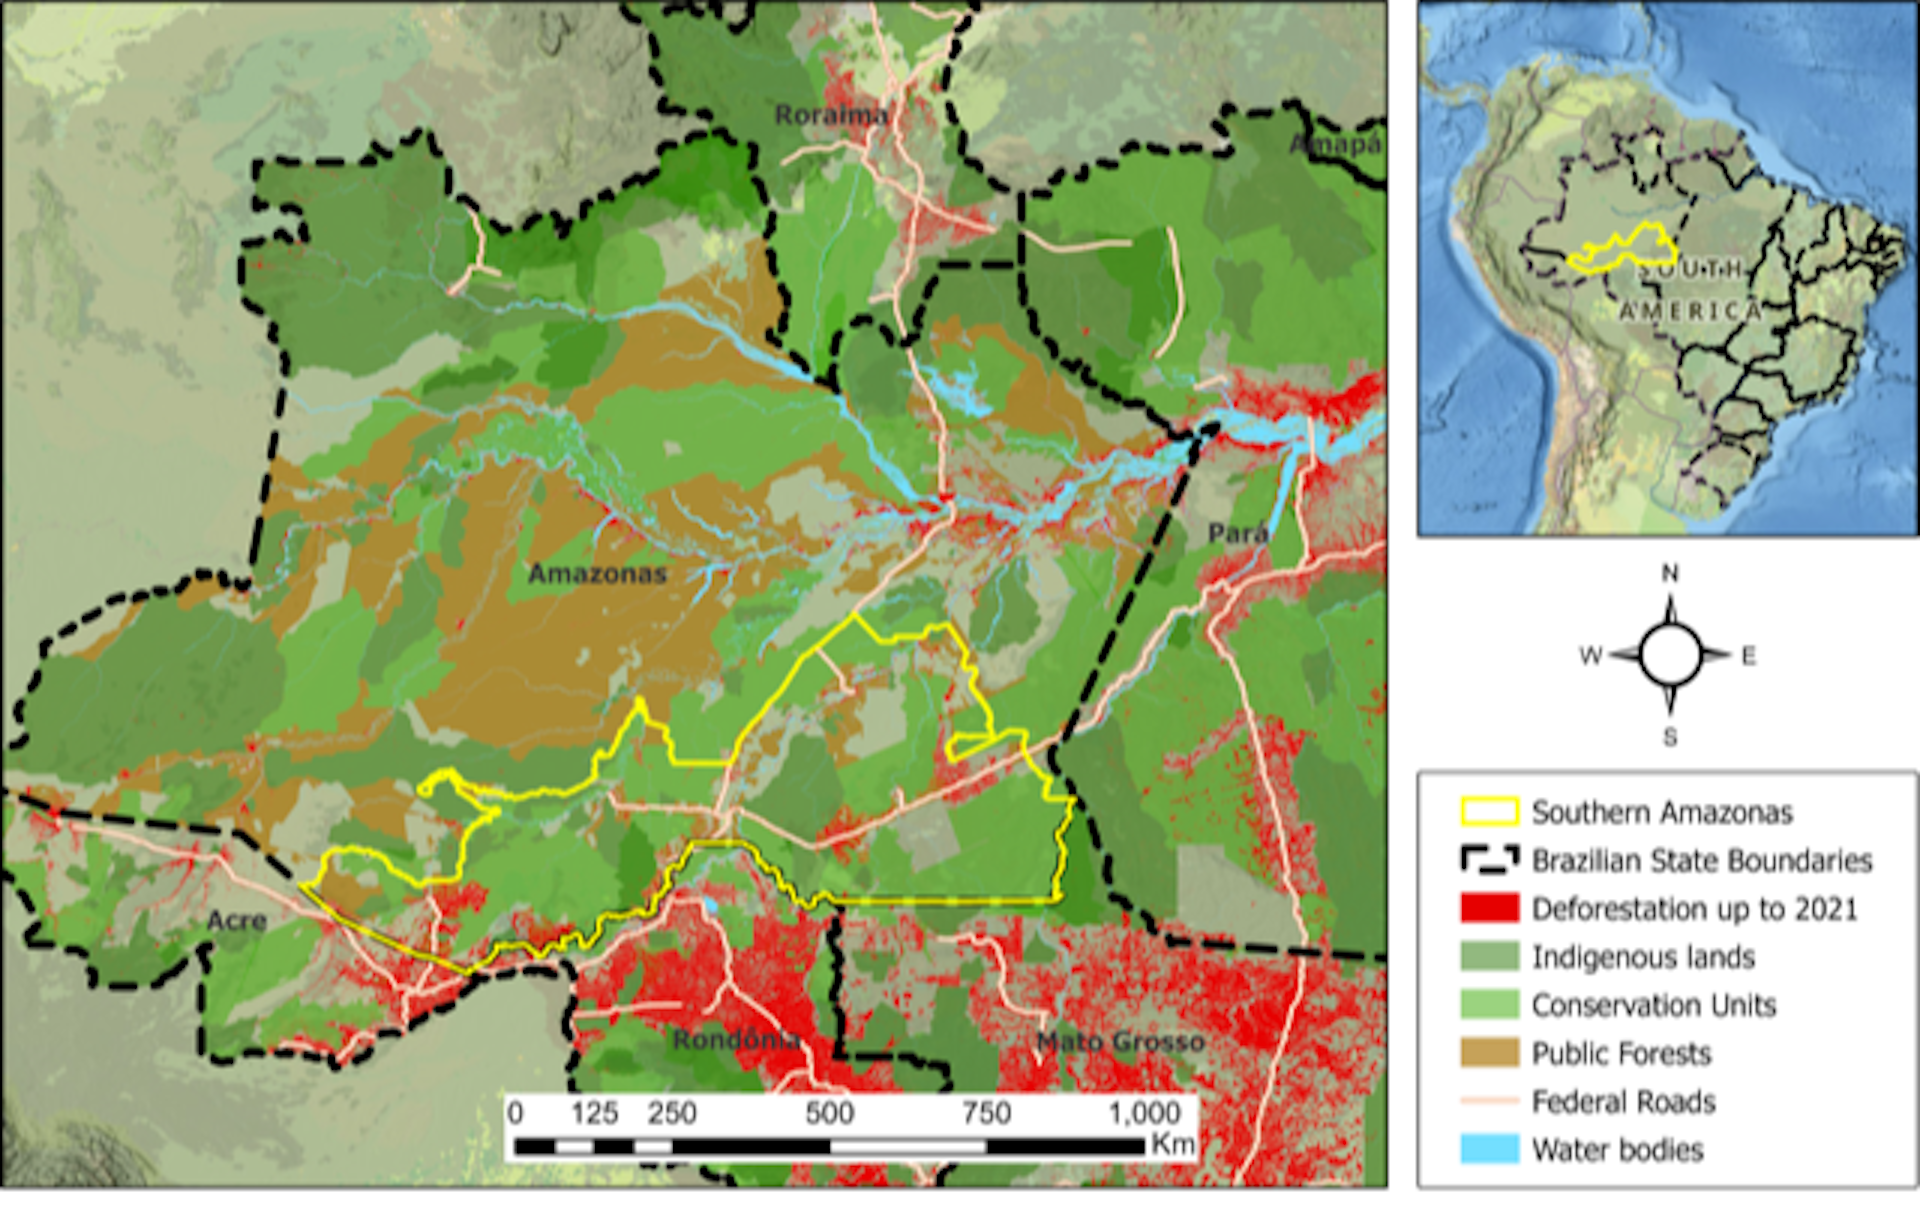
We compared the boundaries of self-declared private holdings in the government’s Rural Environmental Registry database, known as CAR, with the boundaries of all public lands in southern Amazonas State. The region has 50,309 square miles in conservation units. Of these, we found that 10,425 square miles, 21%, have been “grabbed,” or declared in the CAR register as private between 2014 and 2020.

In the United States, this would be like having 21% of the national parks disappear into private property.

Our measurement is probably an underestimate, given that not all grabbed lands are registered. Some land grabbers now use CAR to establish claims that could become legal with changes in the law.

A map of the region showing deforestation and public lands.
Gabriel Cardoso Carrero, CC BY-ND

Land grabs put the rainforest at risk by increasing deforestation. In southern Amazonas, our research reveals that twice as much deforestation occurred on illegal as opposed to legal CAR holdings between 2008 and 2021, a relative magnitude that is growing.

Large deforestation patches point to wealth

So who are these land grabbers?

In Pará State, Amazonas State’s neighbor, deforestation in the 1990s was dominated by poor family farms in rural settlements. On average, these households accumulated 120 acres of farmland after several decades by opening 4-6 acres of forest every few years in clearings visible on satellite images as deforestation patches.

Since then, patch sizes have grown dramatically in the region, with most deforestation occurring on illicit holdings whose patches are much larger than on legal holdings.

Large deforestation patches indicate the presence of wealthy grabbers, given the cost of clearing land.

Land grabbers benefit by selling the on-site timber and by subdividing what they’ve grabbed for sale in small parcels. Arrest records and research by groups such as Transparency International Brasil show that many of them are involved in criminal enterprises that use the land for money laundering, tax evasion and illegal mining and logging.

In the 10-year period before President Jair Bolsonaro took office, satellite data showed two deforestation patches exceeding 3,707 acres in Southern Amazonas. Since his election in 2019, we can identify nine massive clearings with an average size of 5,105 acres. The clearance and preparation cost for each Bolsonaro-era deforestation patch, legal or illicit, would be about US$353,000.

Legitimizing land grabbing

Brazil’s National Congress has been making it easier to grab public land.

A 2017 change in the law expanded the legally allowed size of private holdings in undesignated public lands and in rural settlements. This has reclassified over 1,000 square miles of land that had been considered illegal in 2014 as legal in southern Amazonas. Of all illegal CAR claims in undesignated public lands and rural settlements in 2014, we found that 94% became legal in 2017.

Congress is now considering two additional pieces of legislation. One would legitimize land grabs up to 6,180 acres, about 9.5 square miles, in all undesignated public forests – an amount already allowed by law in other types of undesignated public lands. The second would legitimize large holdings on about 80,000 square miles of land once meant for the poor.

Our research also shows that the federal government increased the amount of public land up for grabs in southern Amazonas by shrinking rural settlements by 16%, just over 2,000 square miles, between 2015 and 2020. Large ranches are now absorbing that land. Similar downsizing of public land has affected Amazonia’s national parks.

Satellite images over time show how deforestation spread in the Amazon.

What can turn this around?

Because of policy interventions and the greening of agricultural supply chains, deforestation in the Brazilian Amazon fell after 2005, reaching a low point in 2012, when it began trending up again because of weakening environmental governance and reduced surveillance.

Other countries have helped Brazil with billions of dollars to protect the Amazon for the good of the climate, but in the end, the land belongs to Brazil. Outsiders have limited power to influence its use.

At the U.N. climate summit in 2021, 141 countries – including Brazil – signed a pledge to end deforestation by 2030. This pledge holds potential because, unlike past ones, the private sector has committed $7.2 billion to reduce agriculture’s impact on the forest. In our view, the global community can help by insisting that supply chains for Amazonian beef and soybean products originate on lands deforested long ago and whose legality is longstanding.

This article was updated March 7, 2022, with new research suggesting the Amazon is nearing a tipping point.

About the Author:

Gabriel Cardoso Carrero, Graduate Student Fellow and PhD Candidate in Geography, University of Florida; Cynthia S. Simmons, Professor of Geography, University of Florida, and Robert T. Walker, Professor of Latin American Studies and Geography, University of Florida

This article is republished from The Conversation under a Creative Commons license. Read the original article.


ECB Likely To Keep Policy & Maintain Flexibility

By Orbex

Up until about two weeks ago, there was a pretty strong consensus that the ECB would take the first step towards monetary policy normalization at tomorrow’s meeting.

That’s when the covid asset-buying program (PEPP) would run out. There was a recession of covid cases, and lifting of lockdowns. In fact, the comments from members, and the minutes of the last meeting seemed to reinforce that.

But, that all came to a screeching halt when Russian tanks rolled into Ukraine.

There is massive uncertainty in Europe as to how the war will play out, and how it will affect the economy. Although sanctions are targeting Russia, they will inevitably have an impact on the countries imposing the sanctions. Then there are the unexpected consequences of a war in one of the most resource-rich areas of the world, with fuel and commodity prices soaring.

Inflation is an even bigger problem

The ECB’s turn towards hawkishness was obvious because of rising inflation in the shared economy. Forecasts from the ECB itself show that it could continue increasing. That was before the price of fuel started rocketing to the moon. Then there is the economic disruption from increased spending to help accommodate millions of refugees.

So, why not be even more hawkish? Because the risk associated with the war and its economic fallout leads to lower growth expectations.

Germany already reported one quarter of negative growth. This means that it could already be in a technical recession. Running off asset purchases and threatening to raise rates might help with inflation. But it would come at the cost of pushing a reeling economy even further down.

Get familiar with stagflation

High inflation but lack of economic growth is known as stagflation. And it is a problem for central banks because it’s hard to break out from.

This was the case in the 1970s in the US, which prompted then Fed Chairman Volker to raise rates dramatically, leading to a recession, but ultimately breaking the cycle. That really isn’t a possibility for a fractured economy with most countries holding around 100% of their GDP in debt.

Furthermore, the underlying causes of stagflation might be completely out of the ECB’s hands. It’s not monetary policy that is driving problems to the supply chains, nor directing the war in Ukraine.

What can the ECB do?

The consensus is that the ECB will simply change some names. The PEPP program buying €20B a month is coming to an end, but the normal asset purchasing facility should rise by €20B. So, the ECB will continue to buy the same monetary policy support.

In the meantime, the ECB can hold off on giving any clues as to when the program will end, by saying something along the lines of “as long as the situation merits”. Another potential option would be to announce a “taper”, reducing the amount purchased by a fixed figure, but subject it to review each month. That could be a way to add a little bit of hawkishness.

However, that is unlikely.

Finally, the staff projections were complete before the start of the war, so the market will probably dismiss them.

Trade the ECB minutes with Orbex – Open your account now!


Orbex-LogoArticle by Orbex

Orbex is a fully licensed broker that was established in 2011. Founded with a mission to serve its traders responsibly and provides traders with access to the world’s largest and most liquid financial markets. www.orbex.com

The Stunning Truth About the FDIC and Your Bank Deposits

Why you can’t rely on the FDIC if another financial crisis hits and your bank goes under

By Elliott Wave International

Millions of U.S. bank depositors feel safe in the knowledge that the Federal Deposit Insurance Corporation will protect their accounts, even if their bank goes under.

Yes, it’s true that the FDIC says it will do so. As their website states:

The standard insurance amount is $250,000 per depositor, per insured bank, for each account ownership category.

However, the question is: Does the FDIC have the wherewithal to fulfill its promise?

In the event of a major financial crisis, the answer is “no.” Not even close.

The Elliott Wave Theorist is a monthly publication which provides analysis of financial markets and social trends and here’s what the Theorist said in August 2008, near the middle of the 2007-2009 financial crisis:

The FDIC is not funded well enough to bail out even a handful of the biggest banks in America. It has enough money to pay depositors of about three big banks. After that, it’s broke.

No doubt, most bank depositors would be shocked to learn this.

But think about it: No single entity could possibly insure all of the nation’s bank deposits.

Yet, that FDIC sticker on the front of your bank is very reassuring. The discussions with your banker about your deposit “insurance” might be reassuring.

But, something that is not quite so reassuring is from none other than a former vice-chairman of the FDIC itself. Here’s what Thomas Hoenig wrote for the Los Angeles Times in a Dec. 18, 2014 article titled, “FDIC couldn’t cover a big bank bailout without taxpayer support”:

As a reminder, when the financial industry imploded in 2008, Congress had to pass a special law to fund a $700-billion bailout … . The Federal Deposit Insurance Corp. had nowhere near enough resources to fund their resolution. [emphasis added]

Here’s another insight from the new March Elliott Wave Theorist:

Did you know that most of the FDIC’s money comes from other banks? This funding scheme makes prudent banks pay to save the imprudent ones, imparting weaker banks’ frailty to the stronger ones.

The best way to protect your deposits is to adequately research the banks in your community and pick one where the banks’ officers handle their customers’ deposits prudently.

The new March Elliott Wave Theorist elaborates on safe banking in the U.S. as well as worldwide and admonishes readers to “act while you can.”

Why?

Well, the next financial downturn may be severe enough to put many banks at risk of collapse.

This can happen quickly. Just recall the speed with which the global financial system found itself on the brink of a so-called “financial Armageddon” back in 2008.

Here in 2022, the new Theorist describes “four conditions in place at many banks that pose a danger” and one of them is exposure to leveraged “derivatives” — a word the world became familiar with during the 2007-2009 financial crisis.

But, getting back to protecting your deposits, there are other steps you may want to consider taking beyond doing research on the banks in your community.

Indeed, the new Theorist mentions “a special offshore bank” and says it “appears to be one of the safest in the world.”

Safe banking is a timely topic because the Elliott wave model strongly suggests that the next financial downturn may arrive a lot sooner than many market and economic observers expect.

If you’d like to learn how the Elliott wave model can help you to anticipate financial change, you are encouraged to read Frost & Prechter’s Wall Street classic, Elliott Wave Principle: Key to Market Behavior.

Here’s a quote from the book:

Without Elliott, there appear to be an infinite number of possibilities for market action. What the Wave Principle provides is a means of first limiting the possibilities and then ordering the relative probabilities of possible future market paths. Elliott’s highly specific rules reduce the number of valid alternatives to a minimum.

You may be interested in knowing that you can read the entire online version of this definitive text on the Elliott wave model for free!

The only requirement for free access is a Club EWI membership, which is also free. In case you’re unfamiliar with Club EWI, there are close to 500,000 worldwide members and all of them have free access to a wealth of Club EWI resources on investing and trading – without any obligations. That’s the benefit of a Club EWI membership.

Hop on the Club EWI bandwagon now by following this link: Elliott Wave Principle: Key to Market Behavior – free and unlimited access.

This article was syndicated by Elliott Wave International and was originally published under the headline The Stunning Truth About the FDIC and Your Bank Deposits. EWI is the world’s largest market forecasting firm. Its staff of full-time analysts led by Chartered Market Technician Robert Prechter provides 24-hour-a-day market analysis to institutional and private investors around the world.

USDCHF Intermediate Double Zigzag To End Near 0.904

By Orbex

USDCHF

The structure of USDCHF hints that at the end of November, the actionary wave y of the cycle degree ended. This was followed by a cycle intervening wave x.

The intervening wave x takes the form of a primary triple Ⓦ-Ⓧ-Ⓨ-Ⓧ-Ⓩ zigzag. Currently, there is a decrease in the price in the final wave Ⓩ, which takes the form of an intermediate double (W)-(X)-(Y) zigzag.

In the near future, the intermediate wave (Y) could end at the level of 0.904, as shown on the chart. At that level, wave x will be at 76.4% of wave y.

After the end of wave x, bulls can update the previous high of 0.937, marked by the intervening wave y.

USDCHF

According to an alternative scenario, the formation of the cycle intervening wave x is fully complete. Now we are seeing a price increase and the development of a cycle wave z.

The intervening wave Ⓧ took the form of a triple zigzag (W)-(X)-(Y)-(X)-(Z). The final actionary wave Ⓨ can likely be a double (W)-(X)-(Y) zigzag.

The intermediate wave (Y) could end at the 0.952 area. At that level, cycle waves z and y will be equal.

Join our responsible trading community – Open your Orbex account now!


Orbex-LogoArticle by Orbex

Orbex is a fully licensed broker that was established in 2011. Founded with a mission to serve its traders responsibly and provides traders with access to the world’s largest and most liquid financial markets. www.orbex.com

The US is banning Russian oil imports, but an embargo that includes European allies would have more impact

By Amy Myers Jaffe, Tufts University 

President Joe Biden announced on March 8, 2022, that the U.S. will ban imports of oil from Russia, along with refined petroleum products, natural gas and coal. The ban is the latest U.S. action designed to punish Russia for its invasion of Ukraine. Global energy policy expert Amy Myers Jaffe explains how this step is likely to affect oil prices – and Russia.

How important is Russia as a US oil supplier?

Russia produces close to 11 million barrels per day of crude oil. It uses roughly half of this output for its own internal demand, which presumably has increased due to higher military fuel requirements, and it exports 5 million to 6 million barrels per day.

Today, Russia is the second largest crude oil producer in the world, behind the U.S. and ahead of Saudi Arabia, but sometimes that order shifts. Russia earned over US$110 billion in 2021 from oil exports, twice as much as its earnings from natural gas exports.

For the U.S., Russia is a relatively small oil source. In 2021 it provided 8% of U.S. imports of crude oil and petroleum products. At times in recent years that share has increased, after events such as sanctions on Venezuela and storms that disrupted offshore production last year in the U.S. Gulf of Mexico.

But Russian crude oil is not really a baseload staple for U.S. refiners. Purchases were down to 84,000 barrels per day when the Biden Administration formally announced the import ban. It will be a minor inconvenience for U.S. refiners to avoid Russian oil.

And the reverse is also true: U.S. purchases barely register on Russia’s massive oil earnings. To be effective, individual country bans must be aggregated across many countries to produce consequences that actually affect the Russian purse.

President Joe Biden announced on March 8, 2022, that the U.S. would ban imports of Russian oil.

What about other countries that buy Russian oil?

The challenge to institute similar bans is much harder for Europe. The United Kingdom, which is an oil producer, is also banning Russian oil imports, but getting other G-7 nations like Germany, Italy and Japan to join will be a hard diplomatic lift. It’s not impossible, but Germany – the largest economy in Europe – currently is holding off, though it is making plans to find alternatives.

About half of Russia’s exported oil is shipped to European countries, including Germany, Italy, the Netherlands, Poland, Finland, Lithuania, Greece, Romania and Bulgaria. China is another large buyer: It imports 1.6 million barrels per day of Russian crude oil.

It remains to be seen whether China will take any extra Russian oil, which is likely to be highly discounted, and swap it out by releasing other barrels that could be scooped up by European refiners. India has already bought Russian crude cargoes at a sharp discount.

Since oil is a relatively fungible global commodity, at least some of Russia’s crude exports to Europe and other countries that may choose to join the U.S. and U.K. in imposing oil sanctions may wind up being sent somewhere else. That would free up other supplies from sources such as Norway, Angola and Saudi Arabia to be redirected back to Europe.

Russia’s oil has high sulfur and other impurities, so refining it requires specialized equipment – it can’t be sold just anywhere. But other Asian buyers can take it, including India and Thailand.

Can European nations get oil from other sources?

Europe and the U.S. could simultaneously increase crude oil sales from their national strategic stocks to lessen the blow of any further restrictions on Russian crude oil imports to the G-7. The U.S. is already selling 1.3 million barrels per day from its Strategic Petroleum Reserve and has said it will increase these flows. China has also released oil from its national strategic stocks to help ease oil prices.

Still, determining how much strategic oil to release at once depends on perceptions about the duration of the conflict and whether it could escalate beyond Ukraine. Those are both unknowns.

The U.S. and other G-7 members also could ask Middle East countries to relax destination restrictions on their crude oil shipments, and press countries like China and India to redirect other oils of similar quality to Russian oil back to Europe if and when they increase their purchases from Moscow. Such steps would help ameliorate additional upward price impact of any future G-7 restrictions on Russian oil imports.

It’s not certain that China and India would cooperate, but it would be in their interests to do so. They are major oil importers and would not want to see higher crude oil prices.

How are reduced oil purchases from Russia likely to affect world oil prices?

One effect is already clear: Markets have anticipated possible energy sanctions on Russia by discounting Russian crude. Refiners who aren’t obligated by firm legal contracts to take delivery of it are shunning spot, or non-contract, cargoes exiting Russian ports.

One trade publication estimates that this has resulted in roughly 1.6 million barrels per day of Russian oil failing to find buyers The result is a large-scale disruption in global oil supplies that is already boosting prices, even though the physical oil is still available in principle.

There’s a limit to how much oil is available to replace lost Russian crude exports. Most exporters are maxed out in terms of crude oil production, but a few of the largest Middle East producers could surge their output in the short term to put an extra 1 million barrels per day or more onto the market.

The Biden administration has been continuing talks with Iran to restart the nuclear deal suspended by President Trump in 2018. If that happens, Iranian oil exports might rise from 800,000 barrels per day now to about 1.5 million barrels per day within three months or so.

But Russia is a party to the nuclear deal and has demanded guarantees that its economic trade with Iran will be exempt from any sanctions associated with Russia’s invasion of Ukraine. That demand has slowed diplomatic progress.

Saudi Arabia has access to large stores of crude oil in its vast global tank system and its tankers that float at sea. In 2014, when Russia invaded Crimea, U.S. allies in the Persian Gulf held over 70 million barrels in storage near Fujairah in the United Arab Emirates. They did this as a threat to Russia that a price war would ensue if Russian troops moved beyond that peninsula. Russia stayed in Crimea, so the oil was not released.

The Saudis have launched price wars that hurt Russia’s economy before, in 1986, 1998, 2009 and again briefly in 2020. But today’s oil market conditions make a price war an unlikely outcome, given the existing tight balance between supply and demand. The only scenario that could trigger a price war now would be if global demand were to contract suddenly because of a recession.

This is an update of an article originally published on March 1, 2022.The Conversation

About the Author:

Amy Myers Jaffe, Research professor, Fletcher School of Law and Diplomacy, Tufts University

This article is republished from The Conversation under a Creative Commons license. Read the original article.