
By InvestMacro
Here are the latest charts and statistics for the Commitment of Traders (COT) data published by the Commodities Futures Trading Commission (CFTC).
The latest COT data is updated through Tuesday February 21st and shows a quick view of how large traders (for-profit speculators and commercial entities) were positioned in the futures markets.
*** This data is still a few weeks behind the current data because the CFTC up-to-date data has been delayed due to a cybersecurity event that happened in early February to ION Cleared Derivatives (a subsidiary of ION Markets). This hack of ION has created a problem for the large trader positions to be reported and reconciled. The CFTC has back-filled some data over the past few weeks and will get the data back up to date in the coming weeks.
Weekly Speculator Changes led by S&P500-Mini & Russell-Mini
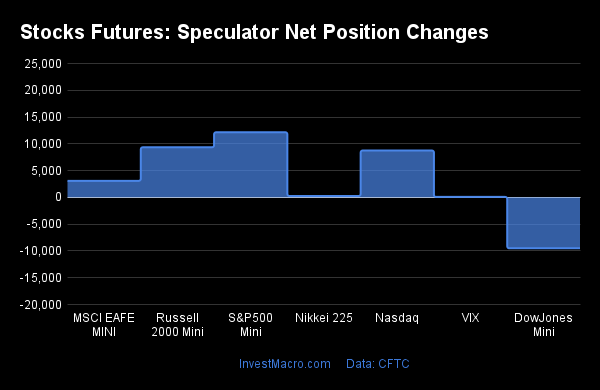
The COT stock markets speculator bets were higher through February 21st as six out of the seven stock markets we cover had higher positioning while the other one market had lower speculator contracts.
Leading the gains for the stock markets was S&P500-Mini (12,163 contracts), Russell-Mini (9,360 contracts), Nasdaq-Mini (8,755 contracts), MSCI EAFE-Mini (3,092 contracts), Nikkei 225 (260 contracts) and VIX (89 contracts) showing positive weeks.
The market with the declines in speculator bets was DowJones-Mini (-9,507 contracts).
| Feb-21-2023 | OI | OI-Index | Spec-Net | Spec-Index | Com-Net | COM-Index | Smalls-Net | Smalls-Index |
|---|---|---|---|---|---|---|---|---|
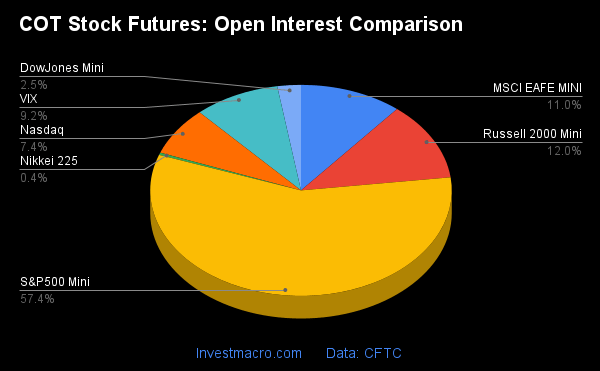
| S&P500-Mini | 2,074,486 | 4 | -234,291 | 13 | 241,153 | 83 | -6,862 | 25 |
| Nikkei 225 | 12,849 | 6 | -2,022 | 68 | 1,824 | 39 | 198 | 31 |
| Nasdaq-Mini | 268,297 | 53 | -14,069 | 67 | 34,620 | 48 | -20,551 | 13 |
| DowJones-Mini | 91,288 | 58 | -16,245 | 28 | 17,594 | 74 | -1,349 | 34 |
| VIX | 333,082 | 51 | -56,108 | 74 | 62,408 | 27 | -6,300 | 61 |
| Nikkei 225 Yen | 41,957 | 25 | 12,005 | 71 | 431 | 12 | -12,436 | 51 |
Strength Scores led by VIX & Nikkei 225 Yen
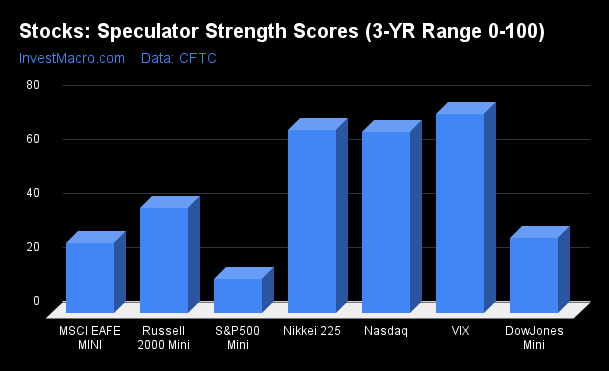
COT Strength Scores (a normalized measure of Speculator positions over a 3-Year range, from 0 to 100 where above 80 is Extreme-Bullish and below 20 is Extreme-Bearish) showed that the VIX (74 percent) and the Nikkei 225 Yen (71 percent) led the stock markets through February 21st. The Nikkei 225 (68 percent) and Nasdaq-Mini (67 percent) came in as the next highest in the weekly strength scores.
On the downside, the S&P500-Mini (13 percent) came in at the lowest strength level currently and is in Extreme-Bearish territory (below 20 percent). The next lowest strength score is the MSCI EAFE-Mini (26 percent).
Strength Statistics:
VIX (74.0 percent) vs VIX previous week (73.9 percent)
S&P500-Mini (12.8 percent) vs S&P500-Mini previous week (10.5 percent)
DowJones-Mini (28.0 percent) vs DowJones-Mini previous week (49.3 percent)
Nasdaq-Mini (67.2 percent) vs Nasdaq-Mini previous week (62.3 percent)
Russell2000-Mini (39.2 percent) vs Russell2000-Mini previous week (33.6 percent)
Nikkei USD (67.9 percent) vs Nikkei USD previous week (66.6 percent)
EAFE-Mini (26.0 percent) vs EAFE-Mini previous week (22.2 percent)
VIX & Nikkei 225 Yen top the 6-Week Strength Trends
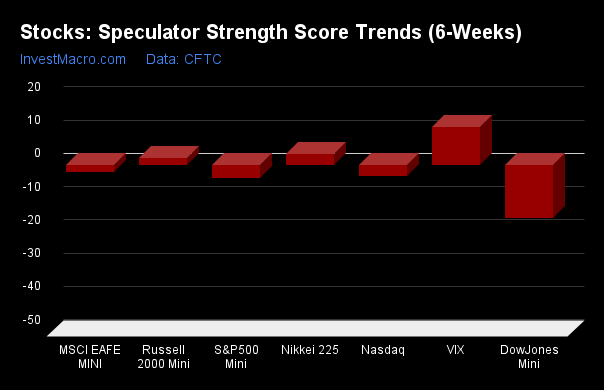
COT Strength Score Trends (or move index, calculates the 6-week changes in strength scores) showed that the VIX (12 percent) led the six weeks trends for the stock markets. The Nikkei 225 Yen (9 percent), the Nikkei 225 (3 percent) and the Russell-Mini (2 percent) are the next highest positive movers in the latest trends data.
The DowJones-Mini (-16 percent) led the downside trend scores with the S&P500-Mini (-4 percent) coming in as the next market with lower trend scores.
Strength Trend Statistics:
VIX (11.5 percent) vs VIX previous week (8.1 percent)
S&P500-Mini (-3.9 percent) vs S&P500-Mini previous week (-14.7 percent)
DowJones-Mini (-15.9 percent) vs DowJones-Mini previous week (11.5 percent)
Nasdaq-Mini (-3.3 percent) vs Nasdaq-Mini previous week (-13.5 percent)
Russell2000-Mini (2.1 percent) vs Russell2000-Mini previous week (0.9 percent)
Nikkei USD (3.3 percent) vs Nikkei USD previous week (3.3 percent)
EAFE-Mini (-1.9 percent) vs EAFE-Mini previous week (-14.8 percent)
Individual Stock Market Charts:
VIX Volatility Futures:
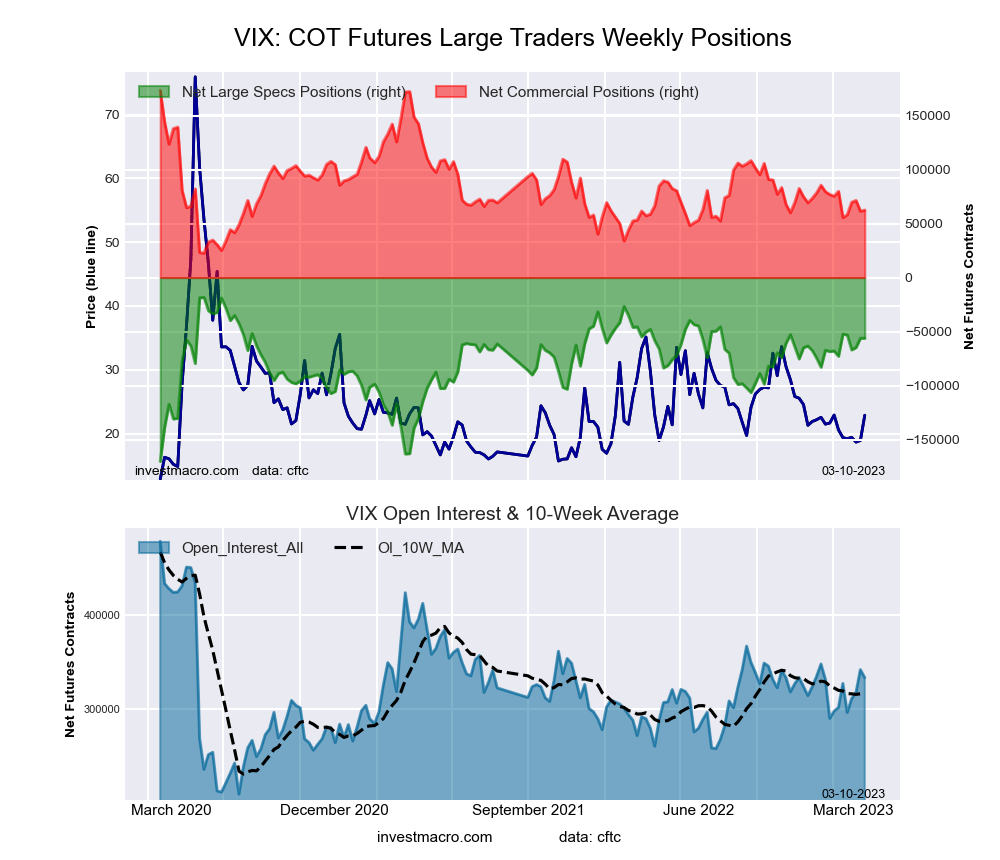 The VIX Volatility large speculator standing the week reached a net position of -56,108 contracts in the data reported through Tuesday February 21st. This was a weekly lift of 89 contracts from the previous week which had a total of -56,197 net contracts.
The week’s current strength score (the trader positioning range over the past three years, measured from 0 to 100) shows the speculators are currently Bullish with a score of 74.0 percent. The commercials are Bearish with a score of 26.7 percent and the small traders (not shown in chart) are Bullish with a score of 60.8 percent.
| VIX Volatility Futures Statistics | SPECULATORS | COMMERCIALS | SMALL TRADERS |
| – Percent of Open Interest Longs: | 15.4 | 55.5 | 7.0 |
| – Percent of Open Interest Shorts: | 32.2 | 36.8 | 8.9 |
| – Net Position: | -56,108 | 62,408 | -6,300 |
| – Gross Longs: | 51,233 | 184,968 | 23,405 |
| – Gross Shorts: | 107,341 | 122,560 | 29,705 |
| – Long to Short Ratio: | 0.5 to 1 | 1.5 to 1 | 0.8 to 1 |
| NET POSITION TREND: | |||
| – Strength Index Score (3 Year Range Pct): | 74.0 | 26.7 | 60.8 |
| – Strength Index Reading (3 Year Range): | Bullish | Bearish | Bullish |
| NET POSITION MOVEMENT INDEX: | |||
| – 6-Week Change in Strength Index: | 11.5 | -11.6 | 3.4 |
S&P500 Mini Futures:
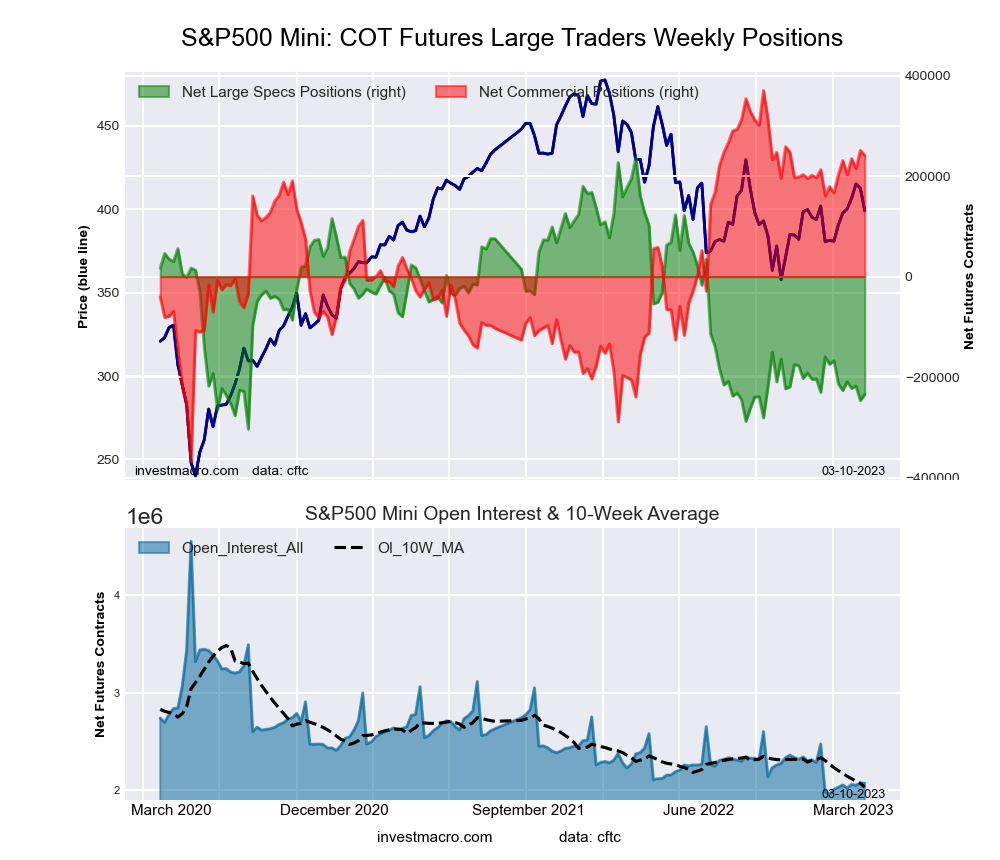 The S&P500 Mini large speculator standing the week reached a net position of -234,291 contracts in the data reported through Tuesday February 21st. This was a weekly gain of 12,163 contracts from the previous week which had a total of -246,454 net contracts.
The week’s current strength score (the trader positioning range over the past three years, measured from 0 to 100) shows the speculators are currently Bearish-Extreme with a score of 12.8 percent. The commercials are Bullish-Extreme with a score of 82.5 percent and the small traders (not shown in chart) are Bearish with a score of 24.9 percent.
| S&P500 Mini Futures Statistics | SPECULATORS | COMMERCIALS | SMALL TRADERS |
| – Percent of Open Interest Longs: | 11.2 | 74.4 | 12.1 |
| – Percent of Open Interest Shorts: | 22.5 | 62.7 | 12.5 |
| – Net Position: | -234,291 | 241,153 | -6,862 |
| – Gross Longs: | 231,808 | 1,542,524 | 251,654 |
| – Gross Shorts: | 466,099 | 1,301,371 | 258,516 |
| – Long to Short Ratio: | 0.5 to 1 | 1.2 to 1 | 1.0 to 1 |
| NET POSITION TREND: | |||
| – Strength Index Score (3 Year Range Pct): | 12.8 | 82.5 | 24.9 |
| – Strength Index Reading (3 Year Range): | Bearish-Extreme | Bullish-Extreme | Bearish |
| NET POSITION MOVEMENT INDEX: | |||
| – 6-Week Change in Strength Index: | -3.9 | 5.2 | -3.6 |
Dow Jones Mini Futures:
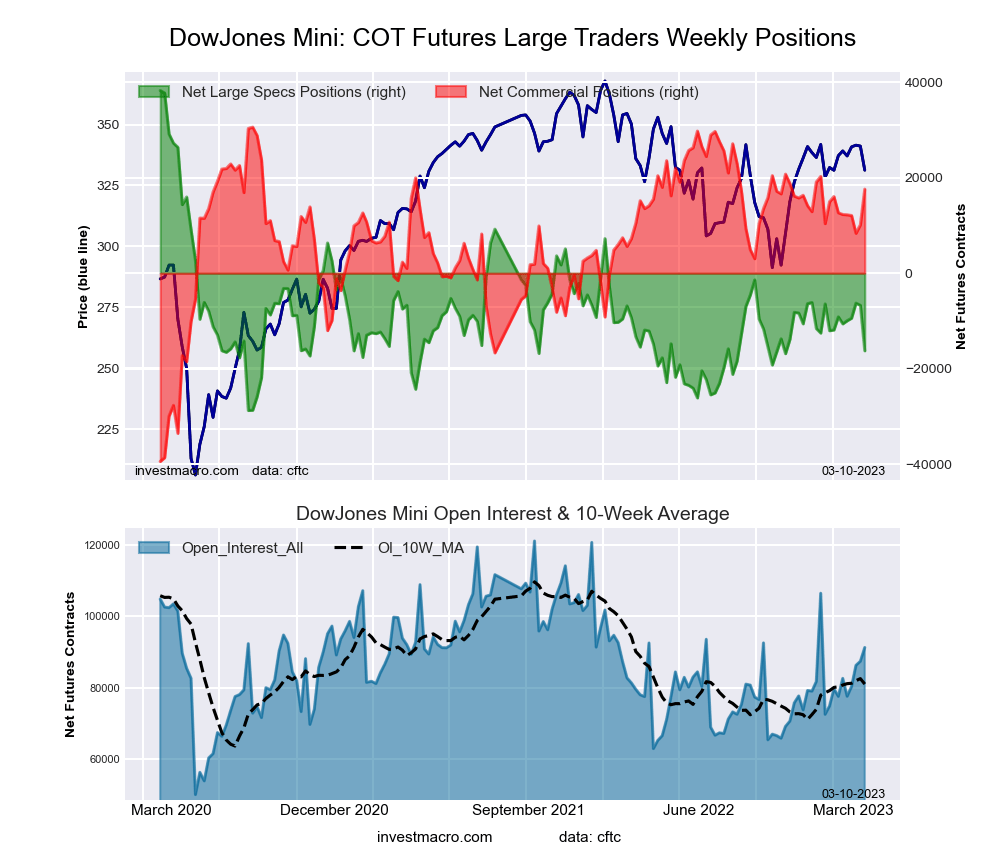 The Dow Jones Mini large speculator standing the week reached a net position of -16,245 contracts in the data reported through Tuesday February 21st. This was a weekly reduction of -9,507 contracts from the previous week which had a total of -6,738 net contracts.
The week’s current strength score (the trader positioning range over the past three years, measured from 0 to 100) shows the speculators are currently Bearish with a score of 28.0 percent. The commercials are Bullish with a score of 73.6 percent and the small traders (not shown in chart) are Bearish with a score of 33.9 percent.
| Dow Jones Mini Futures Statistics | SPECULATORS | COMMERCIALS | SMALL TRADERS |
| – Percent of Open Interest Longs: | 30.0 | 50.4 | 15.2 |
| – Percent of Open Interest Shorts: | 47.7 | 31.1 | 16.7 |
| – Net Position: | -16,245 | 17,594 | -1,349 |
| – Gross Longs: | 27,344 | 45,982 | 13,918 |
| – Gross Shorts: | 43,589 | 28,388 | 15,267 |
| – Long to Short Ratio: | 0.6 to 1 | 1.6 to 1 | 0.9 to 1 |
| NET POSITION TREND: | |||
| – Strength Index Score (3 Year Range Pct): | 28.0 | 73.6 | 33.9 |
| – Strength Index Reading (3 Year Range): | Bearish | Bullish | Bearish |
| NET POSITION MOVEMENT INDEX: | |||
| – 6-Week Change in Strength Index: | -15.9 | 10.1 | 11.1 |
Nasdaq Mini Futures:
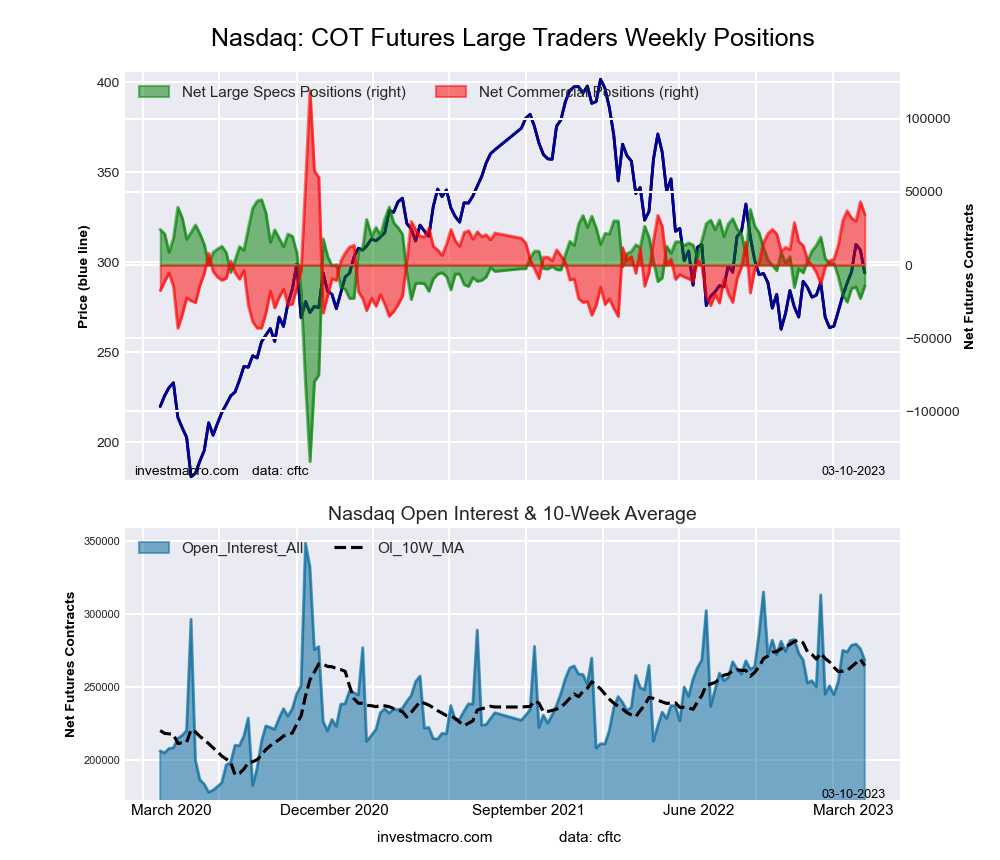 The Nasdaq Mini large speculator standing the week reached a net position of -14,069 contracts in the data reported through Tuesday February 21st. This was a weekly gain of 8,755 contracts from the previous week which had a total of -22,824 net contracts.
The week’s current strength score (the trader positioning range over the past three years, measured from 0 to 100) shows the speculators are currently Bullish with a score of 67.2 percent. The commercials are Bearish with a score of 47.8 percent and the small traders (not shown in chart) are Bearish-Extreme with a score of 13.0 percent.
| Nasdaq Mini Futures Statistics | SPECULATORS | COMMERCIALS | SMALL TRADERS |
| – Percent of Open Interest Longs: | 21.6 | 63.5 | 13.0 |
| – Percent of Open Interest Shorts: | 26.8 | 50.6 | 20.7 |
| – Net Position: | -14,069 | 34,620 | -20,551 |
| – Gross Longs: | 57,849 | 170,386 | 34,896 |
| – Gross Shorts: | 71,918 | 135,766 | 55,447 |
| – Long to Short Ratio: | 0.8 to 1 | 1.3 to 1 | 0.6 to 1 |
| NET POSITION TREND: | |||
| – Strength Index Score (3 Year Range Pct): | 67.2 | 47.8 | 13.0 |
| – Strength Index Reading (3 Year Range): | Bullish | Bearish | Bearish-Extreme |
| NET POSITION MOVEMENT INDEX: | |||
| – 6-Week Change in Strength Index: | -3.3 | 12.7 | -28.2 |
Russell 2000 Mini Futures:
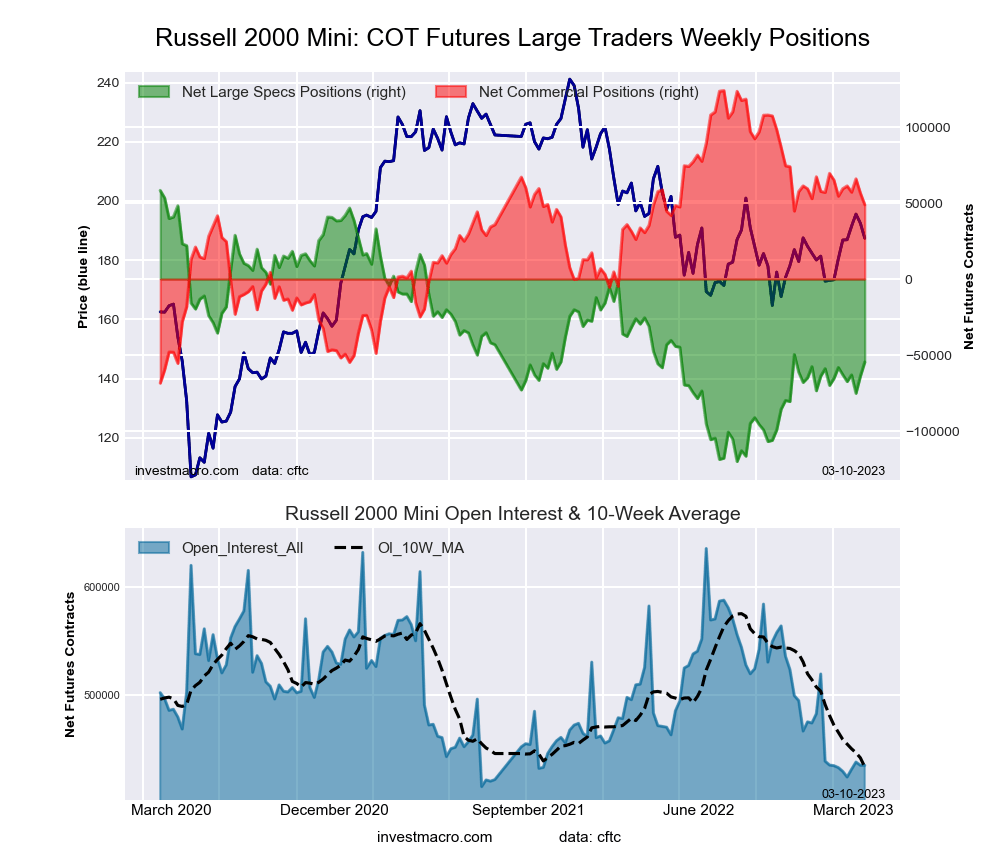 The Russell 2000 Mini large speculator standing reached a net position of -54,548 contracts in the data reported through Tuesday February 21st. This was a weekly rise of 9,360 contracts from the previous week which had a total of -63,908 net contracts.
The week’s current strength score (the trader positioning range over the past three years, measured from 0 to 100) shows the speculators are currently Bearish with a score of 39.2 percent. The commercials are Bullish with a score of 58.0 percent and the small traders (not shown in chart) are Bearish with a score of 44.2 percent.
| Russell 2000 Mini Futures Statistics | SPECULATORS | COMMERCIALS | SMALL TRADERS |
| – Percent of Open Interest Longs: | 10.3 | 81.7 | 5.8 |
| – Percent of Open Interest Shorts: | 22.9 | 70.5 | 4.5 |
| – Net Position: | -54,548 | 48,858 | 5,690 |
| – Gross Longs: | 44,927 | 355,135 | 25,214 |
| – Gross Shorts: | 99,475 | 306,277 | 19,524 |
| – Long to Short Ratio: | 0.5 to 1 | 1.2 to 1 | 1.3 to 1 |
| NET POSITION TREND: | |||
| – Strength Index Score (3 Year Range Pct): | 39.2 | 58.0 | 44.2 |
| – Strength Index Reading (3 Year Range): | Bearish | Bullish | Bearish |
| NET POSITION MOVEMENT INDEX: | |||
| – 6-Week Change in Strength Index: | 2.1 | -3.2 | 6.5 |
Nikkei Stock Average (USD) Futures:
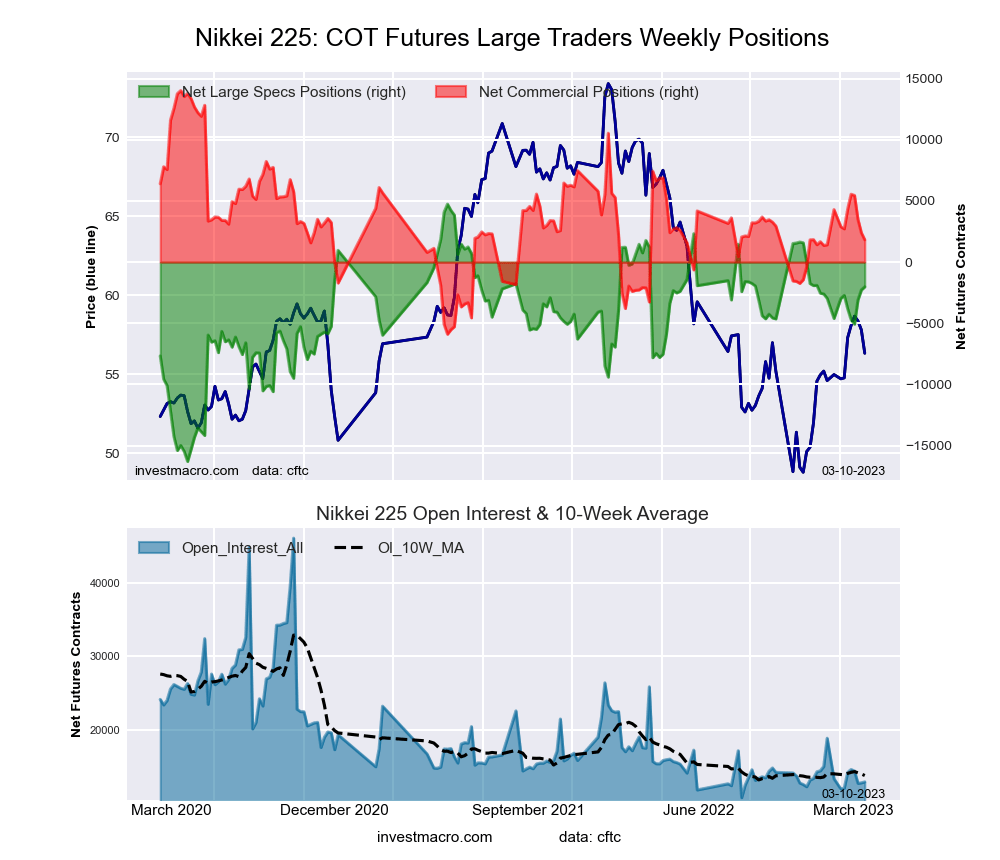 The Nikkei Stock Average (USD) large speculator standing the week reached a net position of -2,022 contracts in the data reported through Tuesday February 21st. This was a weekly rise of 260 contracts from the previous week which had a total of -2,282 net contracts.
The week’s current strength score (the trader positioning range over the past three years, measured from 0 to 100) shows the speculators are currently Bullish with a score of 67.9 percent. The commercials are Bearish with a score of 38.8 percent and the small traders (not shown in chart) are Bearish with a score of 30.8 percent.
| Nikkei Stock Average Futures Statistics | SPECULATORS | COMMERCIALS | SMALL TRADERS |
| – Percent of Open Interest Longs: | 25.1 | 49.0 | 25.9 |
| – Percent of Open Interest Shorts: | 40.8 | 34.8 | 24.4 |
| – Net Position: | -2,022 | 1,824 | 198 |
| – Gross Longs: | 3,225 | 6,296 | 3,328 |
| – Gross Shorts: | 5,247 | 4,472 | 3,130 |
| – Long to Short Ratio: | 0.6 to 1 | 1.4 to 1 | 1.1 to 1 |
| NET POSITION TREND: | |||
| – Strength Index Score (3 Year Range Pct): | 67.9 | 38.8 | 30.8 |
| – Strength Index Reading (3 Year Range): | Bullish | Bearish | Bearish |
| NET POSITION MOVEMENT INDEX: | |||
| – 6-Week Change in Strength Index: | 3.3 | -4.5 | 2.5 |
MSCI EAFE Mini Futures:
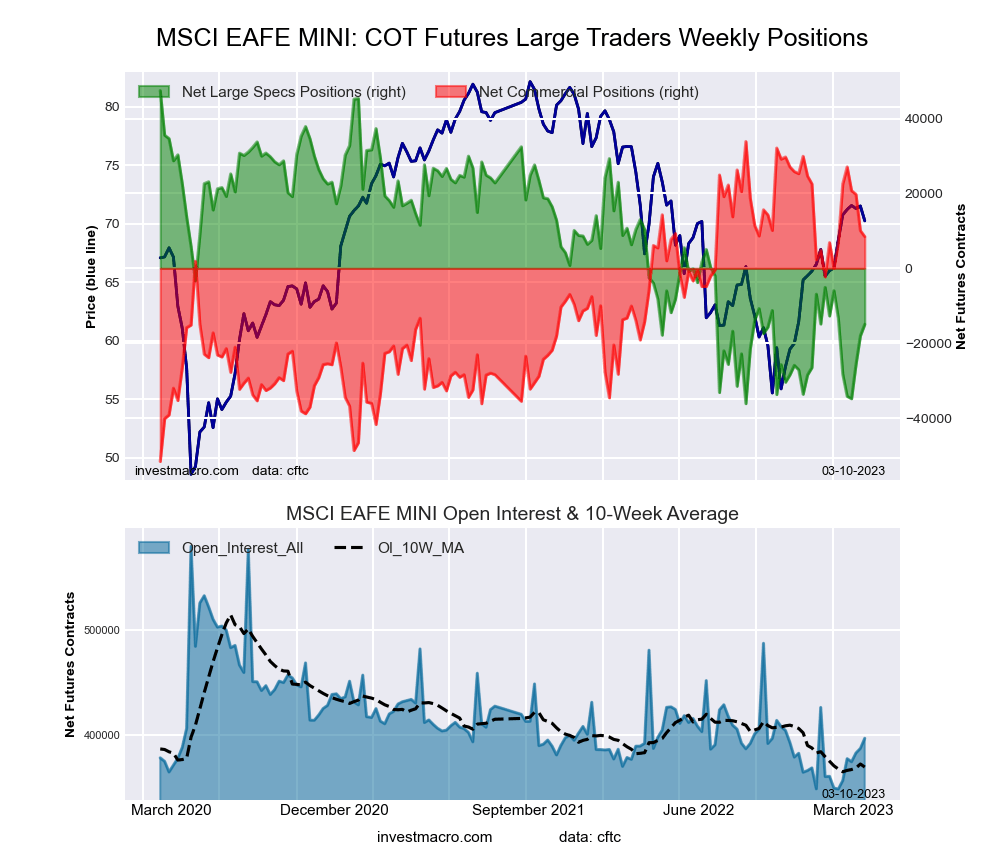 The MSCI EAFE Mini large speculator standing the week reached a net position of -14,968 contracts in the data reported through Tuesday February 21st. This was a weekly gain of 3,092 contracts from the previous week which had a total of -18,060 net contracts.
The week’s current strength score (the trader positioning range over the past three years, measured from 0 to 100) shows the speculators are currently Bearish with a score of 26.0 percent. The commercials are Bullish with a score of 69.2 percent and the small traders (not shown in chart) are Bullish with a score of 56.7 percent.
| MSCI EAFE Mini Futures Statistics | SPECULATORS | COMMERCIALS | SMALL TRADERS |
| – Percent of Open Interest Longs: | 8.1 | 88.3 | 3.1 |
| – Percent of Open Interest Shorts: | 11.9 | 86.2 | 1.5 |
| – Net Position: | -14,968 | 8,460 | 6,508 |
| – Gross Longs: | 32,258 | 350,496 | 12,286 |
| – Gross Shorts: | 47,226 | 342,036 | 5,778 |
| – Long to Short Ratio: | 0.7 to 1 | 1.0 to 1 | 2.1 to 1 |
| NET POSITION TREND: | |||
| – Strength Index Score (3 Year Range Pct): | 26.0 | 69.2 | 56.7 |
| – Strength Index Reading (3 Year Range): | Bearish | Bullish | Bullish |
| NET POSITION MOVEMENT INDEX: | |||
| – 6-Week Change in Strength Index: | -1.9 | 1.8 | 0.4 |
Article By InvestMacro – Receive our weekly COT Newsletter
*COT Report: The COT data, released weekly to the public each Friday, is updated through the most recent Tuesday (data is 3 days old) and shows a quick view of how large speculators or non-commercials (for-profit traders) were positioned in the futures markets.
The CFTC categorizes trader positions according to commercial hedgers (traders who use futures contracts for hedging as part of the business), non-commercials (large traders who speculate to realize trading profits) and nonreportable traders (usually small traders/speculators) as well as their open interest (contracts open in the market at time of reporting). See CFTC criteria here.


