COT Energy Charts: Speculator Bets led by Gasoline & Bloomberg Index

By InvestMacro

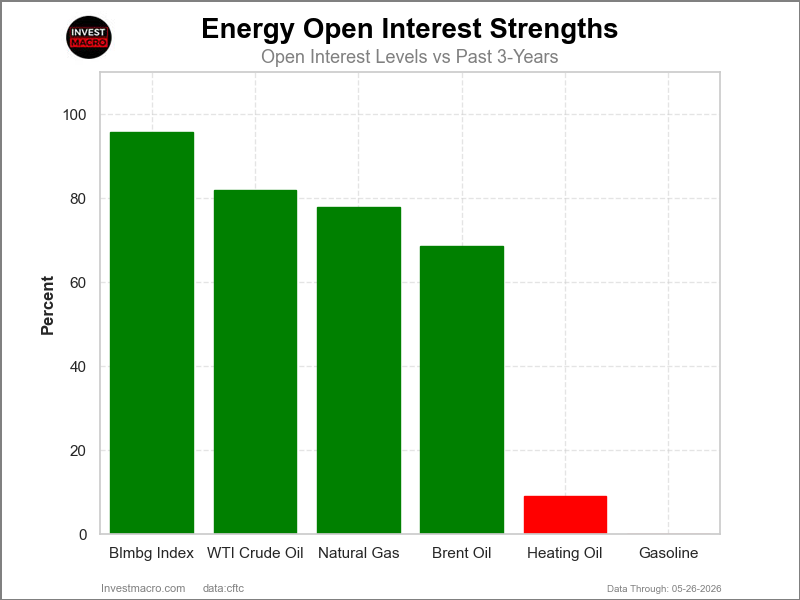
Speculators OI Energy Futures COT Chart
Here are the latest charts and statistics for the Commitment of Traders (COT) data published by the Commodities Futures Trading Commission (CFTC).

The latest COT data is updated through Tuesday May 26th and shows a quick view of how large traders (for-profit speculators and commercial entities) were positioned in the futures markets.

Weekly Speculator Changes led by Gasoline & Bloomberg Index
Speculators Nets Energy Futures COT Chart
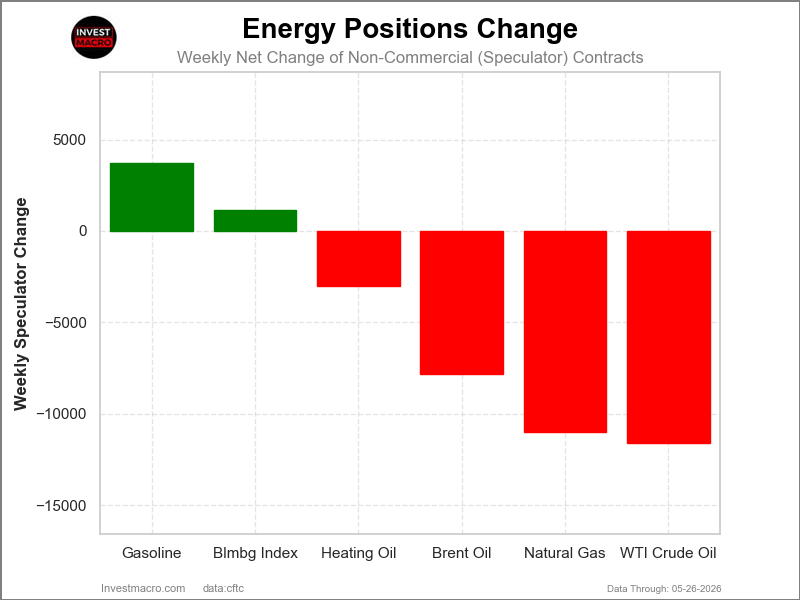
The COT energy market speculator bets were overall lower this week as two out of the six energy markets we cover had higher positioning while the other four markets had lower speculator contracts.

Leading the gains for the energy markets was Gasoline (3,698 contracts) with the Bloomberg Index (1,152 contracts) also seeing a positive week.

The markets with declines in speculator bets for the week were WTI Crude (-11,582 contracts), Natural Gas (-10,985 contracts), Brent Oil (-7,848 contracts) and with Heating Oil (-3,036 contracts) also seeing lower bets on the week.

Natural Gas leads Energy market price performances

In the Energy markets this week, Natural Gas was the only market that saw a higher five-day percentage gain. Natural Gas jumped by over 14% with a 14.74% rise over the past week.

On the downside, the Bloomberg Commodity Index dipped by -2.93% on the week, followed by WTI Crude Oil, which slid by -3.42%. Heating Oil was down by -6.68%, while Gasoline saw a similar -6.74% decrease.

Finally, the biggest decliner on the week was Brent Crude Oil with a -10.93% shortfall on the week.


Energy Data:
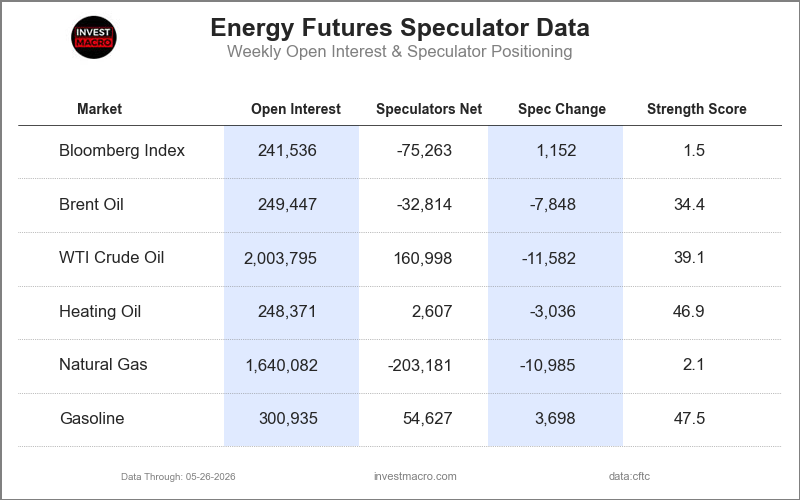
Speculators Table Energy Futures COT Chart
Legend: Weekly Speculators Change | Speculators Current Net Position | Speculators Strength Score compared to last 3-Years (0-100 range)


Strength Scores led by Gasoline & Heating Oil
Speculators Strength Energy Futures COT Chart
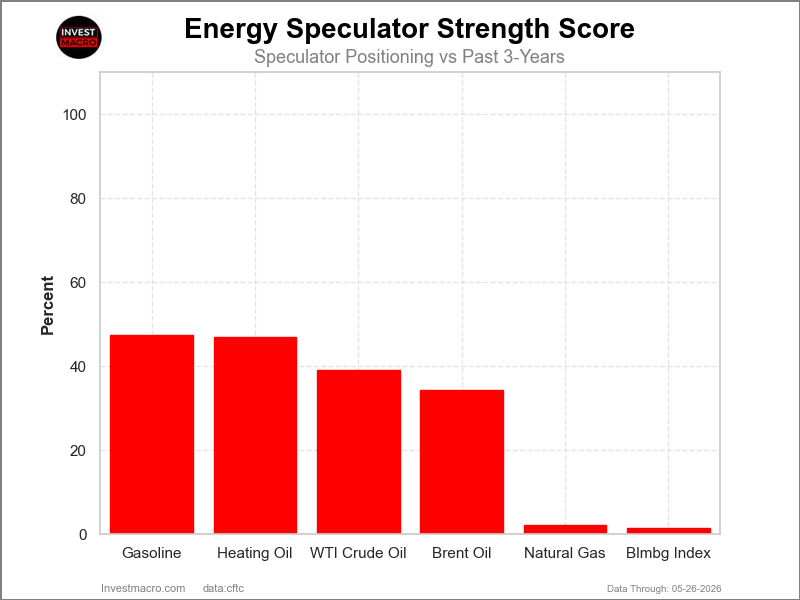
COT Strength Scores (a normalized measure of Speculator positions over a 3-Year range, from 0 to 100 where above 80 is Extreme-Bullish and below 20 is Extreme-Bearish) showed that Gasoline (47.5 percent) and Heating Oil (46.9 percent) lead the energy markets this week.

On the downside, the Bloomberg Index (1.5 percent) and Natural Gas (2.1 percent) comes in at the lowest strength level currently and is in Extreme-Bearish territory (below 20 percent). The next lowest strength score was Brent Oil (34.4 percent).

Strength Statistics:
WTI Crude Oil (39.1 percent) vs WTI Crude Oil previous week (42.8 percent)
Brent Crude Oil (34.4 percent) vs Brent Crude Oil previous week (45.6 percent)
Natural Gas (2.1 percent) vs Natural Gas previous week (9.1 percent)
Gasoline (47.5 percent) vs Gasoline previous week (43.4 percent)
Heating Oil (46.9 percent) vs Heating Oil previous week (50.9 percent)
Bloomberg Commodity Index (1.5 percent) vs Bloomberg Commodity Index previous week (0.3 percent)


Gasoline & Bloomberg Index top the 6-Week Strength Trends
Speculators Trend Energy Futures COT Chart
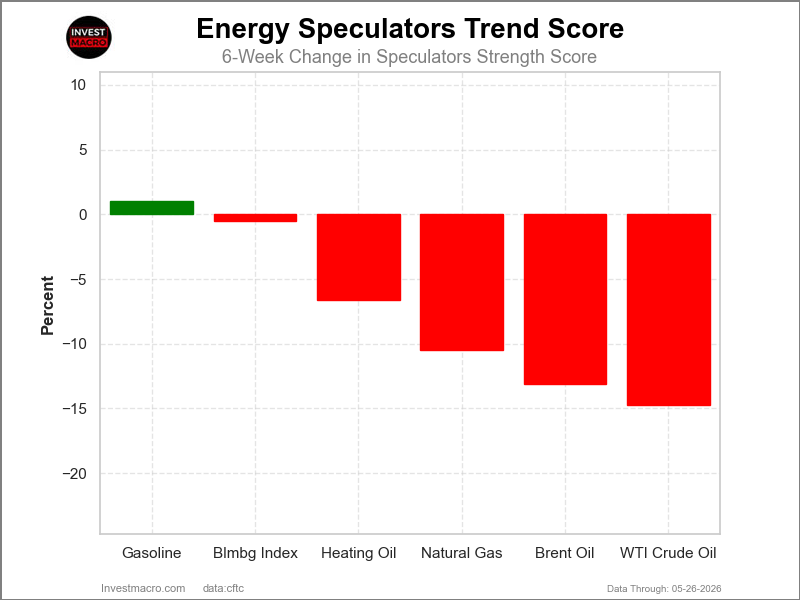
COT Strength Score Trends (or move index, calculates the 6-week changes in strength scores) showed that Gasoline (1.0 percent) leads the past six weeks trends for the energy markets and is the only positive mover at the moment.

WTI Crude (-14.7 percent) leads the downside trend scores currently with Brent Oil (-13.1 percent) as the next market with lower trend scores.

Move Statistics:
WTI Crude Oil (-14.7 percent) vs WTI Crude Oil previous week (-9.5 percent)
Brent Crude Oil (-13.1 percent) vs Brent Crude Oil previous week (8.8 percent)
Natural Gas (-10.5 percent) vs Natural Gas previous week (-5.3 percent)
Gasoline (1.0 percent) vs Gasoline previous week (-9.6 percent)
Heating Oil (-6.6 percent) vs Heating Oil previous week (-4.3 percent)
Bloomberg Commodity Index (-0.5 percent) vs Bloomberg Commodity Index previous week (-1.1 percent)


Individual COT Market Charts:

WTI Crude Oil Futures Futures:
WTI Crude Oil Futures COT ChartPositioning Notes:

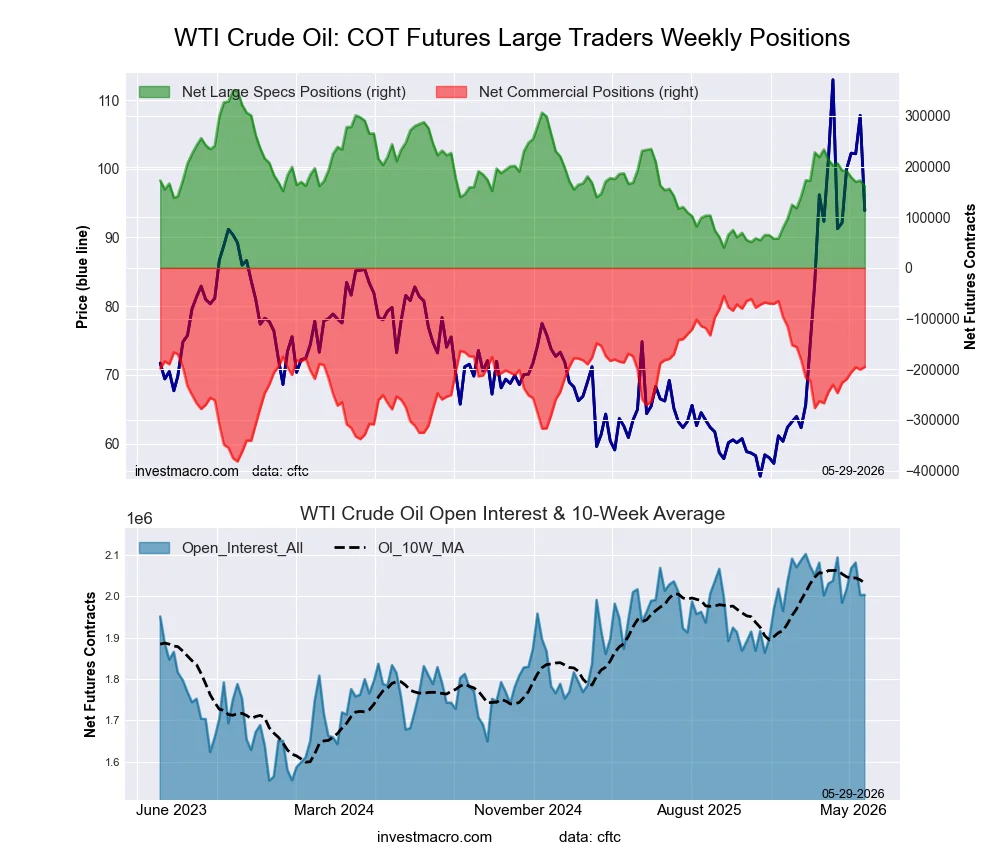
  • WTI Crude Oil Futures large speculator standing this week reached a net position of 160,998 contracts in the data reported through Tuesday.
  • Weekly Speculator position decrease of -11,582 contracts from the previous week which had a total of 172,580 net contracts.
  • This week’s current strength score (range over the past 3 years, measured from 0 to 100) shows the speculators are currently Bearish with a score of 39.1 percent.
  • The Commercials are Bullish with a score of 57.0 percent.
  • The Small Traders (not shown in chart) are Bullish with a score of 69.0 percent.

Price Trend-Following Model: Uptrend

Our weekly trend-following model classifies the current market price position as: Uptrend.

WTI Crude Oil Futures StatisticsSPECULATORSCOMMERCIALSSMALL TRADERS
– Percent of Open Interest Longs:18.945.04.1
– Percent of Open Interest Shorts:10.854.72.4
– Net Position:160,998-195,47334,475
– Gross Longs:378,088900,99782,778
– Gross Shorts:217,0901,096,47048,303
– Long to Short Ratio:1.7 to 10.8 to 11.7 to 1
NET POSITION TREND:
– Strength Index Score (3 Year Range Pct):39.157.069.0
– Strength Index Reading (3 Year Range):BearishBullishBullish
NET POSITION MOVEMENT INDEX:
– 6-Week Change in Strength Index:-14.715.7-11.7


Brent Crude Oil Futures Futures:

Brent Last Day Crude Oil Futures COT ChartPositioning Notes:

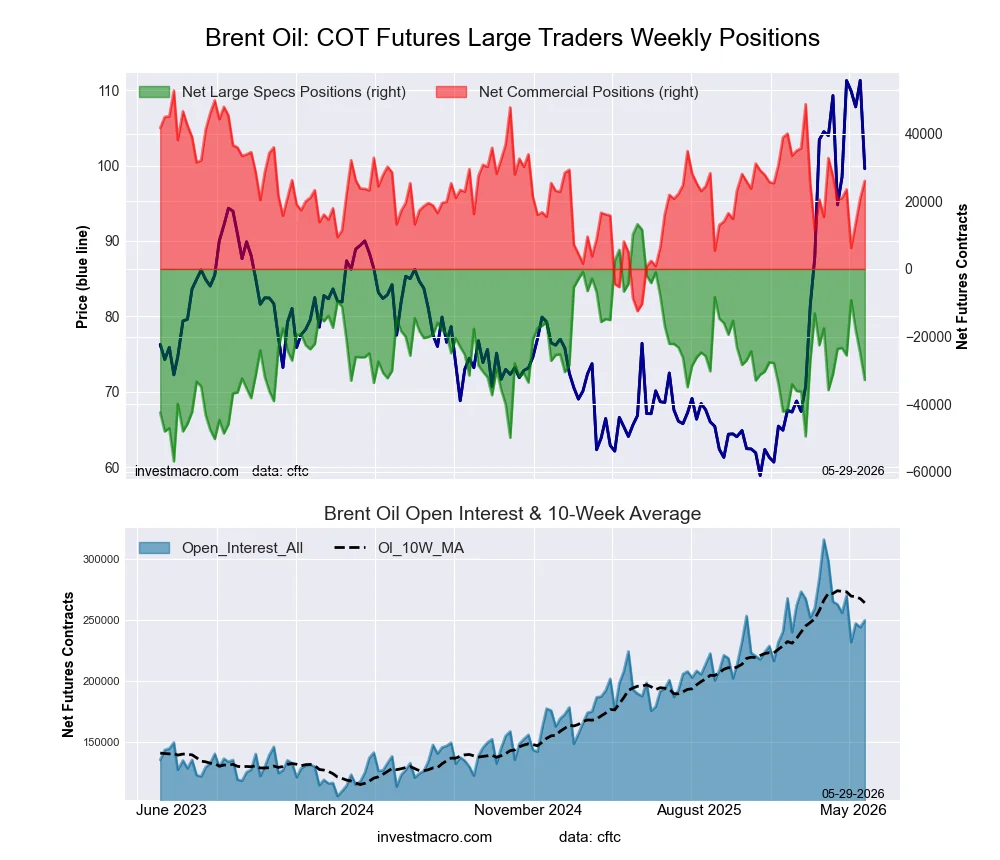
  • Brent Crude Oil Futures large speculator standing this week reached a net position of -32,814 contracts in the data reported through Tuesday.
  • Weekly Speculator position fall of -7,848 contracts from the previous week which had a total of -24,966 net contracts.
  • This week’s current strength score (range over the past 3 years, measured from 0 to 100) shows the speculators are currently Bearish with a score of 34.4 percent.
  • The Commercials are Bullish with a score of 59.1 percent.
  • The Small Traders (not shown in chart) are Bullish-Extreme with a score of 100.0 percent.

Price Trend-Following Model: Uptrend

Our weekly trend-following model classifies the current market price position as: Uptrend.

Brent Crude Oil Futures StatisticsSPECULATORSCOMMERCIALSSMALL TRADERS
– Percent of Open Interest Longs:23.335.15.1
– Percent of Open Interest Shorts:36.524.72.4
– Net Position:-32,81426,0556,759
– Gross Longs:58,11087,60312,803
– Gross Shorts:90,92461,5486,044
– Long to Short Ratio:0.6 to 11.4 to 12.1 to 1
NET POSITION TREND:
– Strength Index Score (3 Year Range Pct):34.459.1100.0
– Strength Index Reading (3 Year Range):BearishBullishBullish-Extreme
NET POSITION MOVEMENT INDEX:
– 6-Week Change in Strength Index:-13.18.636.6


Natural Gas Futures Futures:

Natural Gas Futures COT ChartPositioning Notes:

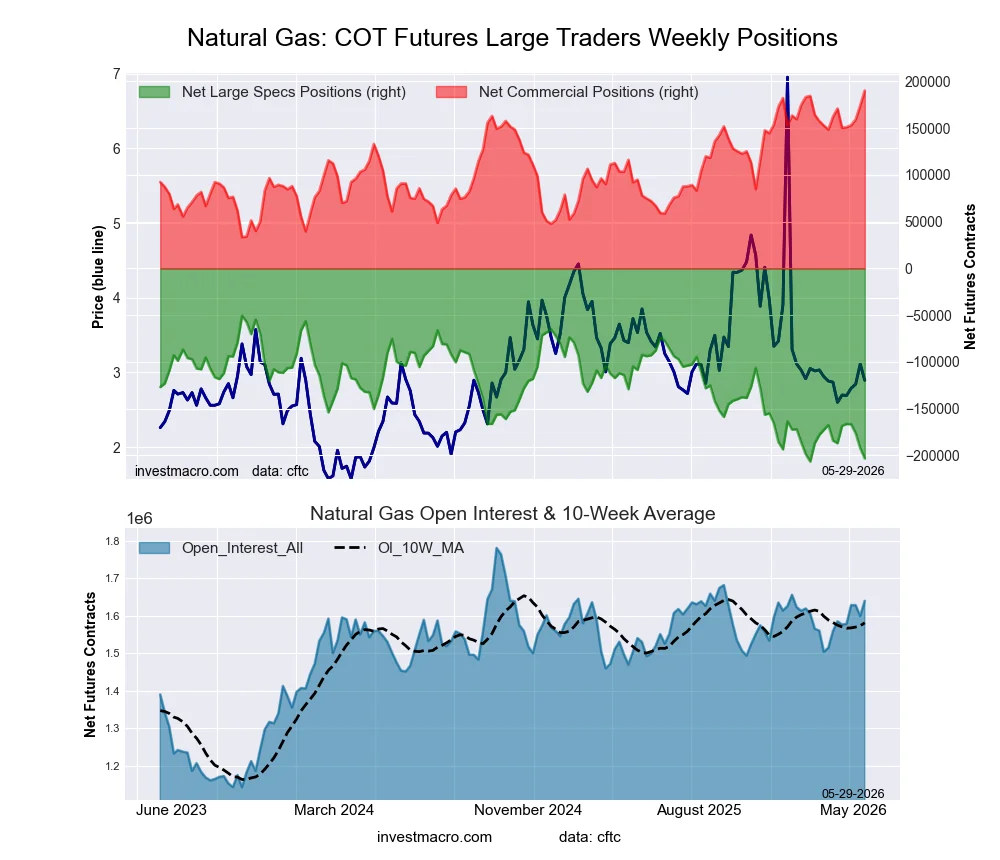
  • Natural Gas Futures large speculator standing this week reached a net position of -203,181 contracts in the data reported through Tuesday.
  • Weekly Speculator position fall of -10,985 contracts from the previous week which had a total of -192,196 net contracts.
  • This week’s current strength score (range over the past 3 years, measured from 0 to 100) shows the speculators are currently Bearish-Extreme with a score of 2.1 percent.
  • The Commercials are Bullish-Extreme with a score of 100.0 percent.
  • The Small Traders (not shown in chart) are Bearish with a score of 36.0 percent.

Price Trend-Following Model: Weak Downtrend

Our weekly trend-following model classifies the current market price position as: Weak Downtrend.

Natural Gas Futures StatisticsSPECULATORSCOMMERCIALSSMALL TRADERS
– Percent of Open Interest Longs:14.136.53.1
– Percent of Open Interest Shorts:26.424.92.4
– Net Position:-203,181190,17813,003
– Gross Longs:230,515598,59451,581
– Gross Shorts:433,696408,41638,578
– Long to Short Ratio:0.5 to 11.5 to 11.3 to 1
NET POSITION TREND:
– Strength Index Score (3 Year Range Pct):2.1100.036.0
– Strength Index Reading (3 Year Range):Bearish-ExtremeBullish-ExtremeBearish
NET POSITION MOVEMENT INDEX:
– 6-Week Change in Strength Index:-10.512.3-7.5


Gasoline Blendstock Futures Futures:

RBOB Gasoline Energy Futures COT ChartPositioning Notes:

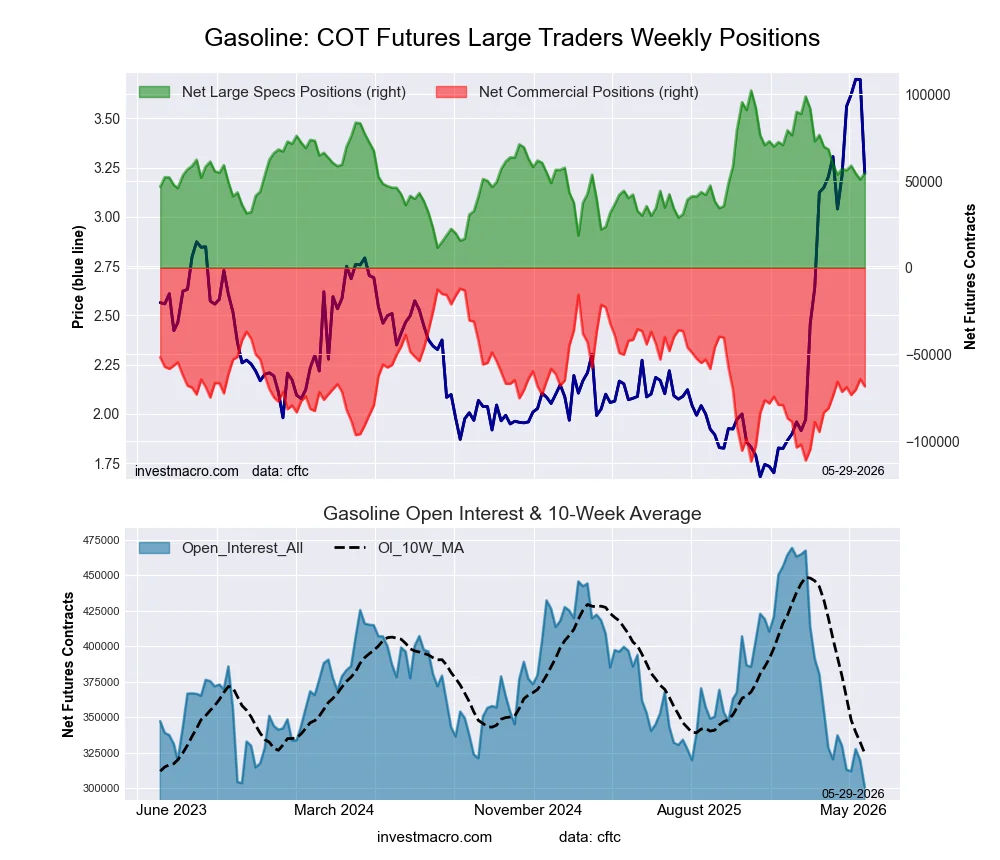
  • Gasoline Blendstock Futures large speculator standing this week reached a net position of 54,627 contracts in the data reported through Tuesday.
  • Weekly Speculator position lift of 3,698 contracts from the previous week which had a total of 50,929 net contracts.
  • This week’s current strength score (range over the past 3 years, measured from 0 to 100) shows the speculators are currently Bearish with a score of 47.5 percent.
  • The Commercials are Bearish with a score of 43.5 percent.
  • The Small Traders (not shown in chart) are Bullish-Extreme with a score of 80.4 percent.

Price Trend-Following Model: Uptrend

Our weekly trend-following model classifies the current market price position as: Uptrend.

Nasdaq Mini Futures StatisticsSPECULATORSCOMMERCIALSSMALL TRADERS
– Percent of Open Interest Longs:27.246.38.8
– Percent of Open Interest Shorts:9.069.04.2
– Net Position:54,627-68,41713,790
– Gross Longs:81,746139,27626,365
– Gross Shorts:27,119207,69312,575
– Long to Short Ratio:3.0 to 10.7 to 12.1 to 1
NET POSITION TREND:
– Strength Index Score (3 Year Range Pct):47.543.580.4
– Strength Index Reading (3 Year Range):BearishBearishBullish-Extreme
NET POSITION MOVEMENT INDEX:
– 6-Week Change in Strength Index:1.0-2.68.1


#2 Heating Oil NY-Harbor Futures Futures:
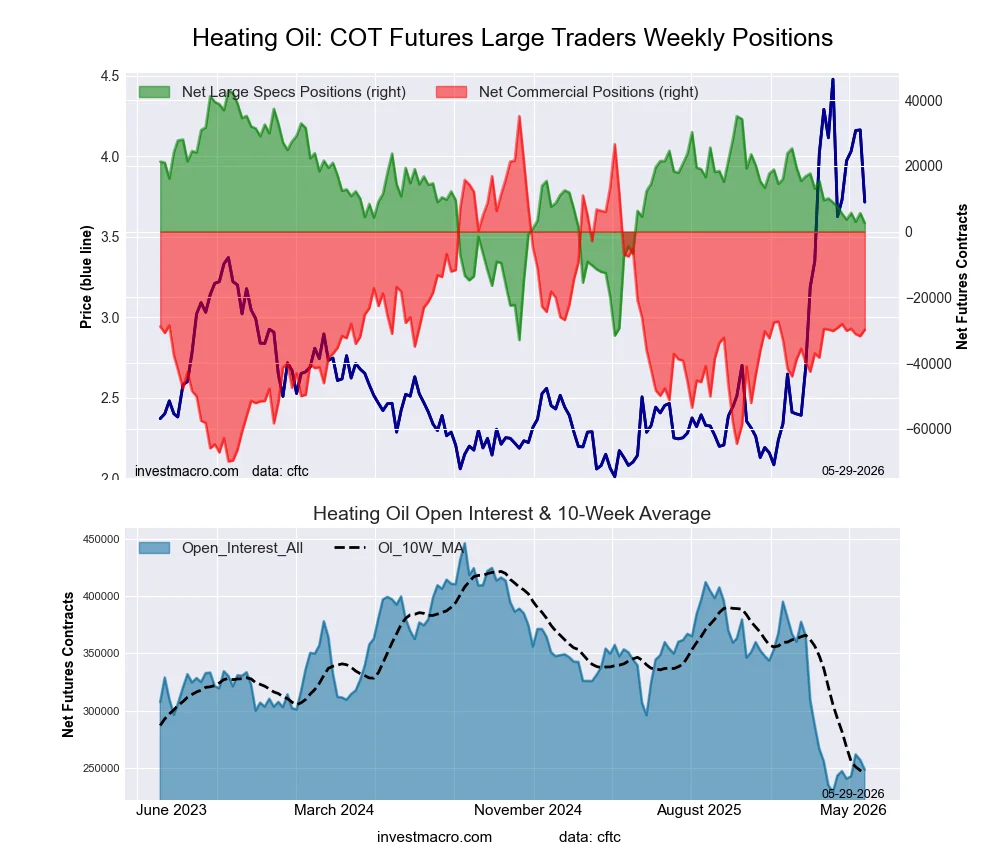
NY Harbor Heating Oil Energy Futures COT ChartPositioning Notes:

  • #2 Heating Oil NY-Harbor Futures large speculator standing this week reached a net position of 2,607 contracts in the data reported through Tuesday.
  • Weekly Speculator position fall of -3,036 contracts from the previous week which had a total of 5,643 net contracts.
  • This week’s current strength score (range over the past 3 years, measured from 0 to 100) shows the speculators are currently Bearish with a score of 46.9 percent.
  • The Commercials are Bearish with a score of 38.1 percent.
  • The Small Traders (not shown in chart) are Bullish-Extreme with a score of 92.6 percent.

Price Trend-Following Model: Uptrend

Our weekly trend-following model classifies the current market price position as: Uptrend.

Heating Oil Futures StatisticsSPECULATORSCOMMERCIALSSMALL TRADERS
– Percent of Open Interest Longs:15.544.121.3
– Percent of Open Interest Shorts:14.556.210.3
– Net Position:2,607-29,85227,245
– Gross Longs:38,565109,63952,929
– Gross Shorts:35,958139,49125,684
– Long to Short Ratio:1.1 to 10.8 to 12.1 to 1
NET POSITION TREND:
– Strength Index Score (3 Year Range Pct):46.938.192.6
– Strength Index Reading (3 Year Range):BearishBearishBullish-Extreme
NET POSITION MOVEMENT INDEX:
– 6-Week Change in Strength Index:-6.6-0.515.2


Bloomberg Commodity Index Futures Futures:
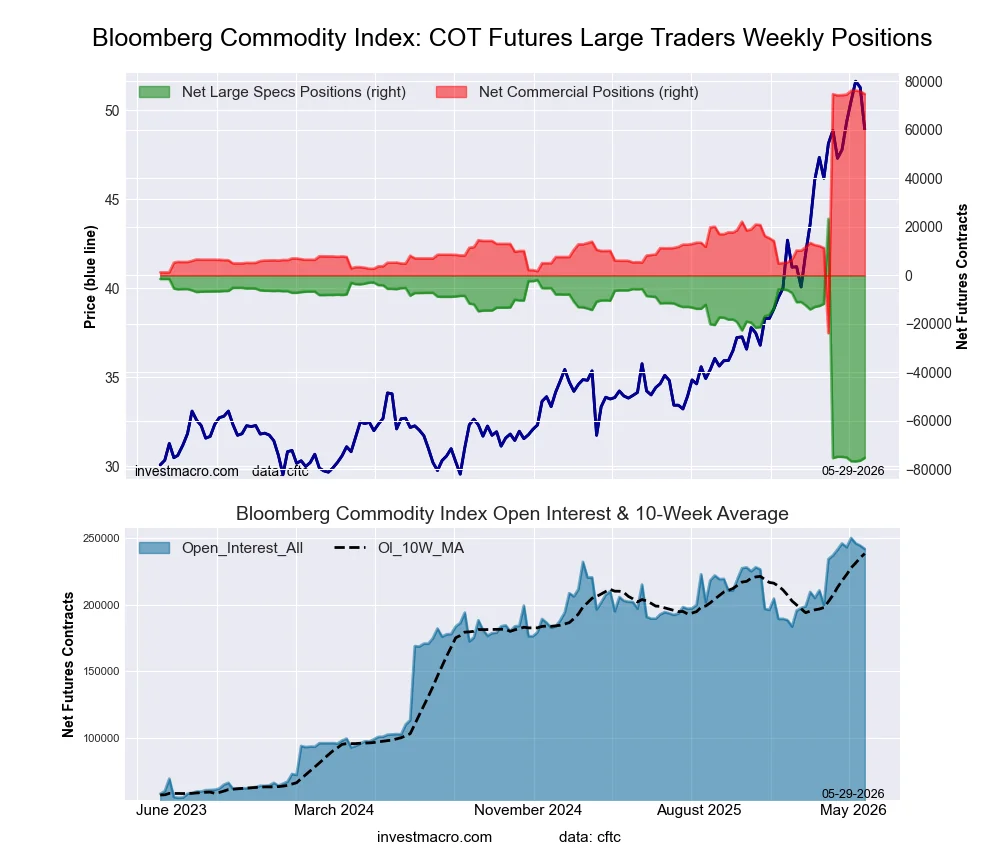
Bloomberg Commodity Index Futures COT ChartPositioning Notes:

  • Bloomberg Commodity Index Futures large speculator standing this week reached a net position of -75,263 contracts in the data reported through Tuesday.
  • Weekly Speculator position advance of 1,152 contracts from the previous week which had a total of -76,415 net contracts.
  • This week’s current strength score (range over the past 3 years, measured from 0 to 100) shows the speculators are currently Bearish-Extreme with a score of 1.5 percent.
  • The Commercials are Bullish-Extreme with a score of 98.6 percent.
  • The Small Traders (not shown in chart) are Bullish with a score of 62.8 percent.

Price Trend-Following Model: Uptrend

Our weekly trend-following model classifies the current market price position as: Uptrend.

Bloomberg Index Futures StatisticsSPECULATORSCOMMERCIALSSMALL TRADERS
– Percent of Open Interest Longs:43.455.80.2
– Percent of Open Interest Shorts:74.624.80.0
– Net Position:-75,26374,793470
– Gross Longs:104,841134,793509
– Gross Shorts:180,10460,00039
– Long to Short Ratio:0.6 to 12.2 to 113.1 to 1
NET POSITION TREND:
– Strength Index Score (3 Year Range Pct):1.598.662.8
– Strength Index Reading (3 Year Range):Bearish-ExtremeBullish-ExtremeBullish
NET POSITION MOVEMENT INDEX:
– 6-Week Change in Strength Index:-0.50.6-7.5


Article By InvestMacroReceive our weekly COT Reports by Email

*COT Report: The COT data, released weekly to the public each Friday, is updated through the most recent Tuesday (data is 3 days old) and shows a quick view of how large speculators or non-commercials (for-profit traders) were positioned in the futures markets.

The CFTC categorizes trader positions according to commercial hedgers (traders who use futures contracts for hedging as part of the business), non-commercials (large traders who speculate to realize trading profits) and nonreportable traders (usually small traders/speculators) as well as their open interest (contracts open in the market at time of reporting).See CFTC criteria here.

All information and opinions on this website and contained in this article are for general informational purposes only and do not constitute investment advice.

COT Soft Commodities Charts: Speculator Changes led by Coffee

By InvestMacro 

Speculators OI Softs
Here are the latest charts and statistics for the Commitment of Traders (COT) reports data published by the Commodities Futures Trading Commission (CFTC).

The latest COT data is updated through Tuesday May 26th and shows a quick view of how large traders (for-profit speculators and commercial entities) were positioned in the futures markets.

Weekly Speculator Changes led by Coffee

Speculators Nets Softs
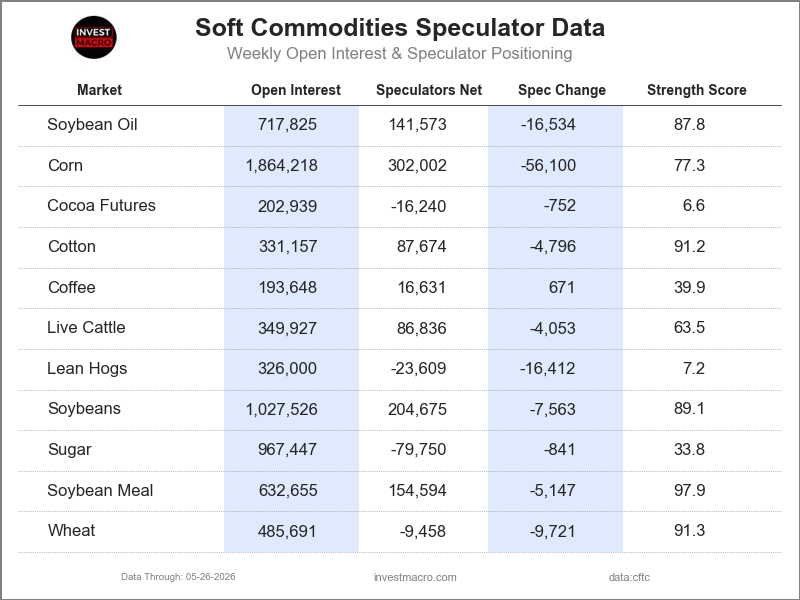
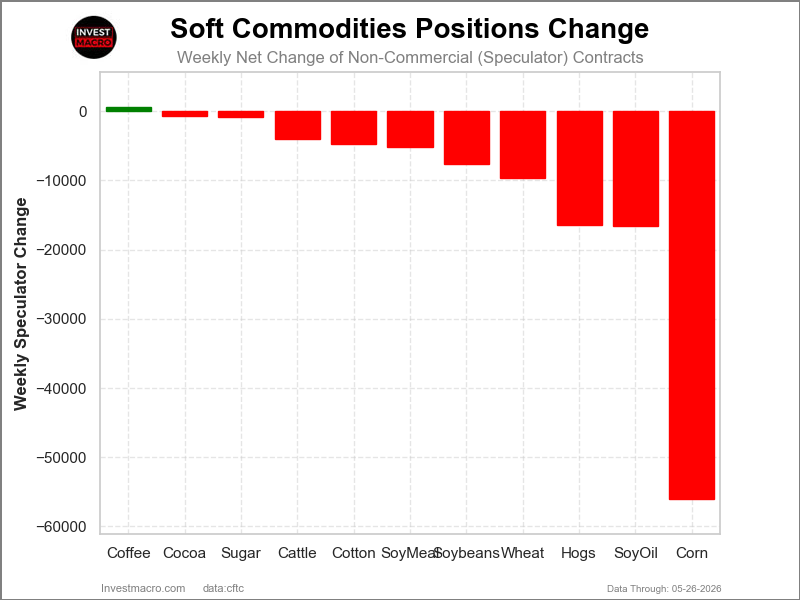
The COT soft commodities markets speculator bets were overall lower this week as just one out of the eleven softs markets we cover had higher positioning while the other ten markets had lower speculator contracts.

The only market with a gain for the softs markets this week was Coffee with a small increase by 671 contracts.

The markets with the declines in speculator bets this week were Corn (-56,100 contracts) with Soybean Oil (-16,534 contracts), Lean Hogs (-16,412 contracts), Wheat (-9,721 contracts) and Soybeans (-7,563 contracts), Soybean Meal (-5,147 contracts), Cotton (-4,796 contracts), Live Cattle (-4,053 contracts), Sugar (-841 contracts) and with Cocoa (-752 contracts) also registering lower bets on the week.

Soft Commodities price performance was led by Soybean Oil and Cocoa

The past five days price performances for the Soft Commodities markets were led by Soybean Oil, which rose by 3.83% for the week, and was followed up by Cocoa, which rose by 3.56% on the week. These were the only two markets that had higher five-day performances.

On the downside, Live Cattle was lower by -0.23%, followed by Lean Hogs which saw a dip by -0.52%. Next, Soybean Oil was lower by -0.63%, while Soybeans was close behind with a -0.81% decline.

Cotton saw lower levels by -1.64% on the week, while Coffee was down by over -2.5% with a -2.74% decrease. Corn dropped by more than -3% with a -3.56% shortfall, followed by Wheat, which decreased by -4.73% on the week.

Finally, Sugar was the biggest decliner on the week with a -5.57% drop.


Soft Commodities Data:

Speculators Table Softs
Legend: Weekly Speculators Change | Speculators Current Net Position | Speculators Strength Score compared to last 3-Years (0-100 range)


Strength Scores led by Soybean Meal & Wheat

Speculators Strength Softs
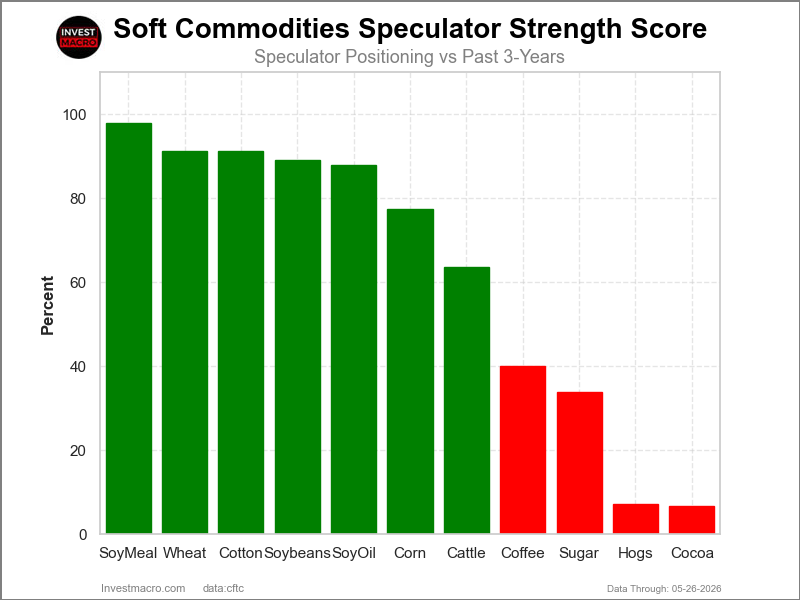
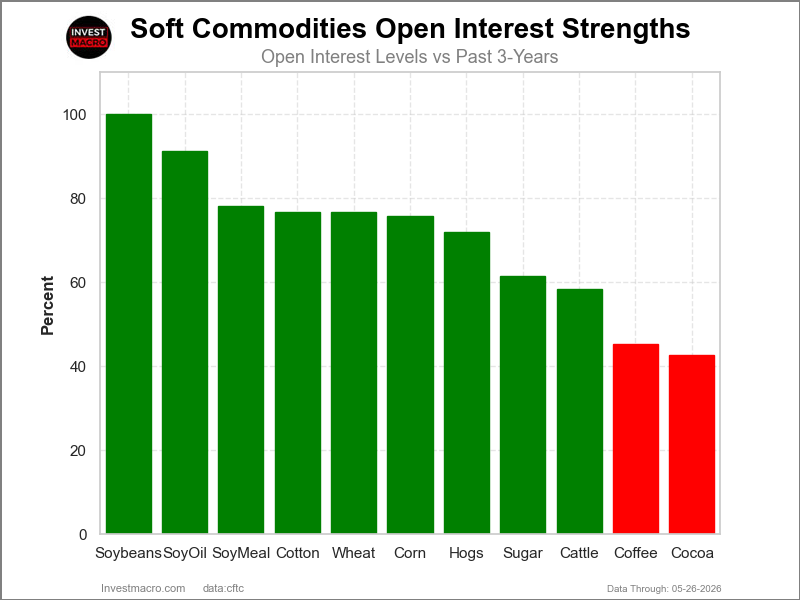
COT Strength Scores (a normalized measure of Speculator positions over a 3-Year range, from 0 to 100 where above 80 is Extreme-Bullish and below 20 is Extreme-Bearish) showed that Soybean Meal (98 percent) and Wheat (91 percent) lead the softs markets this week. Cotton (91 percent), Soybeans (89 percent) and Soybean Oil (88 percent) come in as the next highest in the weekly strength scores.

On the downside, Lean Hogs (7 percent) and Cocoa (7 percent) come in at the lowest strength levels currently and are in Extreme-Bearish territory (below 20 percent). The next lowest strength scores are the Sugar (34 percent) and the Coffee (40 percent).

Strength Statistics:
Corn (77.3 percent) vs Corn previous week (84.9 percent)
Sugar (33.8 percent) vs Sugar previous week (33.9 percent)
Coffee (39.9 percent) vs Coffee previous week (39.2 percent)
Soybeans (89.1 percent) vs Soybeans previous week (90.7 percent)
Soybean Oil (87.8 percent) vs Soybean Oil previous week (94.5 percent)
Soybean Meal (97.9 percent) vs Soybean Meal previous week (100.0 percent)
Live Cattle (63.5 percent) vs Live Cattle previous week (67.5 percent)
Lean Hogs (7.2 percent) vs Lean Hogs previous week (19.2 percent)
Cotton (91.2 percent) vs Cotton previous week (94.1 percent)
Cocoa (6.6 percent) vs Cocoa previous week (7.3 percent)
Wheat (91.3 percent) vs Wheat previous week (99.5 percent)


Sugar & Cotton top the 6-Week Strength Trends

Speculators Trend Softs
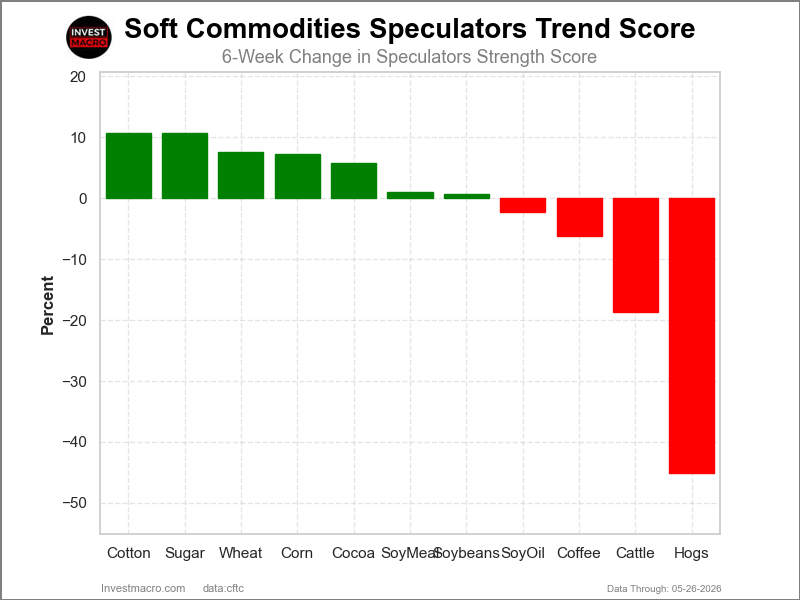
COT Strength Score Trends (or move index, calculates the 6-week changes in strength scores) showed that Sugar (11 percent) and Cotton (11 percent) lead the past six weeks trends for soft commodities. Corn (7 percent), Wheat (7 percent) and Cocoa (6 percent) are the next highest positive movers in the latest trends data.

Lean Hogs (-45 percent) leads the downside trend scores currently with Live Cattle (-19 percent), Coffee (-6 percent) and Soybean Oil (-2 percent) following next with lower trend scores.

Strength Trend Statistics:
Corn (7.2 percent) vs Corn previous week (9.2 percent)
Sugar (10.7 percent) vs Sugar previous week (-1.6 percent)
Coffee (-6.2 percent) vs Coffee previous week (-5.8 percent)
Soybeans (0.7 percent) vs Soybeans previous week (0.8 percent)
Soybean Oil (-2.2 percent) vs Soybean Oil previous week (4.0 percent)
Soybean Meal (1.0 percent) vs Soybean Meal previous week (17.4 percent)
Live Cattle (-18.6 percent) vs Live Cattle previous week (-13.0 percent)
Lean Hogs (-45.1 percent) vs Lean Hogs previous week (-39.2 percent)
Cotton (10.7 percent) vs Cotton previous week (18.5 percent)
Cocoa (5.7 percent) vs Cocoa previous week (5.9 percent)
Wheat (7.5 percent) vs Wheat previous week (15.9 percent)


Individual Soft Commodities Markets:

CORN Futures:

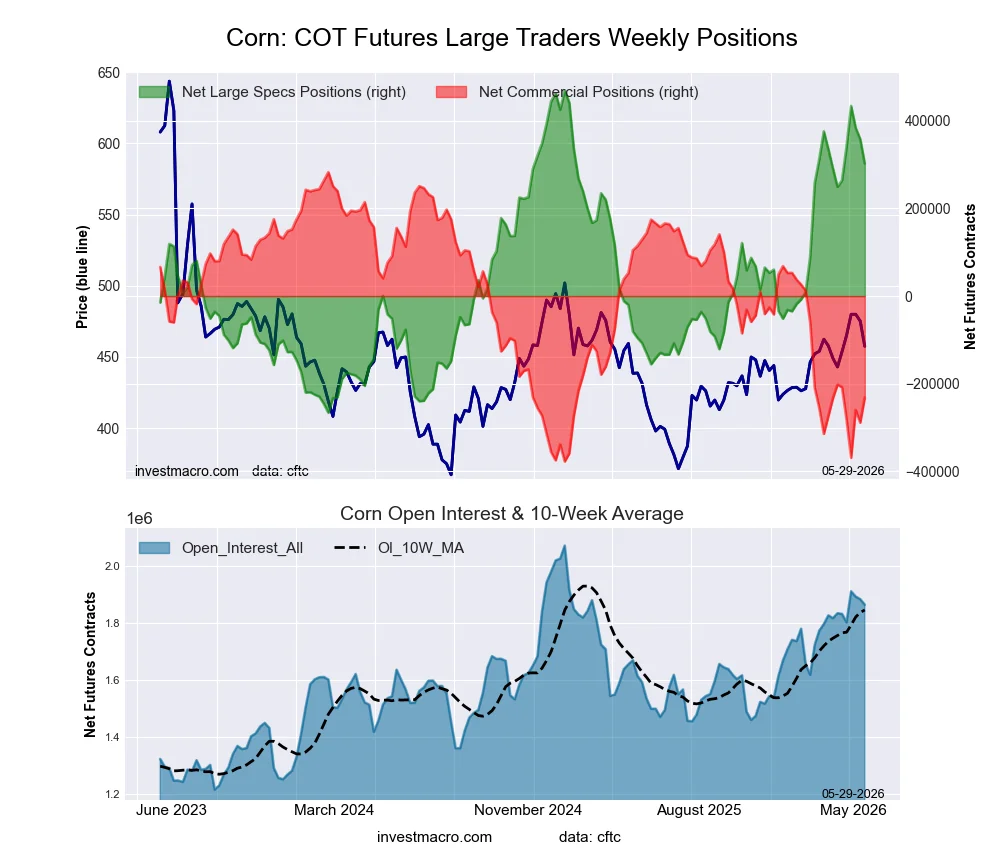
CORN Futures COT ChartPositioning Notes:

  • CORN large speculator standing this week reached a net position of 302,002 contracts in the data reported through Tuesday.
  • Weekly Speculator position decline of -56,100 contracts from the previous week which had a total of 358,102 net contracts.
  • This week’s current strength score (range over the past 3 years, measured from 0 to 100) shows the speculators are currently Bullish with a score of 77.3 percent.
  • The Commercials are Bearish with a score of 22.1 percent.
  • The Small Traders (not shown in chart) are Bearish with a score of 45.0 percent.

Price Trend-Following Model: Weak Uptrend

Our weekly trend-following model classifies the current market price position as: Weak Uptrend.

CORN Futures StatisticsSPECULATORSCOMMERCIALSSMALL TRADERS
– Percent of Open Interest Longs:28.041.57.2
– Percent of Open Interest Shorts:11.853.910.9
– Net Position:302,002-231,519-70,483
– Gross Longs:521,725773,197133,362
– Gross Shorts:219,7231,004,716203,845
– Long to Short Ratio:2.4 to 10.8 to 10.7 to 1
NET POSITION TREND:
– Strength Index Score (3 Year Range Pct):77.322.145.0
– Strength Index Reading (3 Year Range):BullishBearishBearish
NET POSITION MOVEMENT INDEX:
– 6-Week Change in Strength Index:7.2-4.4-20.2


SUGAR Futures:

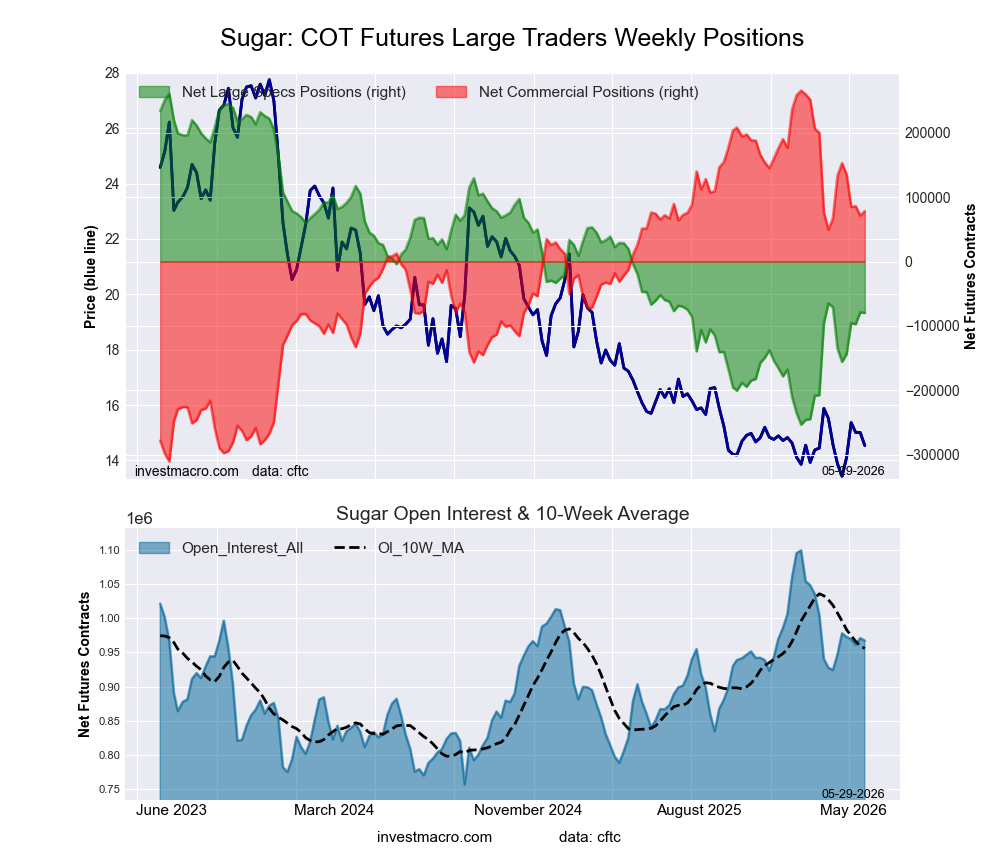
SUGAR Futures COT ChartPositioning Notes:

  • SUGAR large speculator standing this week reached a net position of -79,750 contracts in the data reported through Tuesday.
  • Weekly Speculator position decline of -841 contracts from the previous week which had a total of -78,909 net contracts.
  • This week’s current strength score (range over the past 3 years, measured from 0 to 100) shows the speculators are currently Bearish with a score of 33.8 percent.
  • The Commercials are Bullish with a score of 67.5 percent.
  • The Small Traders (not shown in chart) are Bearish with a score of 33.9 percent.

Price Trend-Following Model: Strong Downtrend

Our weekly trend-following model classifies the current market price position as: Strong Downtrend.

SUGAR Futures StatisticsSPECULATORSCOMMERCIALSSMALL TRADERS
– Percent of Open Interest Longs:24.750.78.3
– Percent of Open Interest Shorts:32.942.68.1
– Net Position:-79,75078,2921,458
– Gross Longs:238,727490,87779,967
– Gross Shorts:318,477412,58578,509
– Long to Short Ratio:0.7 to 11.2 to 11.0 to 1
NET POSITION TREND:
– Strength Index Score (3 Year Range Pct):33.867.533.9
– Strength Index Reading (3 Year Range):BearishBullishBearish
NET POSITION MOVEMENT INDEX:
– 6-Week Change in Strength Index:10.7-9.6-0.1


COFFEE Futures:

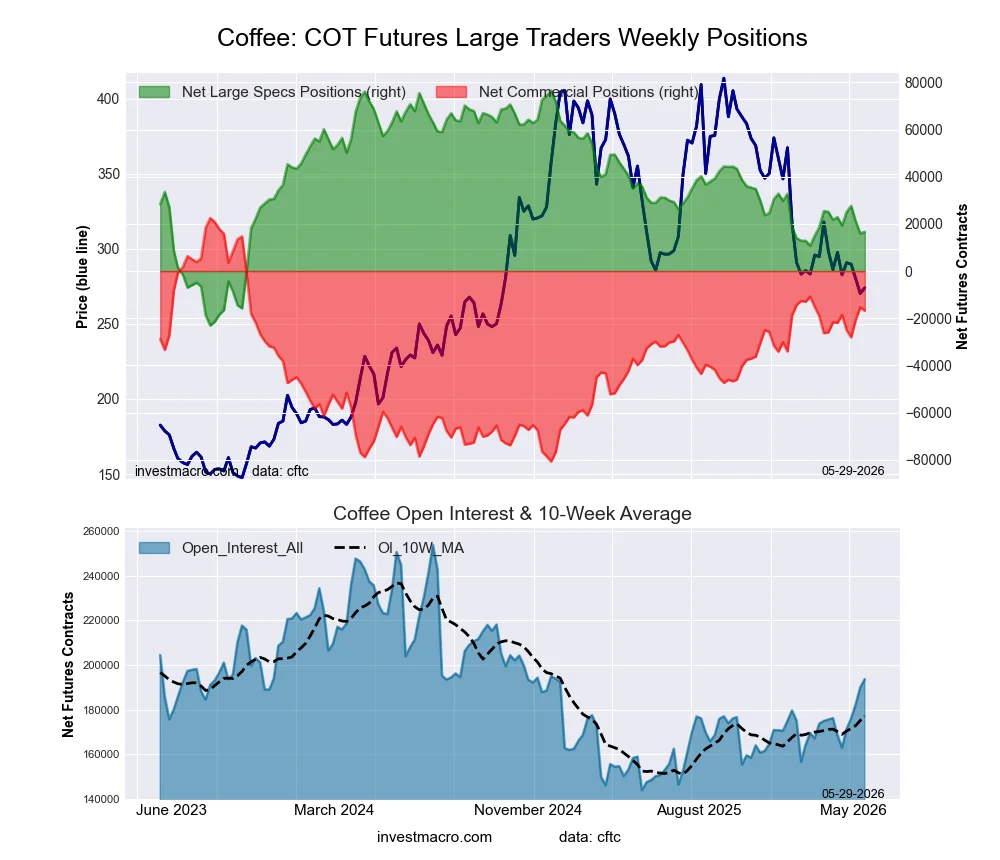
COFFEE Futures COT ChartPositioning Notes:

  • COFFEE large speculator standing this week reached a net position of 16,631 contracts in the data reported through Tuesday.
  • Weekly Speculator position gain of 671 contracts from the previous week which had a total of 15,960 net contracts.
  • This week’s current strength score (range over the past 3 years, measured from 0 to 100) shows the speculators are currently Bearish with a score of 39.9 percent.
  • The Commercials are Bullish with a score of 62.0 percent.
  • The Small Traders (not shown in chart) are Bearish-Extreme with a score of 17.7 percent.

Price Trend-Following Model: Downtrend

Our weekly trend-following model classifies the current market price position as: Downtrend.

COFFEE Futures StatisticsSPECULATORSCOMMERCIALSSMALL TRADERS
– Percent of Open Interest Longs:27.738.64.1
– Percent of Open Interest Shorts:19.147.24.1
– Net Position:16,631-16,766135
– Gross Longs:53,57474,6697,985
– Gross Shorts:36,94391,4357,850
– Long to Short Ratio:1.5 to 10.8 to 11.0 to 1
NET POSITION TREND:
– Strength Index Score (3 Year Range Pct):39.962.017.7
– Strength Index Reading (3 Year Range):BearishBullishBearish-Extreme
NET POSITION MOVEMENT INDEX:
– 6-Week Change in Strength Index:-6.25.017.7


SOYBEANS Futures:

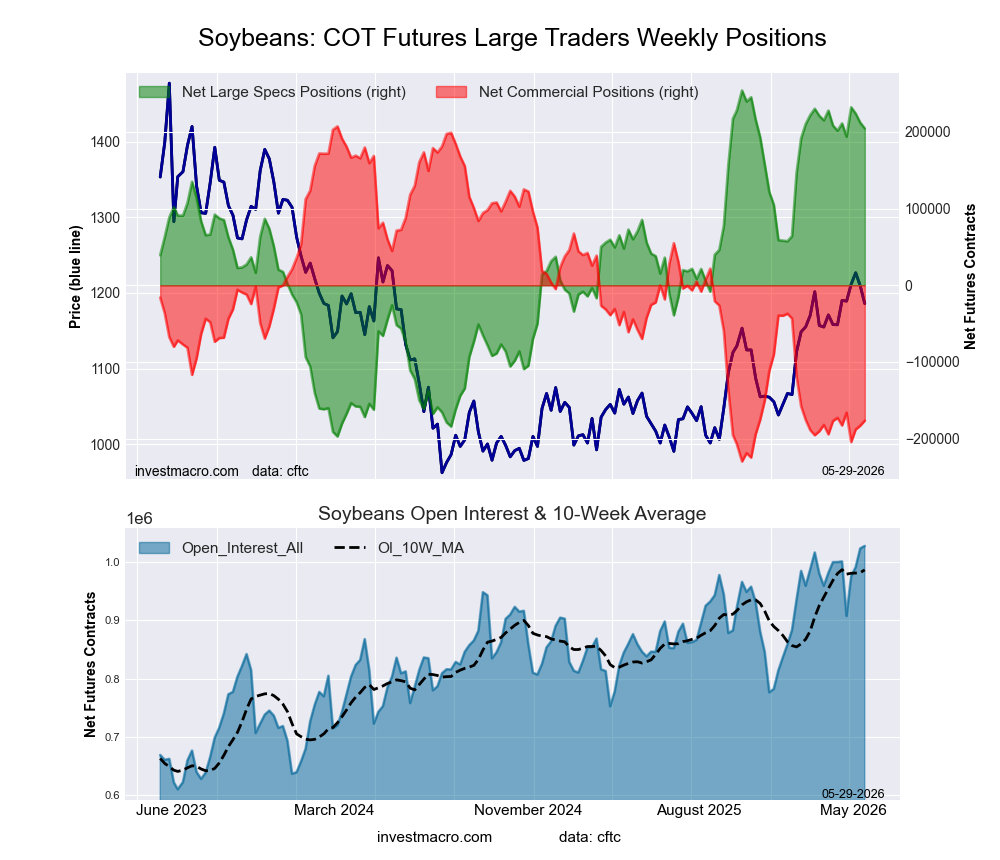
SOYBEANS Futures COT ChartPositioning Notes:

  • SOYBEANS large speculator standing this week reached a net position of 204,675 contracts in the data reported through Tuesday.
  • Weekly Speculator position decline of -7,563 contracts from the previous week which had a total of 212,238 net contracts.
  • This week’s current strength score (range over the past 3 years, measured from 0 to 100) shows the speculators are currently Bullish-Extreme with a score of 89.1 percent.
  • The Commercials are Bearish-Extreme with a score of 12.2 percent.
  • The Small Traders (not shown in chart) are Bearish with a score of 25.2 percent.

Price Trend-Following Model: Uptrend

Our weekly trend-following model classifies the current market price position as: Uptrend.

SOYBEANS Futures StatisticsSPECULATORSCOMMERCIALSSMALL TRADERS
– Percent of Open Interest Longs:27.847.25.0
– Percent of Open Interest Shorts:7.864.47.7
– Net Position:204,675-176,610-28,065
– Gross Longs:285,330484,90451,229
– Gross Shorts:80,655661,51479,294
– Long to Short Ratio:3.5 to 10.7 to 10.6 to 1
NET POSITION TREND:
– Strength Index Score (3 Year Range Pct):89.112.225.2
– Strength Index Reading (3 Year Range):Bullish-ExtremeBearish-ExtremeBearish
NET POSITION MOVEMENT INDEX:
– 6-Week Change in Strength Index:0.7-0.82.1


SOYBEAN OIL Futures:

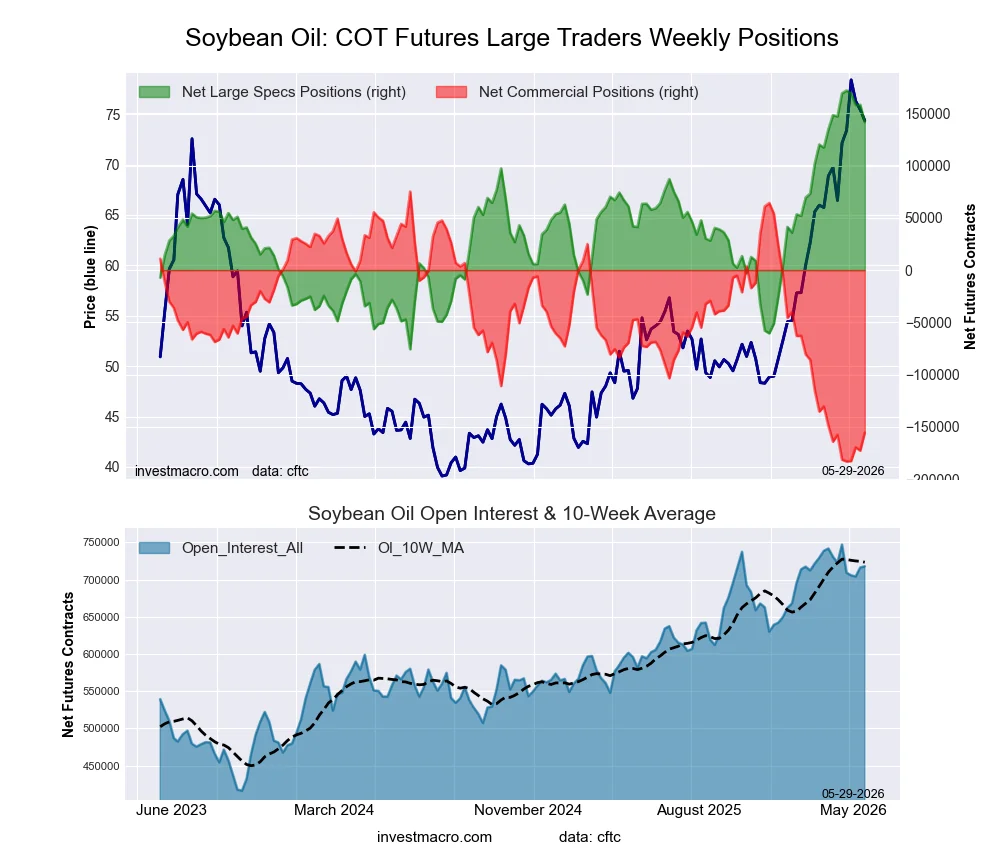
SOYBEAN OIL Futures COT ChartPositioning Notes:

  • SOYBEAN OIL large speculator standing this week reached a net position of 141,573 contracts in the data reported through Tuesday.
  • Weekly Speculator position decrease of -16,534 contracts from the previous week which had a total of 158,107 net contracts.
  • This week’s current strength score (range over the past 3 years, measured from 0 to 100) shows the speculators are currently Bullish-Extreme with a score of 87.8 percent.
  • The Commercials are Bearish-Extreme with a score of 10.7 percent.
  • The Small Traders (not shown in chart) are Bullish-Extreme with a score of 87.9 percent.

Price Trend-Following Model: Uptrend

Our weekly trend-following model classifies the current market price position as: Uptrend.

SOYBEAN OIL Futures StatisticsSPECULATORSCOMMERCIALSSMALL TRADERS
– Percent of Open Interest Longs:28.245.75.8
– Percent of Open Interest Shorts:8.567.43.9
– Net Position:141,573-155,54513,972
– Gross Longs:202,640328,33741,978
– Gross Shorts:61,067483,88228,006
– Long to Short Ratio:3.3 to 10.7 to 11.5 to 1
NET POSITION TREND:
– Strength Index Score (3 Year Range Pct):87.810.787.9
– Strength Index Reading (3 Year Range):Bullish-ExtremeBearish-ExtremeBullish-Extreme
NET POSITION MOVEMENT INDEX:
– 6-Week Change in Strength Index:-2.20.816.2


SOYBEAN MEAL Futures:

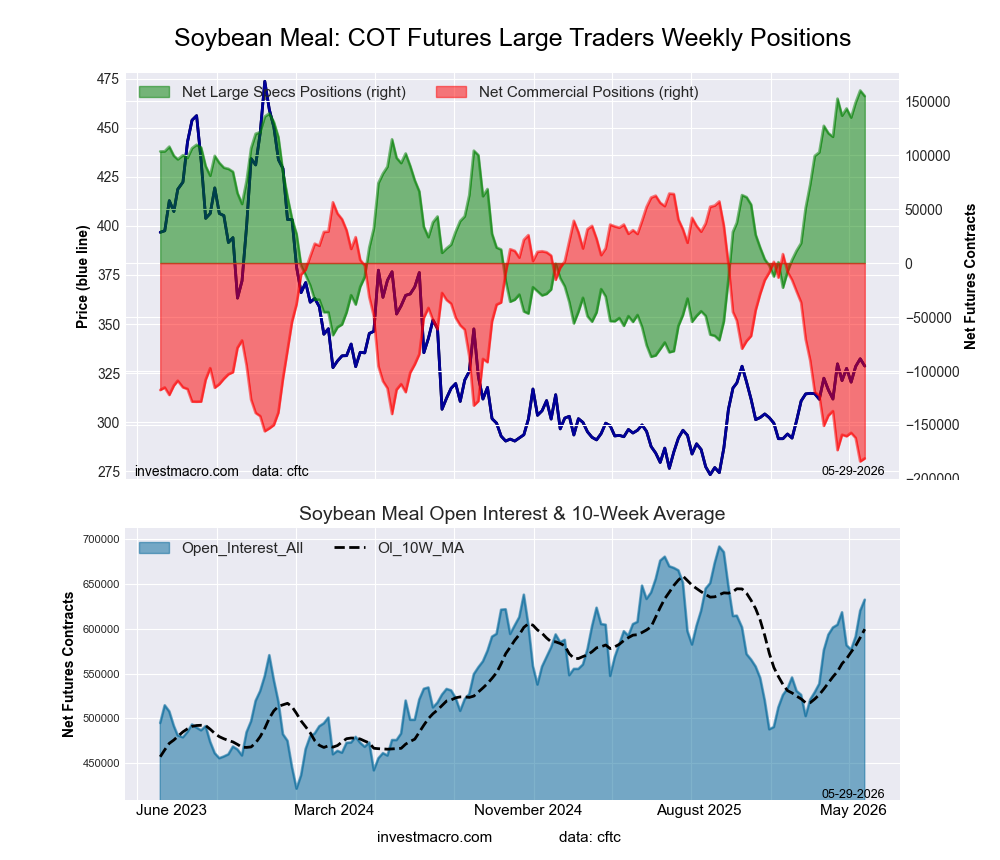
SOYBEAN MEAL Futures COT ChartPositioning Notes:

  • SOYBEAN MEAL large speculator standing this week reached a net position of 154,594 contracts in the data reported through Tuesday.
  • Weekly Speculator position decline of -5,147 contracts from the previous week which had a total of 159,741 net contracts.
  • This week’s current strength score (range over the past 3 years, measured from 0 to 100) shows the speculators are currently Bullish-Extreme with a score of 97.9 percent.
  • The Commercials are Bearish-Extreme with a score of 1.1 percent.
  • The Small Traders (not shown in chart) are Bullish-Extreme with a score of 90.8 percent.

Price Trend-Following Model: Uptrend

Our weekly trend-following model classifies the current market price position as: Uptrend.

SOYBEAN MEAL Futures StatisticsSPECULATORSCOMMERCIALSSMALL TRADERS
– Percent of Open Interest Longs:32.140.68.5
– Percent of Open Interest Shorts:7.669.24.4
– Net Position:154,594-180,95826,364
– Gross Longs:202,878256,64354,085
– Gross Shorts:48,284437,60127,721
– Long to Short Ratio:4.2 to 10.6 to 12.0 to 1
NET POSITION TREND:
– Strength Index Score (3 Year Range Pct):97.91.190.8
– Strength Index Reading (3 Year Range):Bullish-ExtremeBearish-ExtremeBullish-Extreme
NET POSITION MOVEMENT INDEX:
– 6-Week Change in Strength Index:1.0-3.130.6


LIVE CATTLE Futures:

LIVE CATTLE Futures COT ChartPositioning Notes:

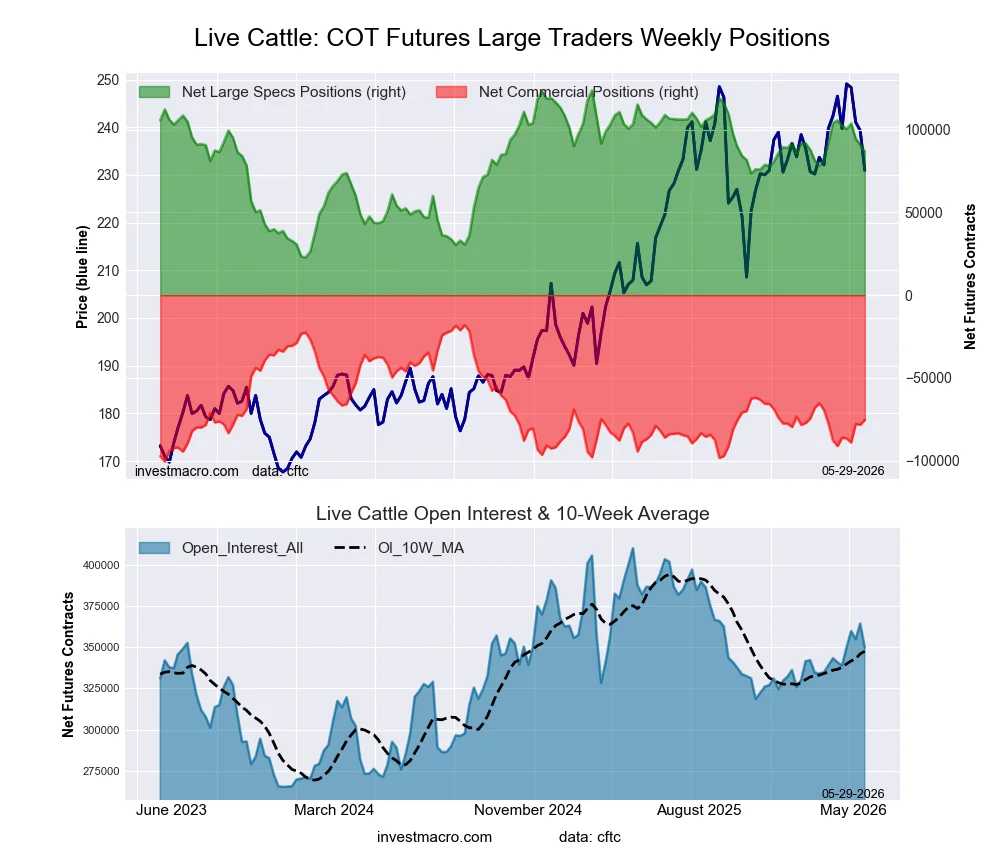
  • LIVE CATTLE large speculator standing this week reached a net position of 86,836 contracts in the data reported through Tuesday.
  • Weekly Speculator position fall of -4,053 contracts from the previous week which had a total of 90,889 net contracts.
  • This week’s current strength score (range over the past 3 years, measured from 0 to 100) shows the speculators are currently Bullish with a score of 63.5 percent.
  • The Commercials are Bearish with a score of 30.5 percent.
  • The Small Traders (not shown in chart) are Bullish with a score of 57.9 percent.

Price Trend-Following Model: Weak Uptrend

Our weekly trend-following model classifies the current market price position as: Weak Uptrend.

LIVE CATTLE Futures StatisticsSPECULATORSCOMMERCIALSSMALL TRADERS
– Percent of Open Interest Longs:43.430.38.1
– Percent of Open Interest Shorts:18.651.911.4
– Net Position:86,836-75,333-11,503
– Gross Longs:151,778106,19328,220
– Gross Shorts:64,942181,52639,723
– Long to Short Ratio:2.3 to 10.6 to 10.7 to 1
NET POSITION TREND:
– Strength Index Score (3 Year Range Pct):63.530.557.9
– Strength Index Reading (3 Year Range):BullishBearishBullish
NET POSITION MOVEMENT INDEX:
– 6-Week Change in Strength Index:-18.619.110.4


LEAN HOGS Futures:

LEAN HOGS Futures COT ChartPositioning Notes:

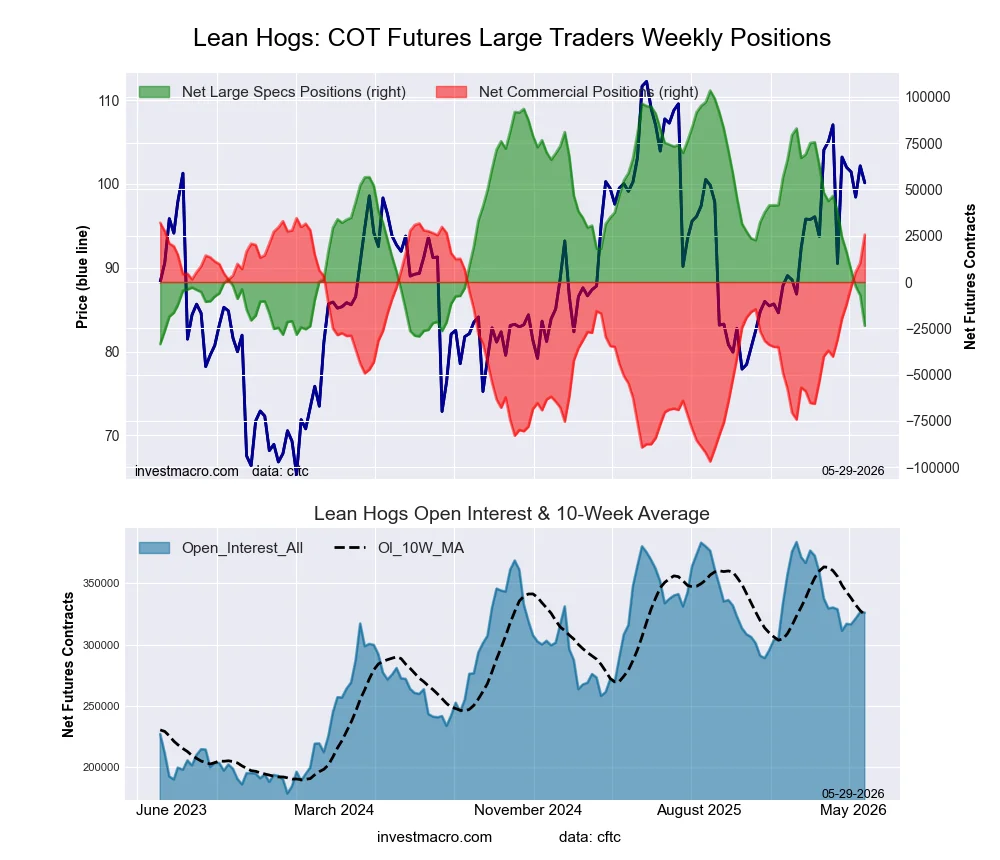
  • LEAN HOGS large speculator standing this week reached a net position of -23,609 contracts in the data reported through Tuesday.
  • Weekly Speculator position decrease of -16,412 contracts from the previous week which had a total of -7,197 net contracts.
  • This week’s current strength score (range over the past 3 years, measured from 0 to 100) shows the speculators are currently Bearish-Extreme with a score of 7.2 percent.
  • The Commercials are Bullish-Extreme with a score of 93.2 percent.
  • The Small Traders (not shown in chart) are Bullish with a score of 75.7 percent.

Price Trend-Following Model: Uptrend

Our weekly trend-following model classifies the current market price position as: Uptrend.

LEAN HOGS Futures StatisticsSPECULATORSCOMMERCIALSSMALL TRADERS
– Percent of Open Interest Longs:24.841.07.3
– Percent of Open Interest Shorts:32.033.27.9
– Net Position:-23,60925,553-1,944
– Gross Longs:80,782133,80223,805
– Gross Shorts:104,391108,24925,749
– Long to Short Ratio:0.8 to 11.2 to 10.9 to 1
NET POSITION TREND:
– Strength Index Score (3 Year Range Pct):7.293.275.7
– Strength Index Reading (3 Year Range):Bearish-ExtremeBullish-ExtremeBullish
NET POSITION MOVEMENT INDEX:
– 6-Week Change in Strength Index:-45.143.333.6


COTTON Futures:

COTTON Futures COT ChartPositioning Notes:

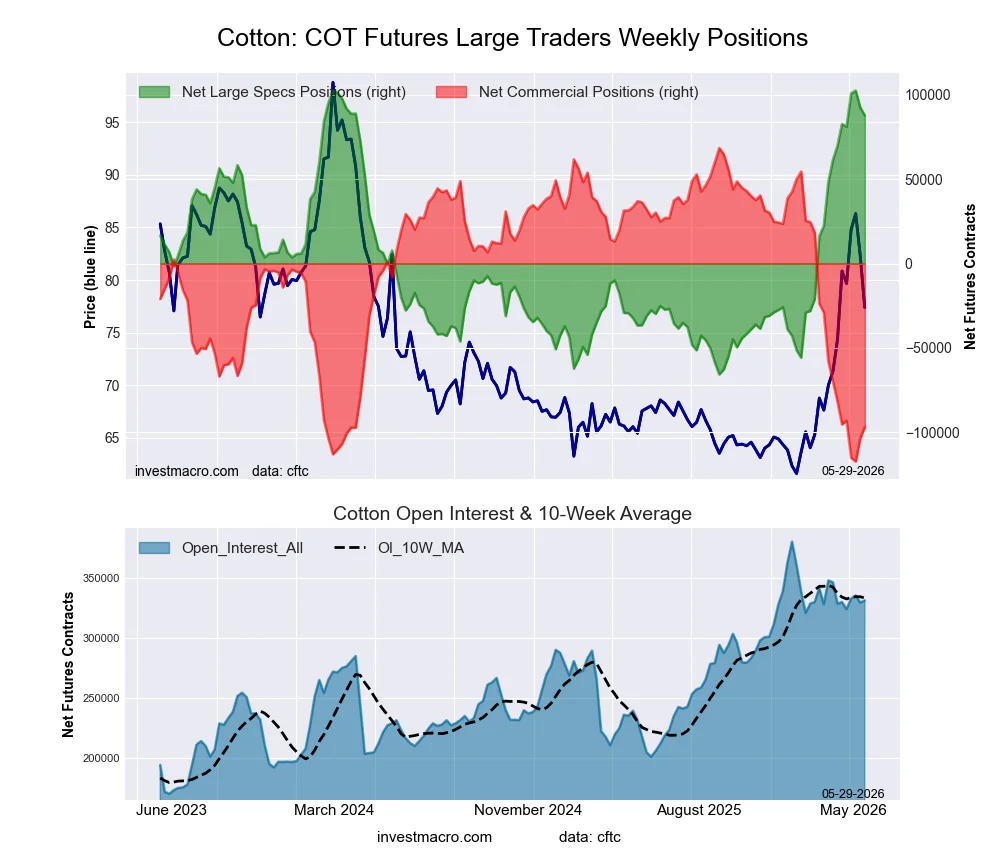
  • COTTON large speculator standing this week reached a net position of 87,674 contracts in the data reported through Tuesday.
  • Weekly Speculator position decline of -4,796 contracts from the previous week which had a total of 92,470 net contracts.
  • This week’s current strength score (range over the past 3 years, measured from 0 to 100) shows the speculators are currently Bullish-Extreme with a score of 91.2 percent.
  • The Commercials are Bearish-Extreme with a score of 11.0 percent.
  • The Small Traders (not shown in chart) are Bullish with a score of 68.1 percent.

Price Trend-Following Model: Strong Uptrend

Our weekly trend-following model classifies the current market price position as: Strong Uptrend.

COTTON Futures StatisticsSPECULATORSCOMMERCIALSSMALL TRADERS
– Percent of Open Interest Longs:41.034.75.6
– Percent of Open Interest Shorts:14.563.92.8
– Net Position:87,674-96,7519,077
– Gross Longs:135,684114,88418,439
– Gross Shorts:48,010211,6359,362
– Long to Short Ratio:2.8 to 10.5 to 12.0 to 1
NET POSITION TREND:
– Strength Index Score (3 Year Range Pct):91.211.068.1
– Strength Index Reading (3 Year Range):Bullish-ExtremeBearish-ExtremeBullish
NET POSITION MOVEMENT INDEX:
– 6-Week Change in Strength Index:10.7-8.1-16.1


COCOA Futures:

COCOA Futures COT ChartPositioning Notes:

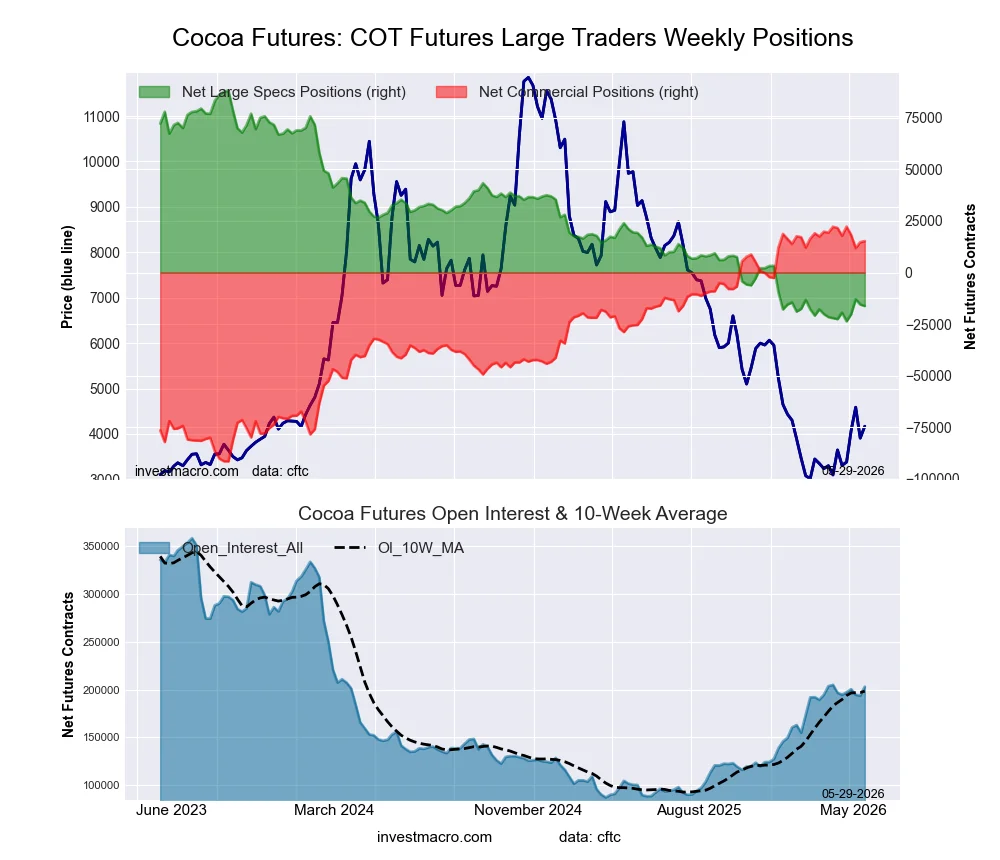
  • COCOA large speculator standing this week reached a net position of -16,240 contracts in the data reported through Tuesday.
  • Weekly Speculator position fall of -752 contracts from the previous week which had a total of -15,488 net contracts.
  • This week’s current strength score (range over the past 3 years, measured from 0 to 100) shows the speculators are currently Bearish-Extreme with a score of 6.6 percent.
  • The Commercials are Bullish-Extreme with a score of 93.9 percent.
  • The Small Traders (not shown in chart) are Bearish with a score of 36.3 percent.

Price Trend-Following Model: Weak Downtrend

Our weekly trend-following model classifies the current market price position as: Weak Downtrend.

COCOA Futures StatisticsSPECULATORSCOMMERCIALSSMALL TRADERS
– Percent of Open Interest Longs:20.352.05.2
– Percent of Open Interest Shorts:28.344.54.7
– Net Position:-16,24015,291949
– Gross Longs:41,108105,54410,501
– Gross Shorts:57,34890,2539,552
– Long to Short Ratio:0.7 to 11.2 to 11.1 to 1
NET POSITION TREND:
– Strength Index Score (3 Year Range Pct):6.693.936.3
– Strength Index Reading (3 Year Range):Bearish-ExtremeBullish-ExtremeBearish
NET POSITION MOVEMENT INDEX:
– 6-Week Change in Strength Index:5.7-5.6-0.3


WHEAT Futures:

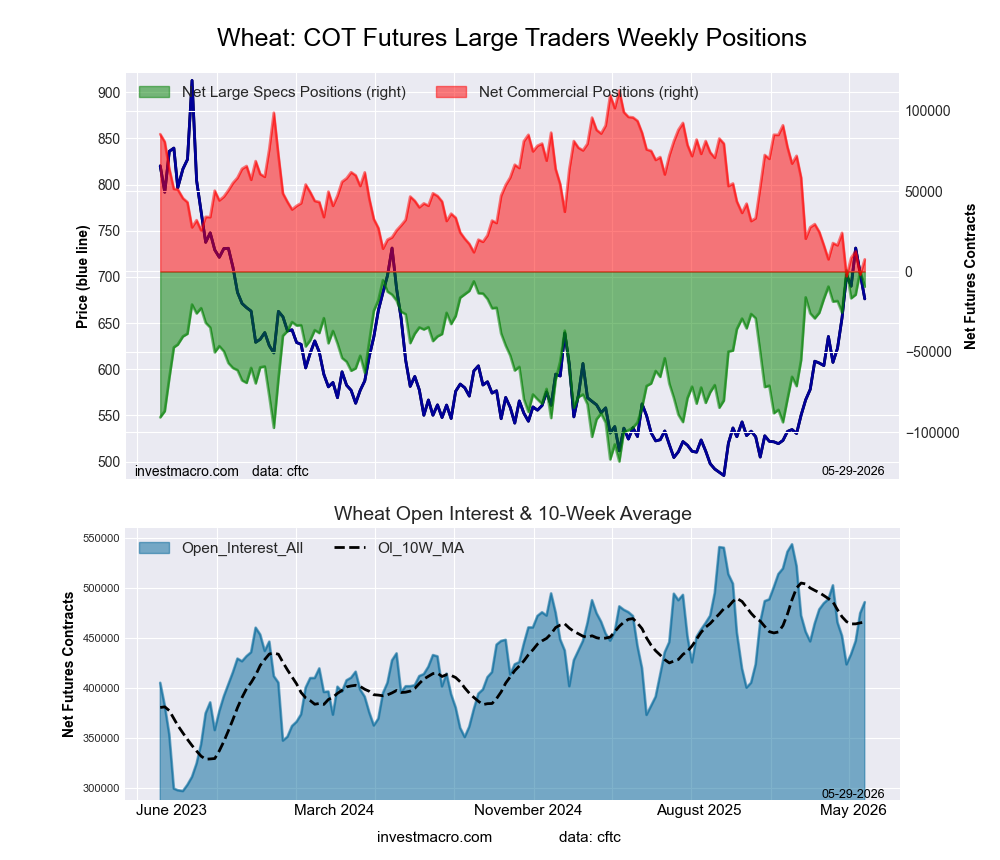
WHEAT Futures COT ChartPositioning Notes:

  • WHEAT large speculator standing this week reached a net position of -9,458 contracts in the data reported through Tuesday.
  • Weekly Speculator position fall of -9,721 contracts from the previous week which had a total of 263 net contracts.
  • This week’s current strength score (range over the past 3 years, measured from 0 to 100) shows the speculators are currently Bullish-Extreme with a score of 91.3 percent.
  • The Commercials are Bearish-Extreme with a score of 9.1 percent.
  • The Small Traders (not shown in chart) are Bullish with a score of 63.8 percent.

Price Trend-Following Model: Uptrend

Our weekly trend-following model classifies the current market price position as: Uptrend.

WHEAT Futures StatisticsSPECULATORSCOMMERCIALSSMALL TRADERS
– Percent of Open Interest Longs:29.733.47.7
– Percent of Open Interest Shorts:31.631.97.3
– Net Position:-9,4587,5301,928
– Gross Longs:144,186162,35737,621
– Gross Shorts:153,644154,82735,693
– Long to Short Ratio:0.9 to 11.0 to 11.1 to 1
NET POSITION TREND:
– Strength Index Score (3 Year Range Pct):91.39.163.8
– Strength Index Reading (3 Year Range):Bullish-ExtremeBearish-ExtremeBullish
NET POSITION MOVEMENT INDEX:
– 6-Week Change in Strength Index:7.5-7.6-1.1


Article By InvestMacroReceive our weekly COT Reports by Email

*COT Report: The COT data, released weekly to the public each Friday, is updated through the most recent Tuesday (data is 3 days old) and shows a quick view of how large speculators or non-commercials (for-profit traders) were positioned in the futures markets.

The CFTC categorizes trader positions according to commercial hedgers (traders who use futures contracts for hedging as part of the business), non-commercials (large traders who speculate to realize trading profits) and nonreportable traders (usually small traders/speculators) as well as their open interest (contracts open in the market at time of reporting).See CFTC criteria here.

All information and opinions on this website and contained in this article are for general informational purposes only and do not constitute investment advice.
It’s not just high gas prices – inflation is now spreading through the US economy

By D. Brian Blank, Mississippi State University and Brandy Hadley, Appalachian State University 

Americans don’t need a press release to know that inflation is rising. Gasoline is above $4 per gallon amid the ongoing conflict in the Middle East and closure of the Strait of Hormuz, and the release of key price data on May 28, 2026, underscores why policymakers are worried these pressures could spread into the broader economy.

The report offered a mixed but still uncomfortable picture. The month-to-month rise was softer than expected, but the change year over year still points to concern: a 3.8% jump from a year earlier, the fastest pace since 2021, and a less volatile index that excludes food and energy up 3.3%.

This increase suggests inflation isn’t limited to gasoline. Housing, utilities and recreational spending are also keeping underlying inflation elevated, even as other data shows a slowing economy and weaker income growth.

As finance and applied investments professors who study how businesses make decisions amid uncertainty, we have been watching this tension build. In our 2026 economic outlook, we warned that recession fears could persist alongside rising prices. Fresh inflation data now suggests the challenge may be deeper and longer lasting than many expected.

Are all prices rising?

The fresh inflation data comes from the Personal Consumption Expenditures Price Index, or headline PCE, which is maintained and released by the Commerce Department’s Bureau of Economic Analysis. Headline PCE had already been getting hotter, rising to 3.5% year on year in March 2026, up from 2.8% in February. But an even more important metric for the Federal Reserve is core PCE, which excludes the more volatile categories of food and energy. Core PCE matters because it gives policymakers a clearer read on underlying inflation pressures and is generally considered a better predictor of where inflation is headed, the Fed’s chief concern. That has been rising this year as well.

The key question isn’t simply whether gas prices are rising, but whether those higher energy costs are spreading into the rest of the economy.

That’s why energy costs are both a measure of current inflation and a signal of future rising prices. They show up directly in inflation data like PCE but also affect shipping, airline fares, food production, utilities, packaging, business profit margins and consumer psychology. A one-time bump doesn’t necessarily create lasting inflation. But the risk increases when those higher costs pass through to the broader economy and people begin to expect inflation to remain high. For example, if workers believe costs will be higher in general, they might demand higher wages, which in turn can make inflation even hotter.

There’s already some evidence that the inflationary effect of energy prices is spreading. April’s Consumer Price Index report – another inflation gauge – showed a 3.8% leap, the fastest in three years, with energy prices up 18% and spending on airlines up over 20%, while grocery prices posted their largest monthly gain since 2022. Tariff-sensitive categories like apparel and household furnishings are also still climbing.

And it’s these costs, not core PCE, that households experience every day. Americans buy gas, pay utility bills, purchase groceries and start changing their spending behavior in response to these pressures. That’s why the Fed is watching to see how energy prices impact other measures of inflation.

What’s the Fed to do?

Kevin Warsh has just been sworn in as the new chair of the central bank, which means the next meeting of the Fed’s policymaking committee on June 16-17, 2026, will be his first in that role. He’ll face an unusual amount of disagreement among committee members as well as scrutiny over his own positions given his rhetorical shifts on inflation and Fed policy since he was nominated by President Donald Trump. The president has pressured the Fed to cut rates, while Warsh has recently downplayed the significance and accuracy of the PCE gauge.

The Fed’s tool for responding to inflation is to raise interest rates, but it’s not always straightforward. The Fed doesn’t just hike interest rates as a direct response to inflation. If the increase in energy prices looks temporary and inflation expectations remain “anchored” – that is, stable among consumers – the Fed may hold steady on rates or even cut them as consumers continue to dial back spending. But it may have to keep rates higher for longer or even consider additional tightening if those conditions don’t hold and inflation continues rising.

This creates a problem for the Fed’s “dual mandate” to control inflation while supporting economic growth. Higher gas prices are inflationary, but they also reduce households’ spending power and dampen growth. In that sense, higher energy prices can act like a tax on consumers: People spend more to drive, heat and cool their homes, and receive goods, leaving less income for restaurants, travel, retail and other purchases.

That’s why the Fed doesn’t have a simple answer. If it hikes interest rates to combat inflation, it still won’t resolve geopolitical conflict and increase global oil supplies. But it can reduce demand and slow inflation.

Indeed, according to notes of the most recent Fed policy committee meeting in April, many officials are increasingly concerned that persistent inflation could require additional rate hikes. While the Fed decided to hold rates steady at 3.50% to 3.75% at the time, committee members noted that inflation remains elevated, “in part reflecting the recent increase in global energy prices.”

Another factor: Long-term yields on Treasury bonds, which reflect what investors demand for buying U.S. debt, have reached their highest levels since 2007. That could be a sign that markets expect higher rates or more uncertainty – and it matters because yields influence mortgage rates, business borrowing costs and the value of retirement portfolios, to name a few examples. In other words, inflation concerns don’t have to wait for another Fed rate hike to affect the economy. If markets believe inflation will stay elevated, borrowing costs can rise on their own.

What to watch at the Fed’s June meeting

The leadership transition at the Fed makes this moment particularly noteworthy. Warsh’s first major challenge may not be whether to raise or cut rates immediately, but how to explain what the Fed is watching. Will he emphasize headline inflation, core inflation, other inflation measures, consumer expectations, financial conditions or signs of slowing demand? This is especially important, as some of these gauges are closer to 2% and rising more slowly while others rise more rapidly away from the Fed’s 2% target.

Artificial intelligence adds another complication. AI-related investment may be helping hold up growth even as households feel pressured by higher gas and grocery prices. That creates a divided economy: Consumers struggle with higher prices and borrowing costs, but AI-related investment supports markets, infrastructure spending and business optimism. For his part, Warsh argues that AI also will help drive down prices, allowing the Fed to cut rates sooner.

All of this makes the inflation outlook hard to read. Weakening consumer demand and wage growth argues for caution, while rising inflation expectations and businesses passing on higher costs to consumers and the broader economy argue for higher rates.

Ultimately, the key question for the Fed is not simply whether inflation is rising, but whether energy prices are reopening the inflation fight at the exact moment it’s trying to prove that price stability is still within reach. Warsh’s first months as chair will test whether the Fed can maintain inflation credibility while avoiding unnecessary damage to an already pressured consumer economy.The Conversation

About the Author:

D. Brian Blank, Associate Professor of Finance, Mississippi State University and Brandy Hadley, Associate Professor of Finance and Distinguished Scholar of Applied Investments, Appalachian State University

This article is republished from The Conversation under a Creative Commons license. Read the original article.

Scientists used a method from ecology to identify whether icy moons could hold conditions for life

By Gideon Yoffe, Weizmann Institute of Science 

New observatories and spacecraft missions are probing environments in our solar system that could potentially host life but have long remained hidden. Icy moons like Saturn’s Enceladus and Jupiter’s Europa likely contain oceans beneath frozen outer shells. But a layer of ice prohibits space probes from sampling them directly.

Exploring these icy moons is almost forensic: Their surfaces keep a partial record of inaccessible interiors. Scientists need tools that can help them figure out whether evidence of life lies beneath without observing it directly.

I’m a planetary scientist, and my colleagues and I have developed a tool that could help evaluate whether an environment has the right conditions for life, based on patterns in the types of molecules found in a sample.

Future missions may sample environments that could host life, such as Saturn’s moon Enceladus.
Jason Major, Cassini spacecraft/Flickr, CC BY-NC-SA

Looking for life’s fingerprints

The search for life often begins with organic molecules: the carbon-based molecules from which life on Earth is built. Two especially important families of molecules are amino acids, which cells use to build proteins, and fatty acids, which help form cell membranes.

Yet these molecules are not unique to life – they can also form through nonbiological chemistry. Scientists have previously detected them in asteroids and meteorites.

Because detecting amino acids or fatty acids in a planetary environment alone will not tell researchers whether they are produced by life or by nonlife, they must seek additional evidence.

One clue is molecular handedness, or “chirality.” Certain amino acids occur in two mirror-image forms. Nonbiological processes often produce both forms in similar amounts, whereas life on Earth uses almost exclusively the left-handed forms. A strong excess of one form can point toward biology.

Another clue is found in the balance between the heavier and lighter forms of the same element within molecules. Usually, life prefers to use the lighter form.

Both of these clues are powerful indicators but difficult to measure in space. They require sensitive instruments, clean samples and often more material than a spacecraft can obtain.

That said, current and planned missions may provide a more limited – but still valuable – kind of measurement: a list of molecules and the proportions in which they are found. Our study demonstrates how researchers can use this simpler information to learn more about the molecules’ chemical origin.

Investigating diversity

Life does not merely produce certain molecules – it produces them in arrangements of unique patterns. Living systems invest energy into making molecules that serve specific functions, even when those molecules are complex and harder to form. Proteins, for example, require a broad set of amino acids, including relatively complex ones. Nonbiological chemistry can also make amino acids, but typically it makes simpler ones.

A chemical diagram showing the general structure of an amino acid.
Your body requires many different amino acids to live. But nonliving chemical processes can also produce amino acids, so their presence in a sample doesn’t definitively prove life.

In our study, we investigated whether these molecules leave a statistical pattern that could serve as a biosignature: a measurable clue that may point toward life.

To quantify this idea, we used a method from ecology called diversity theory. Ecologists do not only ask how many species exist in a particular ecosystem, but also how those species are distributed: whether the community is dominated by a few very common species or by many species occurring in comparable numbers. The point of diversity theory is to both compile a list of species and capture the prevalence of each.

We applied the same logic to molecules. Within a family, such as amino acids, we treated each molecule like a species in an ecological community and measured its abundance. We wanted to know: Is a given mixture of molecules distributed evenly across different types or dominated by only a few of them? And could that pattern reflect the process that produced those molecules, whether biological or nonbiological?

Testing the framework

To test this idea, we compiled a deliberately broad dataset that included amino acids from a variety of sources: meteorites, samples from asteroid missions, laboratory simulations of nonbiological chemistry, modern organisms, sediments, ancient fossils and samples from various environments on Earth. We later did the same with fatty acids.

For amino acids, we found a clear distinction. The biological samples tended to contain many complex amino acids, in proportions similar to those of simpler ones. Nonbiological samples were usually sparser – that is, more strongly dominated by simple molecules.

This result makes sense. If biology can overcome the chemical bottlenecks necessary to create more complex molecules, you’d expect to see more of those molecules. On the other hand, nonbiological chemistry is more limited and dominated by molecules that form randomly. Complex molecules are far less likely to form under nonbiological conditions.

Fatty acids showed an opposite but equally informative pattern. Chains of fatty acids make up the outer membranes of living cells. We found that in biological samples, the fatty acid chains were all a similar length. In contrast, nonbiological samples had a wider distribution of chain lengths.

A chemical structure diagram of a fatty acid
Fatty acids are chains of molecules made up of carbon and hydrogen, with oxygen at the end.
Innerstream/Wikimedia Commons

Even though, unlike the amino acid results, the nonbiological samples showed greater fatty acid diversity, this chain length finding supported the main idea behind our research: Life shapes molecular mixtures according to function.

Taken together, our results suggest that molecular diversity can serve as a new kind of biosignature. It cannot prove the presence of life on its own, and it should be interpreted alongside other measurements. But it offers a practical way to use the kind of data spacecraft are most likely to obtain: the proportions of molecules.

Searching for life in the solar system and beyond

Future spacecraft are unlikely to find pristine biological material, even if it exists. More likely, they will encounter the chemical traces of molecules, altered by the harsh conditions on planetary surfaces.

Next, we wanted to know how long the diversity signal could survive in the type of harsh environment where scientists may look, such as the surface of Europa. Its surface is continually being bombarded by energetic particles trapped in Jupiter’s magnetic field, which can break different organic molecules apart at different rates.

An illustration of a spacecraft flying over an ice-covered moon.
NASA’s Europa Clipper mission will fly around the moon of Jupiter and take measurements to investigate whether it could harbor life.
NASA/JPL-Caltech

We modeled how these molecules would degrade under such conditions and found that the diversity signal could remain recognizable for thousands of years when the molecules are buried under a few centimeters of ice. The signal is not indestructible, but it does not require an exceptionally fresh sample.

Our results suggest that in some cases the pattern left by life may still be recognizable even after the individual molecules have begun to break down.

The take-home message from our study is that life organizes chemistry in ways that could persist even after those ingredients are altered. Living systems arrange molecules according to biological needs, while nonbiological chemistry usually follows what is easiest to produce. If this organization can survive in planetary materials, future spacecraft may search not only for the building blocks of life but for the deeper statistical pattern that life leaves behind.The Conversation

About the Author:

Gideon Yoffe, Postdoctoral Fellow in Planetary Science, Weizmann Institute of Science

This article is republished from The Conversation under a Creative Commons license. Read the original article.

The US and Iran have reached an agreement to extend the ceasefire and gradually unblock the Strait of Hormuz

By JustMarkets 

On Thursday, US stock indices closed at new all‑time highs. By the end of the day, the Dow Jones (US30) rose by 0.05%. The S&P 500 (US500) gained 0.58%. The Tech‑heavy NASDAQ (US100) closed higher by 0.91%. The main drivers of the rally were the breakthrough developments in the Middle East: negotiators from the US and Iran finally reached an agreement to extend the ceasefire and gradually unblock oil and LNG shipments from the Persian Gulf, which ultimately deflated speculative pressure in the commodity market and stabilized government bond yields.

In Europe, by the end of the day, Germany’s DAX (DE40) fell by 0.34%, France’s CAC 40 (FR40) closed up 0.21%, Spain’s IBEX 35 (ES35) closed lower 0.19%, and the UK’s FTSE 100 (UK100) ended in the red at 0.64%. The published minutes of the ECB’s April meeting confirmed a deep split within the regulator and strengthened the market’s “hawkish” expectations. It turned out that keeping rates unchanged in April was a compromise and “highly contentious” decision: some officials were ready to vote for immediate tightening. The minutes also show that even the two rounds of monetary tightening planned for this year may not return inflation to the 2% target. Against this backdrop, markets have become more confident that on June 11, the ECB will almost certainly raise key rates by 25 basis points, and are pricing in at least one more similar move before year‑end.

WTI crude oil prices showed high volatility, fluctuating around $89 per barrel. Early in the session, prices jumped by about 2% due to another escalation: the US destroyed several attack drones near the Strait of Hormuz, Kuwait intercepted a missile fired in its direction, and Iran’s Revolutionary Guard threatened a harsh response to attempts by foreign vessels to enter the Persian Gulf. However, prices later erased all gains after an Axios report that the US and Iran had agreed on a preliminary 60‑day memorandum. The document, which still needs approval from President Donald Trump, guarantees unimpeded navigation and obliges Iran to fully clear mines from the Strait of Hormuz within 30 days, sharply reducing the geopolitical risk premium.

The US natural gas prices (XNG) jumped more than 4%, holding above $3.2 per MMBtu and approaching February highs. A powerful trigger for buyers was fresh EIA data. For the week ending May 22, US utilities injected 92 billion cubic feet of gas into storage, noticeably below the expected 95-96 bcf and far below last year’s 104 bcf. As a result, total inventories reached 2.483 trillion cubic feet. Although this level still exceeds last year’s by 0.9% and the five‑year seasonal average by 6.2%, the market surplus continues to shrink.

In Asia on Tuesday, Japan’s Nikkei 225 (JP225) rose by 0.88%, China’s FTSE China A50 closed higher by 0.42%, Hong Kong’s Hang Seng (HK50) declined by 0.73%, while Australia’s ASX 200 (AU200) rose by 0.11%.

The offshore yuan stabilized around 6.76 per dollar, holding near its strongest levels since February 2023. The main support factor for China’s currency was the news of a diplomatic breakthrough in the Middle East. An additional powerful driver for the yuan is the global artificial intelligence boom, which has sharply increased demand for Chinese tech exports. This inflow of foreign currency has significantly eased Beijing’s concerns about excessive yuan appreciation, allowing it to finish May with a second consecutive month of gains despite regular attempts by the People’s Bank of China to restrain the momentum through lower‑than‑expected daily fixings.

The Australian dollar stabilized around 0.71 USD, ending May with a moderate decline of about 0.5%. The main pressure on the “aussie” came from a sharp drop in investor expectations for further monetary tightening by the Reserve Bank of Australia. April inflation came in below predictions, consumer spending weakened, and the labor market showed the first signs of stabilization. As a result, traders reduced the probability of a rate hike at the June meeting to just 5%, although they still estimate the chances of a final move to 4.6% in Q4 2026 at around 70%.

The Governor of the Reserve Bank of New Zealand, Anna Breman, reaffirmed the regulator’s “hawkish” stance in her speech, stating that the Official Cash Rate (OCR) may rise faster and more aggressively than previously expected. Breman emphasized that due to the escalation of the Middle East conflict, New Zealand and its key trading partners face a classic stagflation scenario: slowing economic growth alongside a short‑term spike in inflation caused by supply chain disruptions and rising production costs.

S&P 500 (US500) 7,563.63 +43.27 (+0.58%)

Dow Jones (US30) 50,668.97 +24.69 (+0.05%)

DAX (DE40) 25,092.25 −85.55 (−0.34%)

FTSE 100 (UK100) 10,425.96 −79.05 (−0.75%)

USD Index 99.02 −0.18 (−0.18%)

News feed for: 2026.05.29

  • Japan Tokyo Core CPI (m/m) at 02:30 (GMT+3) – JPY (HIGH)
  • Japan Unemployment Rate (m/m) at 02:30 (GMT+3) – JPY (MED)
  • Japan Retail Sales (m/m) at 02:50 (GMT+3) – JPY (HIGH)
  • Japan Industrial Production (m/m) at 02:50 (GMT+3) – JPY (MED)
  • UK BoE Gov Bailey Speaks at 11:20 (GMT+3) – GBP (MED)
  • German Inflation Rate (m/m) at 15:00 (GMT+3) – EUR (MED)
  • Canada GDP (m/m) at 15:30 (GMT+3) – CAD (MED)
  • US Chicago PMI (m/m) at 16:45 (GMT+3) – USD (MED)

By JustMarkets


This article reflects a personal opinion and should not be interpreted as an investment advice, and/or offer, and/or a persistent request for carrying out financial transactions, and/or a guarantee, and/or a forecast of future events.

Week Ahead: Dollar in the crosshairs

By ForexTime 

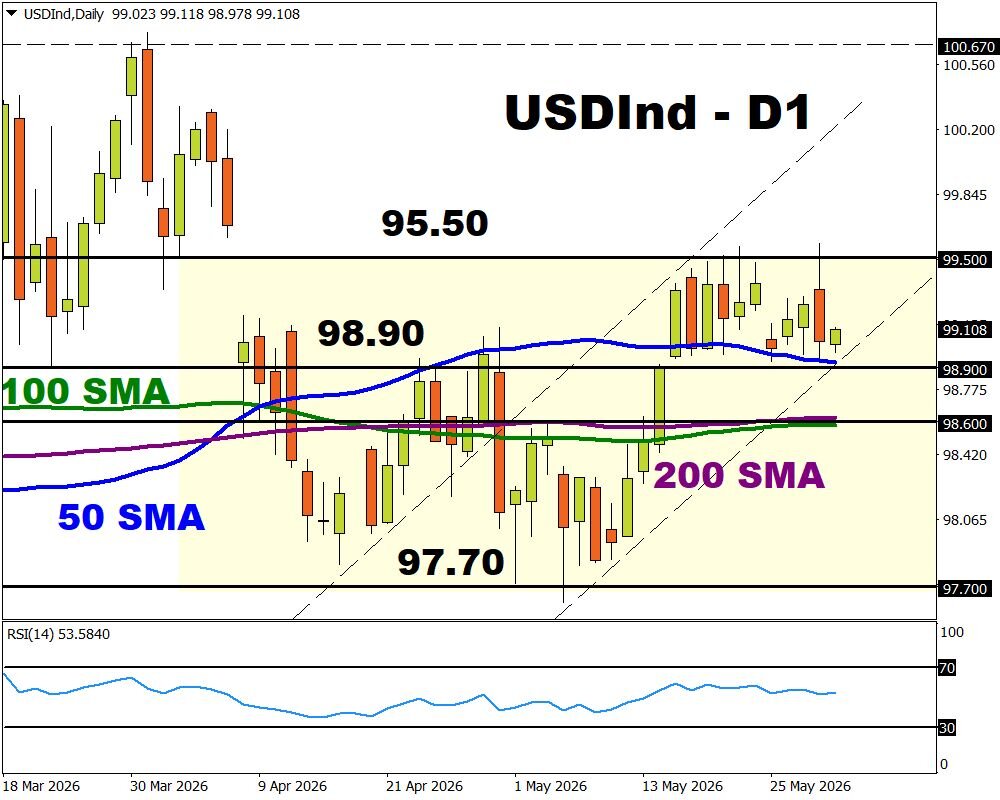
  • FXTM’s USDInd ↑ 0.8% YTD 
  • Iran conflict + US NFP combo = fresh volatility? 
  • Over past year, NFP triggered moves of ↑ 0.3% & ↓ 1.2% 
  • NFP forecast to trigger moves of ↑ 0.3% & ↓ 0.4% 
  • Technical levels: 99.50, 50-day, 200-day SMA 

The first full trading week of June is packed with high-impact events.

A volley of market-moving events, the US May jobs report, the OECD economic outlook and speeches from the financial heavyweights set the stage for serious volatility.

Monday, 1st June

• AUD: Australia Melbourne Institute inflation gauge

• CNY: China RatingDog manufacturing PMI

• EUR: Eurozone S&P Global manufacturing PMI, unemployment, inflation expectations

• GBP: UK S&P Global manufacturing PMI, Nationwide house prices

•  USDInd: ISM Manufacturing, S&P Global manufacturing PMI

Tuesday, 2nd June

• EUR: Eurozone CPI

• USDInd: Minneapolis Fed President Neel Kashkari, Cleveland Fed President Beth Hammack speech

Wednesday, 3rd June

• AUD: Australia GDP

• CNY: China RatingDog services PMI

• EUR: Eurozone S&P Global services PMI, PPI

• OECD releases its latest economic outlook

• USDInd: Fed Beige Book, ISM services index, US Treasury Secretary Scott Bessent testimony

Thursday, 4th June

• EUR: Eurozone retail sales

• USDInd: US initial jobless claims, San Francisco Fed President Mary Daly speech

• GBP: BOE Governor Andrew Bailey speech

Friday, 5th June

• CAD: Canada unemployment

• EUR: Eurozone GDP

• GBP: BOE Governor Andrew Bailey speech

• USDInd: US unemployment, nonfarm payrolls


One instrument sits right at the centre of it all – FXTM’s USDInd.

Note: The USD Index tracks how the dollar is performing against a basket of six different G10 currencies, including the Euro, British Pound, Japanese Yen, and Canadian dollar.


Here is how they are weighed:

  • Euro: 57.6%
  • JPY: 13.6% 
  • GBP: 11.9% 
  • CAD: 9.1% 
  • SEK: 4.2%
  • CHF: 3.6%


For weeks, the USD Index has been stuck…coiled inside a wide range, going nowhere fast.

Same story, different day.


But that range won’t hold forever with the lineup of key events potentially sparking a major move.


Here are 4 reasons why a breakout could be on the horizon:


1) US-Iran tentative deal

In a welcome development to global markets, the US and Iran have reached a tentative deal to extend a ceasefire by 60 days and launch further talks on Tehran’s nuclear program.

However, President Donald Trump has yet to agree to the terms.

Nevertheless, this marks a positive shift somewhat outweighing concerns about clashes in the Persian Gulf.

  •  If Trump signs of the ceasefire deal, this may raise hopes of the re-opening of the Strait of Hormuz – weakening the dollar as inflation fears cool.
  • Should the tentative deal fall apart, the dollar may rally on renewed inflation concerns and geopolitical risk


2) US May NFP report

The May US jobs report on Friday 5th June may provide critical insight into the health of the labour markets.

Here’s what economists predict for this closely watched jobs report:

  • Headline NFP figure: 93,000 (new jobs added to US labour market)

If so, this would be a decline from the April 115,000 headline NFP figure.

  • Unemployment rate: 4.3%

If so, this would match April unemployment rate

  • Average hourly earnings month-on-month (May 2026 vs. APril 2026): 0.3%

If so, this would higher than April’s figure.

Note: Other key data in the week including the ADP and Fed speeches may influence gold prices.

  • A stronger-than-expected US jobs data may stimulate bets around the Fed hiking rates – boosting the USDInd.
  • A weaker-than-expected figure could cool bets around Fed hikes, weakening the USDInd.

Note: Traders are currently pricing a 56% chance that the Fed will hike rates by December 2026.


3) Major central bank speakers

A host of Fed speakers and financial heavyweights will be under the spotlight in the week ahead.

Central bank heads from BoE’s Andrey Bailey, BoJ Governor Kazuo Ueda, RBA Governor Michele Bullock may share key insight into future policy moves and thoughts on inflation. This could translate into heightened volatility for the USDInd given how its weighted.


4) Technical forces                                                                   

FXTM’s USDInd remains in a wide range.

  • A solid breakout and daily close above 99.50 could trigger an incline towards the 100.00 and 100.67.
  • Should prices break below 98.90, bears could be encouraged to hit the 200-day SMA and 97.70.


Forex-Time-LogoArticle by ForexTime


ForexTime Ltd (FXTM) is an award winning international online forex broker regulated by CySEC 185/12 www.forextime.com

Volatility in EUR/USD Eases, but Market Risks Remain

By Analytical Department RoboForex

EUR/USD ended Friday at 1.1640 following significant volatility during the previous session. Pressure on the US dollar emerged after reports suggested that the US and Iran had reached preliminary agreements aimed at resolving the conflict. This helped ease market concerns over inflation and the need for further interest rate hikes.

According to media reports, Washington and Tehran are discussing a 60-day extension of the ceasefire alongside negotiations regarding Iran’s nuclear programme. The possibility of fully restoring shipping through the Strait of Hormuz is also reportedly under consideration.

However, a final agreement has yet to be approved. Reports indicate that Donald Trump has not formally endorsed the proposed terms of the deal.

Additional pressure on the dollar came from US PCE inflation data, which showed weaker price pressures than investors had anticipated. This reduced concerns about the impact of the energy crisis on inflation.

Despite this, markets still expect the Federal Reserve to keep interest rates at current levels for an extended period, at least over the coming quarters.

Technical Analysis

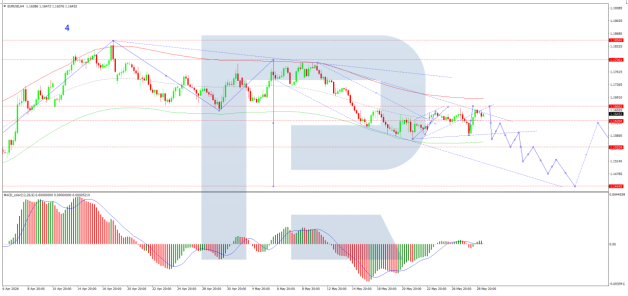
On the H4 EUR/USD chart, the pair is trading within a consolidation range around 1.1616, currently extending down to 1.1585. A move higher towards 1.1666 is likely, ** as a retest from below, followed by a decline towards 1.1555. The MACD indicator supports this scenario, with the signal line above zero and pointing firmly upwards, indicating continued bullish momentum.

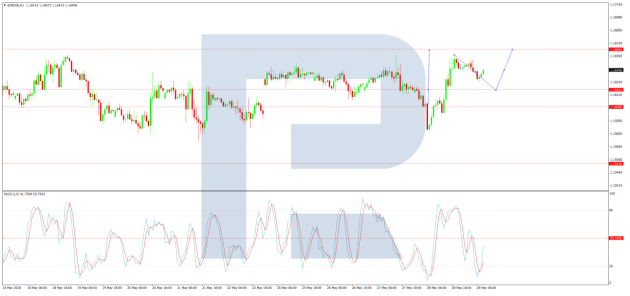
On the H1 chart, EUR/USD has reached 1.1660 and is now pulling back towards 1.1626. A further rise towards 1.1666 may follow, before a possible decline towards 1.1555. The Stochastic oscillator confirms this scenario, with the signal line above 20 and pointing upwards towards 80.

Conclusion

EUR/USD stabilised after heightened volatility as easing geopolitical tensions and softer US inflation data weakened the dollar. Nevertheless, uncertainty surrounding US–Iran negotiations and expectations of prolonged high US interest rates continue to pose risks to the pair.


Disclaimer

Any forecasts contained herein are based on the author’s particular opinion. This analysis may not be treated as trading advice. RoboForex bears no responsibility for trading results based on trading recommendations and reviews contained herein.

Bitcoin fell below $74,000. The Canadian dollar dropped to a six‑week low

By JustMarkets 

On Wednesday, the US stock market showed restrained dynamics. By the end of the day, the Dow Jones Index (US30) rose by 0.36%. The S&P 500 Index (US500) increased by 0.02%. The Technology‑heavy NASDAQ Index (US100) closed lower by 0.09%. Performance in the technology sector was mixed. Semiconductor manufacturers maintained upward momentum – Micron shares gained another 2% following yesterday’s 19% rally triggered by UBS analysts tripling the company’s target price. At the same time, major software and cloud solution developers came under moderate selling pressure: Microsoft, Amazon, and Alphabet fell by more than 1%.

Bitcoin fell below $74,000, hitting a five‑week low amid a clear cooling of institutional demand. The main bearish factor was the reversal in the US spot Bitcoin ETF sector: after two months of steady inflows, net outflows from the funds exceeded $1 billion in May. Declining speculative interest and overall trader passivity also pushed BTC implied volatility to a nine‑month low, sharply reducing demand for put options used to hedge against market declines.

The Canadian dollar (“loonie”) weakened to below 1.382 per US dollar, marking a six‑week low. The decline of the national currency was triggered by a combination of weak domestic macroeconomic data and a strong contrast in monetary policy rhetoric between Canada and the United States. The Bank of Canada’s (BoC) preferred core inflation indicators fell more than analysts expected, reaching their lowest levels in the past five years. This confirms the Canadian regulator’s view that inflationary pressure outside the energy sector is fading, while the current spike in fuel prices is temporary. According to preliminary estimates, Canada’s GDP growth for the first quarter of 2026 will be at zero, indicating serious risks to economic growth and effectively removing incentives for the Bank of Canada to continue raising interest rates.

European stock indices closed in the green, showing a moderate recovery after large‑scale sell‑offs the day before. By the end of the day, Germany’s DAX (DE40) fell by 0.03%, France’s CAC 40 (FR40) closed up 0.43%, Spain’s IBEX 35 (ES35) rose by 0.49%, and the UK’s FTSE 100 (UK100) closed in the green at 0.13%. A positive driver for Eurozone equities and sovereign bonds was a noticeable decline in energy prices. The cyclical luxury and high‑end consumer goods sector delivered a strong session. Amid hopes for slowing inflation, shares of LVMH, Hermes, Adidas, and L’Oreal surged between 2.5% and 5.5%. The banking sector also closed higher, led by Santander and Intesa Sanpaolo (+1.5%).

Prices for US WTI crude oil plunged more than 4%, falling below the psychological level of $90 per barrel. Quotes approached a five‑week low amid a sharp surge of optimism around a potential peace agreement between Washington and Tehran. State television of the Islamic Republic reported the preparation of an unofficial draft interim agreement intended to end the three‑month war and fully unblock the Strait of Hormuz (which accounts for about 20% of global oil and LNG shipments). Later, Iranian officials confirmed that indirect contacts with Washington were ongoing. The White House quickly denied Tehran’s statements, calling the news of a completed draft “pure fiction,” while Secretary of State Marco Rubio again warned that several more days may pass before a final deal is reached.

In Asia on Tuesday, Japan’s Nikkei 225 (JP225) fell by 0.01%, China’s FTSE China A50 closed lower by 0.44%, Hong Kong’s Hang Seng (HK50) declined by 1.06%, and Australia’s ASX 200 (AU200) rose by 0.69%.

The Australian dollar (AUD) fell to a six‑week low near 0.71 USD amid a sharp 1.1% drop in household spending in April. Consumers, discouraged by expensive fuel and geopolitical instability, began cutting back heavily on food, clothing, and travel, signaling effective demand cooling under the Reserve Bank of Australia’s tight policy.

S&P 500 (US500) 7,520.36 +1.24 (+0.02%)

Dow Jones (US30) 50,644.28 +182.60 (+0.36%)

DAX (DE40) 25,177.80 −7.09 (−0.03%)

FTSE 100 (UK100) 10,505.01 +13.62 (+0.13%)

USD Index 99.21 +0.05 (+0.05%)

News feed for: 2026.05.28

  • New Zealand Annual Budget Release (m/m) at 05:00 (GMT+3) – NZD (MED)
  • Eurozone ECB President Lagarde Speaks at 10:20 (GMT+3) – EUR (LOW)
  • Switzerland SNB Chairman Schlegel Speaks at 14:00 (GMT+3) – CHF (LOW)
  • Eurozone ECB Monetary Policy Meeting Accounts at 14:30 (GMT+3) – EUR (LOW)
  • US Core PCE Index (m/m) at 15:30 (GMT+3) – USD (HIGH)
  • US Durable Goods Orders (m/m) at 15:30 (GMT+3) – USD (MED)
  • US Initial Jobless Claims (w/w) at 15:30 (GMT+3) – USD (MED)
  • US New Home Sales (m/m) at 17:00 (GMT+3) – USD (MED)
  • Canada BoC Financial Stability Report at 17:00 (GMT+3) – CAD (LOW)
  • US Natural Gas Storage (w/w) at 17:30 (GMT+3) – XNG (HIGH)
  • US Crude Oil Reserves (w/w) at 18:00 (GMT+3) – WTI (HIGH)

By JustMarkets


This article reflects a personal opinion and should not be interpreted as an investment advice, and/or offer, and/or a persistent request for carrying out financial transactions, and/or a guarantee, and/or a forecast of future events.

Gold Under Pressure: Third Consecutive Session of Declines

By Analytical Department RoboForex

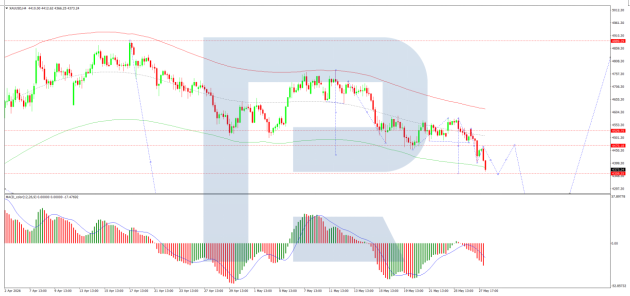
Gold fell to 4,387 USD per troy ounce on Thursday, marking its third consecutive session of losses. The market remains cautious amid persistent uncertainty surrounding negotiations between the US and Iran, which continue to fuel concerns over inflation and the prospect of prolonged high interest rates.

Key disagreements between the two sides remain unresolved. Tehran continues to insist on maintaining control over the Strait of Hormuz and preserving its nuclear program.

US President Donald Trump previously stated that Washington would not accept a “bad deal” and was unwilling to ease sanctions on Iran, despite Tehran’s demands for financial concessions and an end to attacks.

Even if progress towards an agreement is achieved, markets still expect elevated energy prices to persist. This is likely to maintain inflationary pressure and force major central banks to keep monetary policy restrictive for longer, rather than moving towards rate cuts.

Since the beginning of the conflict, gold has already lost more than 15% of its value amid a stronger US dollar, rising bond yields, and expectations of higher interest rates across the global economy.

Technical Analysis

On the H4 XAU/USD chart, the market is trading within a consolidation range around 4,470 USD. A move lower towards 4,359 USD is likely. A corrective rebound to 4,470 USD (a retest from below) may follow, before a further decline towards 4,238 USD, with scope for an extension to 4,170 USD. The MACD indicator confirms the current bearish momentum, with the signal line below the centre line and pointing firmly downwards.

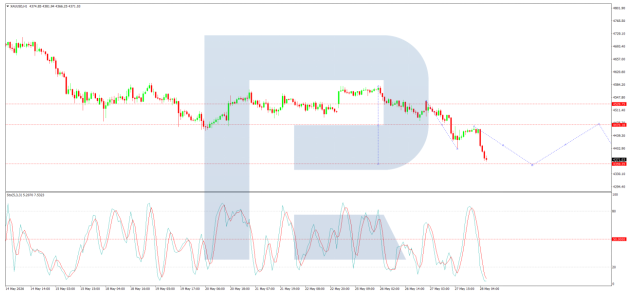
On the H1 chart, the market has broken below the 4,470 USD level and continues to move lower towards 4,390 USD. A corrective rebound to retest 4,470 USD from below remains possible, followed by another decline towards 4,250 USD. A subsequent rebound towards 4,390 USD may follow. The Stochastic oscillator supports this scenario, with the signal line below 20 and pointing firmly downwards.

Conclusion

Gold remains under significant pressure amid geopolitical uncertainty, elevated inflation expectations, and restrictive monetary policy. Technical indicators suggest bearish momentum remains dominant, although short-term corrective rebounds are possible.


Disclaimer

Any forecasts contained herein are based on the author’s particular opinion. This analysis may not be treated as trading advice. RoboForex bears no responsibility for trading results based on trading recommendations and reviews contained herein.

The RBNZ has openly acknowledged rising stagflation risks in the economy. Inflation is slowing in Australia

By JustMarkets 

The US stock indices showed mixed dynamics. By the end of the day, the Dow Jones (US30) fell by 0.23%. The S&P 500 (US500) rose by 0.61%. The Technology‑heavy NASDAQ (US100) closed higher by 1.19%. Against the backdrop of cautious optimism surrounding Middle East de‑escalation and a potential agreement between the US and Iran, the tech sector pushed the NASDAQ to a new all‑time high.

The main winner of the session was Micron Technology, whose shares surged by 19.3%, allowing the chipmaker’s market capitalization to surpass 1 trillion dollars for the first time in history. A powerful catalyst was a UBS analyst report that sharply raised the stock’s target price, citing the potential for it to double amid strong demand for memory chips. Positive momentum in the IT sector was supported by Alphabet (+1.4%), Broadcom (+1.9%), and Tesla (+1.8%), while heavyweights Nvidia (-0.2%), Microsoft (-0.6%), and Amazon (-0.4%) corrected lower.

In Europe, Germany’s DAX (DE40) fell by 0.80%, France’s CAC 40 (FR40) closed down 1.03%, Spain’s IBEX 35 (ES35) declined by 0.52%, while the UK’s FTSE 100 (UK100) closed in the green at 0.24%. The yield on 10‑year German government bonds rose to 2.97%, rebounding from the previous day’s six‑week low. The reversal in Eurozone sovereign debt was driven by renewed escalation in the Middle East: new US retaliatory strikes on targets in southern Iran shattered hopes for a quick end to the three‑month conflict and pushed Brent crude prices higher, intensifying investor concerns about persistently elevated global inflation. Additional pressure on bonds (leading to higher yields) came from hawkish comments by ECB official Isabel Schnabel. In an interview with Reuters, she emphasized that the regulator must raise interest rates in June regardless of the outcome of US-Iran diplomatic talks, as the prolonged energy shock has already deeply embedded itself in the European economy.

Prices for US WTI crude oil partially recovered losses and climbed toward 94 dollars per barrel. The movement was driven by another escalation in the Middle East, where new localized clashes erupted amid fragile peace negotiations: the US Navy resumed forced escort of tankers after strikes near the Strait of Hormuz, while Iran’s Islamic Revolutionary Guard Corps (IRGC) claimed to have fired on a US F‑35 fighter jet and several drones allegedly violating the country’s airspace.

In Asia on Tuesday, Japan’s Nikkei 225 (JP225) fell by 0.50%, China’s FTSE China A50 closed higher by 0.75%, Hong Kong’s Hang Seng (HK50) slipped by 0.03%, and Australia’s ASX 200 (AU200) declined by 0.39%.

The New Zealand dollar rose to 0.587 USD in response to the “hawkish” outcome of the Reserve Bank of New Zealand (RBNZ) meeting. As expected, the regulator kept the official cash rate at 2.25%, but significantly toughened its rhetoric, hinting at the inevitability of rate hikes in the coming months. According to the central bank’s updated expectations, the rate may rise to 2.84% by year‑end (implying at least two 25‑basis‑point hikes) due to serious risks of inflation accelerating to 4.3% in the third quarter amid the prolonged Middle East crisis and sharply rising fuel costs.

The Australian dollar slightly weakened, pulling back from its recent weekly high toward 0.71 USD. The local decline in the “aussie” was triggered by fresh data from the Australian Bureau of Statistics showing a sharper‑than‑expected slowdown in inflation. The monthly CPI for April fell to 0.4% (after March’s seven‑month peak of 1.1%), while annual inflation slowed from 4.6% to 4.2% (vs. the 4.4% outlook), largely due to government fuel tax relief. The Reserve Bank of Australia’s preferred trimmed mean indicator rose by 0.3% for the month, and accelerated to 3.4% year‑on‑year, reaching its highest level since late 2024.

S&P 500 (US500) 7,519.12 +45.65 (+0.61%)

Dow Jones (US30) 50,461.68 −118.02 (−0.23%)

DAX (DE40) 25,184.89 −204.21 (−0.80%)

FTSE 100 (UK100) 10,491.39 +25.13 (+0.24%)

USD Index 99.16 -0.08 (-0.08%)

News feed for: 2026.05.27

  • Japan BOJ Gov Ueda Speaks at 03:00 (GMT+3) – JPY (LOW)
  • Australia Consumer Price Index (m/m) at 04:30 (GMT+3) – AUD (HIGH)
  • New Zealand RBNZ Interest Rate Decision at 05:00 (GMT+3) – NZD (HIGH)
  • New Zealand RBNZ Rate Statement at 05:00 (GMT+3) – NZD (HIGH)
  • New Zealand RBNZ Press Conference at 06:00 (GMT+3) – NZD (MED)
  • Eurozone ECB Financial Stability Review at 11:00 (GMT+3) – EUR (LOW)

By JustMarkets


This article reflects a personal opinion and should not be interpreted as an investment advice, and/or offer, and/or a persistent request for carrying out financial transactions, and/or a guarantee, and/or a forecast of future events.