Dollar Firms on Rising Coronavirus Cases in the US

By Orbex

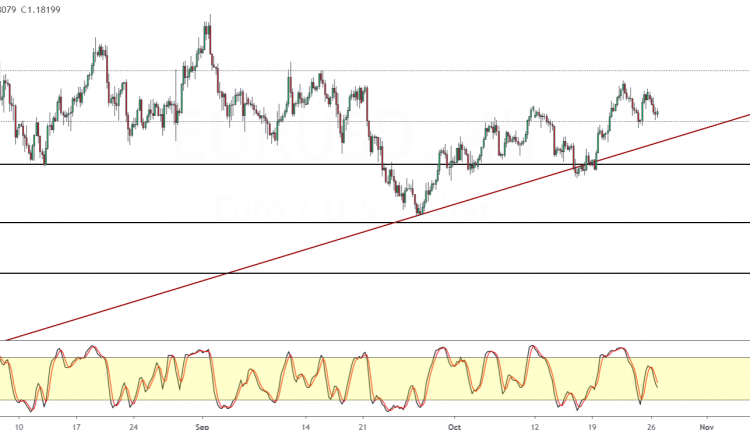
EURUSD Dips Closer Back To 1.1800

The common currency is trading weaker on Monday, largely due to a slightly higher greenback.

Price action continues to ease lower with intraday lows trading just a few pips off the 1.1800 handle.

Continued declines could see the 1.1800 level of support being tested once again.

However, the lower high following the recent rebound off 1.1800 signals caution.

A breakdown below 1.1800 could see price action pushing lower and potentially shifting the short term trend.

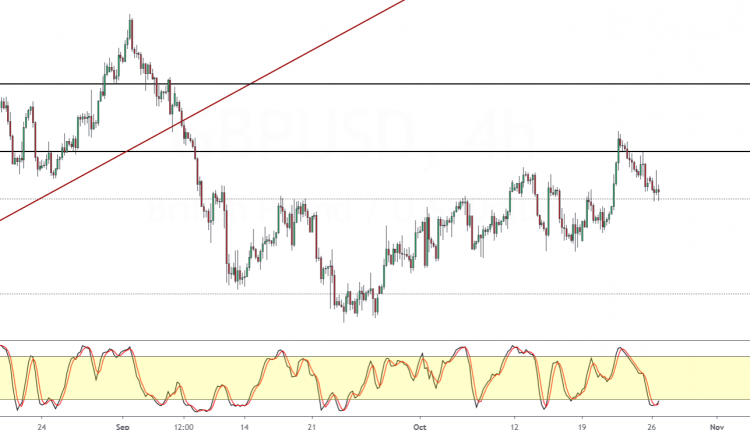
GBPUSD Holds The Range Between 1.3122 & 1.3000

The British pound sterling drifted lower on Monday as intraday prices briefly tested the 1.3000 handle.

However, price action remains volatile around this level.

The Stochastics oscillator is oversold and could signal a short term move to the upside.

Meanwhile, price action is on track to close bearish for the third consecutive daily session. Still, prices remain well within the range from last Wednesday.

As a result, only a bearish close below 1.2944 could spell further declines.

For the moment, the bias remains mixed.

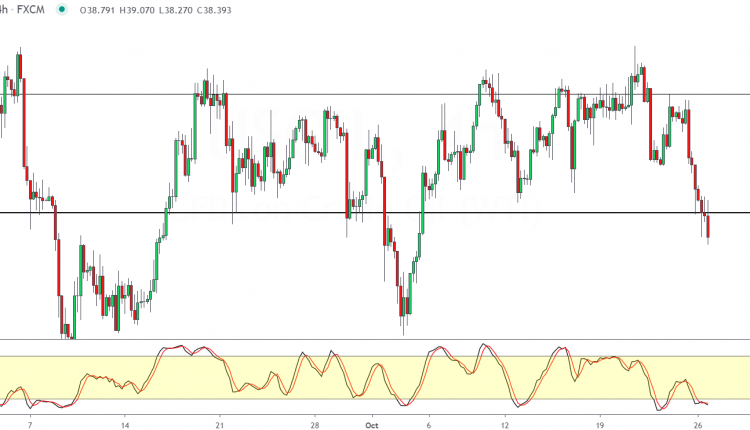
WTI Crude Oil Loses The 38.83 Floor Again

Oil prices are trading bearish, as the sentiment shifts to the downside.

The rising number of coronavirus cases in the US once again dampens the outlook for demand.

As a result, oil prices slipped below the 38.83 floor that held up previously.

The breakdown below this level is, however, gradual. This could mean that price could once again creep back higher to continue with the sideways trend.

If the current bearish momentum continues, oil prices could be testing the 2nd October lows near 37.

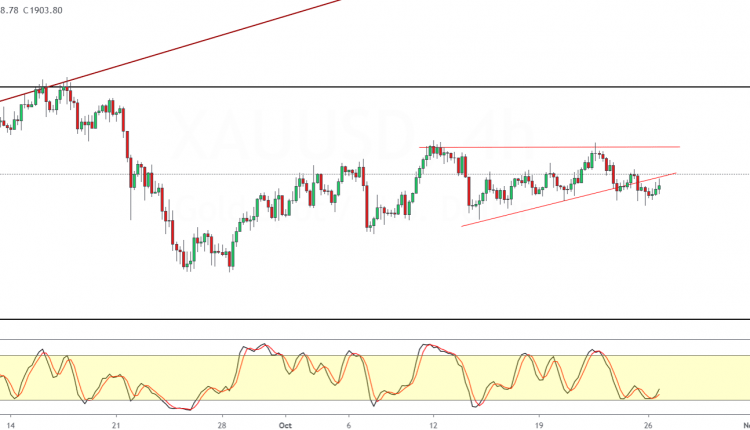
Gold Trades Muted Despite Bearish Market Sentiment

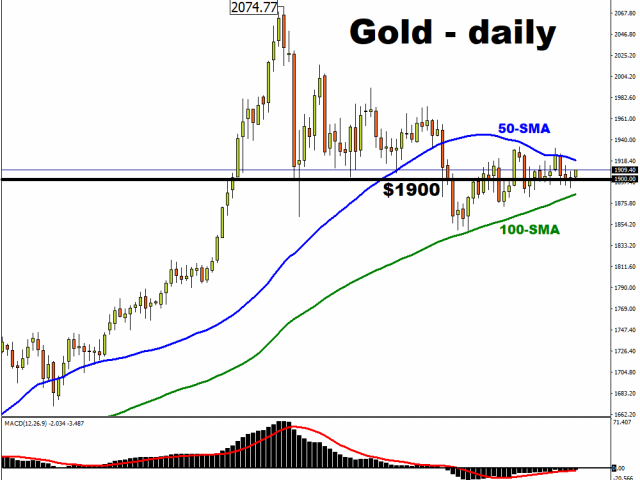
The precious metal is attempting to make some recovery, but price action remains broadly muted.

This comes even as the US equity markets are trading in the red on Monday.

With no clear progress on the stimulus bill and the dollar firming, gold prices are in check.

For the moment, the consolidation near the 1900 – 1911.50 level continues.

To the downside, a soft support is near the 1890 handle.

A close below 1890 could signal a shift for further declines in price action. This could potentially open the way for a move to the 1850 handle next.

By Orbex

What To Expect From BOJ, BOC & ECB This Week

By Orbex

With many countries in the world seeing a renewed spike in covid cases, lockdowns and other restrictions are being reimposed.

The economic impact of that is likely to increase calls for central banks to step in with more easing. But most have already turned up their easing to the maximum.

Central banks would have been in a position to pivot towards a more long-term position if it hadn’t been for the increased case numbers.

More easing would likely support the stock market, on top of a desire to move to non-liquid investments. On the other hand, we might expect further weakness in the currency markets.

Let’s have a look at the three major central bank events coming up this week.

Canada to Carry On?

First up we have the interest rate decision from the BOC.

Covid cases in Canada have spiked past their “first wave” highs this month, prompting new restrictions. But that doesn’t seem to have changed the outlook for the economy all that much.

Recent data has shown positive trends, with inflation lifting and job creation being higher than expected.

The consensus of expectations is the BOC will leave their policy unchanged. The accompanying statement is expected to reiterate the same points made a month ago.

There is a general perception that Canada’s economy is likely to be subjected to how commodities evolve.

In that respect, there is a lot of uncertainty in the upcoming US election. And the BOC likely will want to see how the risk situation in their southern neighbor and largest trade partner plays out, first.

Japan’s Disciplined but Slow Recovery

The consensus is unanimous that the BOJ will keep their rates and buying at the same level as before. But, the central bank is expected to announce cuts to their growth and inflation forecasts for this year.

The change in forecasts is not expected to have a major impact on the currency, because there isn’t much agreement that the BOJ will change policy in the near future.

Japan is trying to push for further economic activation, while at the same time the new PM is in favor of raising taxes. The country already has the highest tax rate in the OECD, and the consensus is that a higher burden on business will slow recovery.

The yen might fluctuate a bit during Governor Kuroda’s interminable press conference, however, if he hints at any policy changes.

More Emergency Spending in Europe?

There is a pretty broad consensus that the ECB will stand pat on its policies. But, the question is when/if there will be an increase in further PEPP.

Covid cases have spiked across Europe prompting new lockdowns and a significant drop in consumer and business confidence.

With the euro’s weakness, the summer’s controversy about the exchange rate is likely not to be an issue.

There is a pretty strong consensus that the ECB is going to announce an increase in easing in December. But there isn’t so much agreement on whether Lagarde will come out to hint at it this time around.

So, if there isn’t mention in the statement, we could wait for the press conference to see if there is any volatility in the euro.

By Orbex

Japanese Candlesticks Analysis 27.10.2020 (GOLD, NZDUSD, GBPUSD)

Article By RoboForex.com

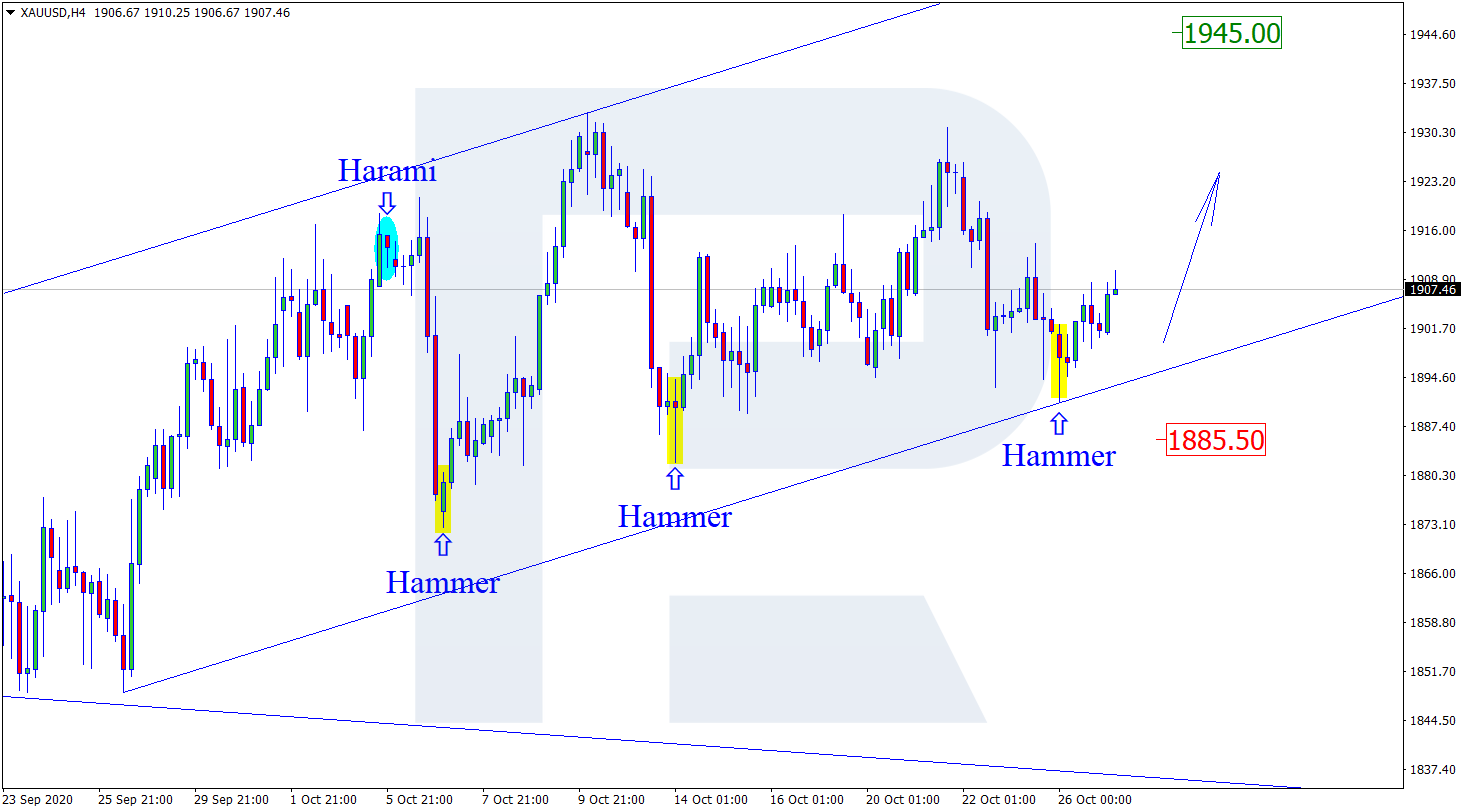
XAUUSD, “Gold vs US Dollar”

As we can see in the H4 chart, the pair is finishing the correction within the rising tendency. After forming another Hammer pattern not far from the support area, XAUUSD may reverse and move towards the next upside target at the resistance area at 1945.00. At the same time, an opposite scenario implies that the price may start another decline with the target at 1885.50 before resuming the uptrend.

XAUUSD
Risk Warning: the result of previous trading operations do not guarantee the same results in the future

NZDUSD, “New Zealand vs. US Dollar”

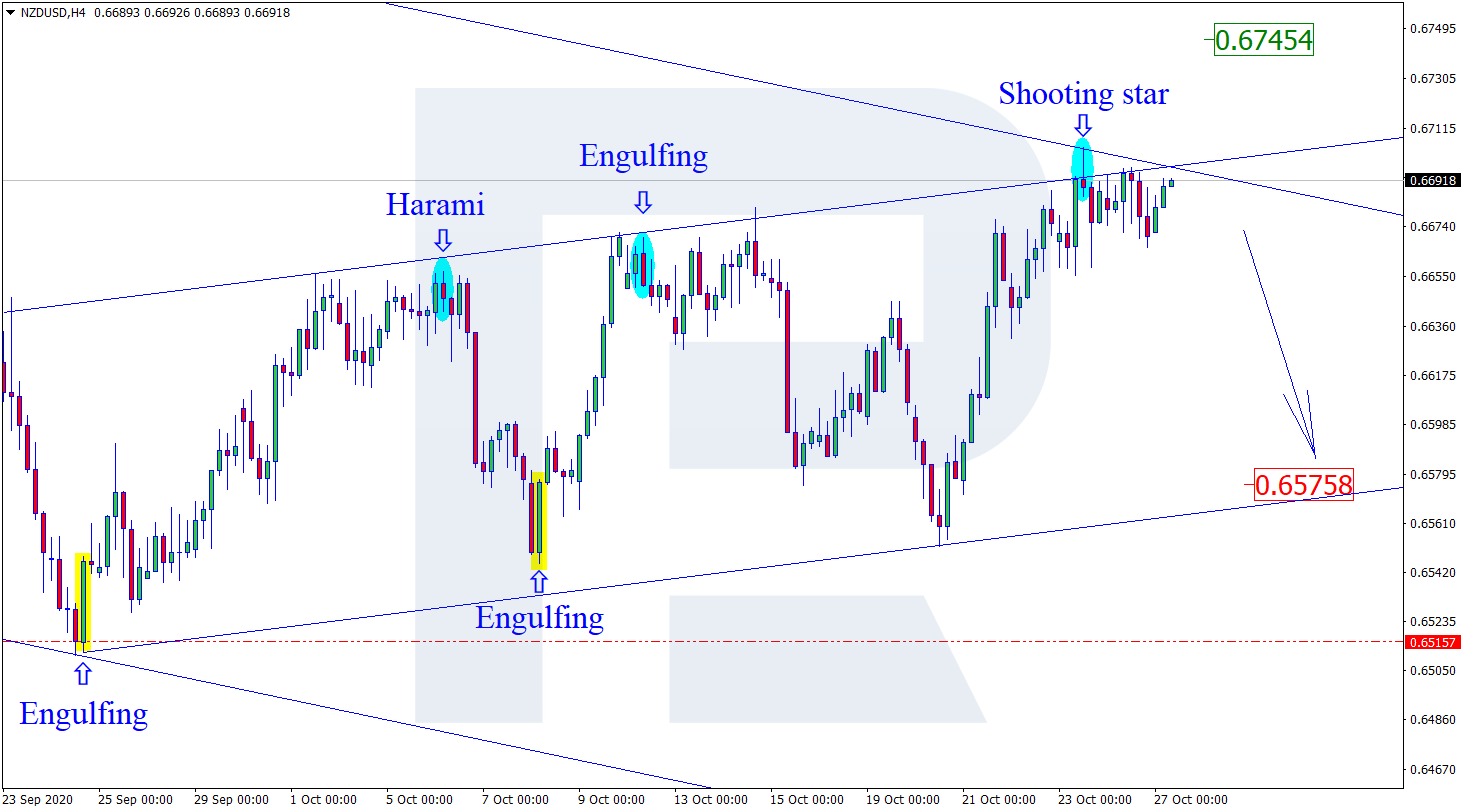
As we can see in the H4 chart, the uptrend continues. After forming several reversal patterns, such as Shooting Star, not far from the channel’s upside border, NZDUSD may reverse and resume moving downwards to reach the channel’s downside border. The next downside target may be the support area at 0.6575. Still, an alternative scenario says that the pair may continue trading upwards to reach 0.6745 without reversing and correcting.

NZDUSD
Risk Warning: the result of previous trading operations do not guarantee the same results in the future

GBPUSD, “Great Britain Pound vs US Dollar”

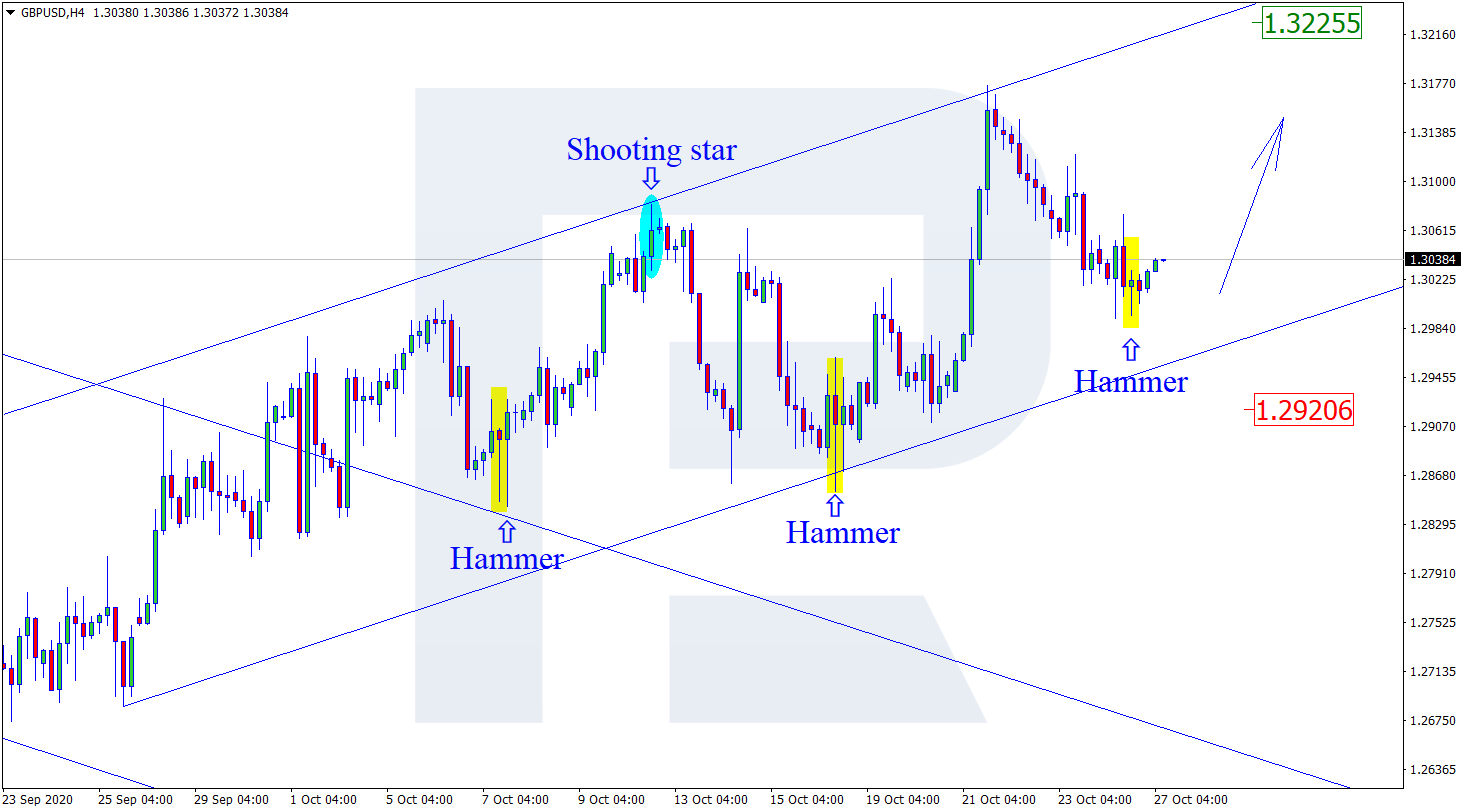
As we can see in the H4 chart, the ascending tendency continues. By now, GBPUSD has formed several reversal patterns, such as Hammer, not far from the support area. At the moment, the pair is reversing and may later grow with the target at 1.3225. However, despite the current uptrend, there might be another scenario, according to which the price may fall and correct to reach 1.2920 without reversing.

GBPUSD

Article By RoboForex.com

Attention!
Forecasts presented in this section only reflect the author’s private opinion and should not be considered as guidance for trading. RoboForex LP bears no responsibility for trading results based on trading recommendations described in these analytical reviews.

Ichimoku Cloud Analysis 27.10.2020 (NZDCHF, GBPAUD, USDCNH)

Article By RoboForex.com

NZDCHF, “New Zealand Dollar vs Swiss Franc”

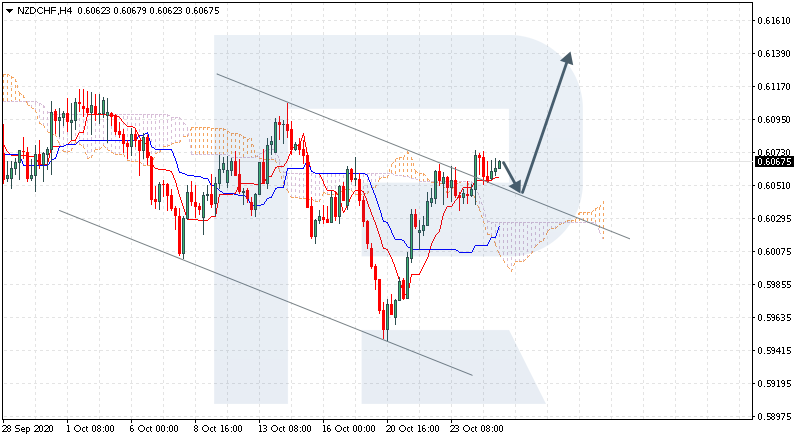
NZDCHF is trading at 0.6067; the instrument is moving above Ichimoku Cloud, thus indicating an ascending tendency. The markets could indicate that the price may test Tenkan-Sen and Kijun-Sen at 0.6040 and then resume moving upwards to reach 0.6140. Another signal in favor of further uptrend will be a rebound from the descending channel’s upside border. However, the bullish scenario may no longer be valid if the price breaks the cloud’s downside border and fixes below 0.5975. In this case, the pair may continue falling towards 0.5885.

NZDCHF
Risk Warning: the result of previous trading operations do not guarantee the same results in the future

GBPAUD, “Great Britain Pound vs Australian Dollar”

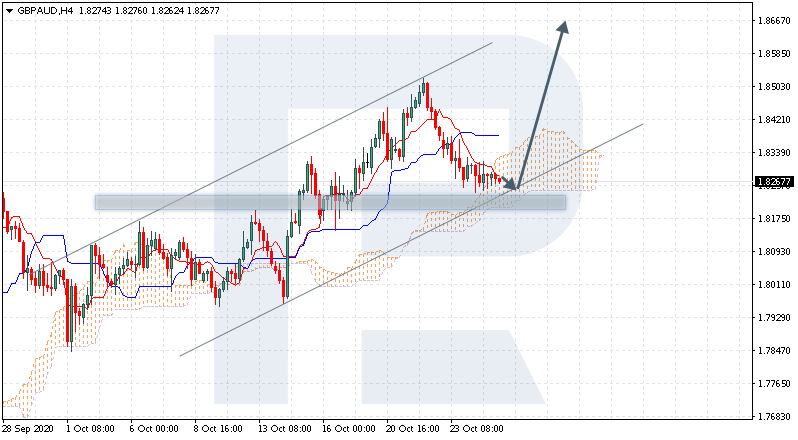
GBPAUD is trading at 1.8267; the instrument is moving inside Ichimoku Cloud, thus indicating a sideways tendency. The markets could indicate that the price may test the cloud’s downside border at 1.8255 and then resume moving upwards to reach 1.8665. Another signal in favor of further uptrend will be a rebound from the rising channel’s downside border. However, the bullish scenario may no longer be valid if the price breaks the cloud’s downside border and fixes below 1.8170. In this case, the pair may continue falling towards 1.8085. To confirm further growth, the asset must break the cloud’s upside border and fix above 1.8425.

GBPAUD
Risk Warning: the result of previous trading operations do not guarantee the same results in the future

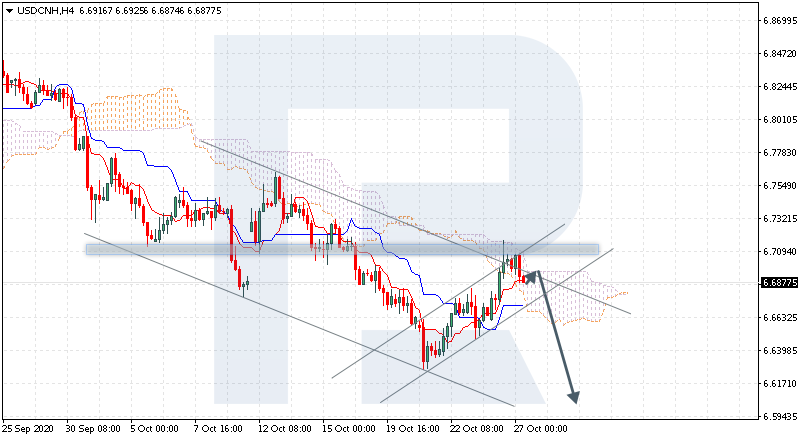
USDCNH, “US Dollar vs Chinese Yuan”

USDCNH is trading at 6.6877; the instrument is moving inside Ichimoku Cloud, thus indicating a sideways tendency. The markets could indicate that the price may test the cloud’s upside border at 6.6885 and then resume moving downwards to reach 6.6205. Another signal in favor of further downtrend will be a rebound from the descending channel’s upside border. However, the bearish scenario may no longer be valid if the price breaks the cloud’s upside border and fixes above 6.7085. In this case, the pair may continue growing towards 6.7175. To confirm further decline, the asset must break the rising channel’s downside border and fix below 6.6625.

USDCNH

Article By RoboForex.com

Attention!
Forecasts presented in this section only reflect the author’s private opinion and should not be considered as guidance for trading. RoboForex LP bears no responsibility for trading results based on trading recommendations described in these analytical reviews.

Trump’s trade war – what was it good for? Not much

By Rebecca Ray, Boston University 

– The 2016 election was a referendum on free trade, which many blamed for destroying millions of American manufacturing jobs. In 2020, it could be about the merits of trade wars.

During President Donald Trump’s first term, he tore up deals, launched a trade war with China and renegotiated NAFTA. His campaign claims the war was a success and that his policies were bringing back manufacturing jobs – until the pandemic arrived – and so voters should give him another four years.

His Democratic rivals disagree.

“You lost that trade war,” Sen. Kamala Harris snapped during her debate with Vice President Mike Pence, citing the loss of 300,000 manufacturing jobs during Trump’s presidency and bankrupt farmers.

So who’s right?

As an economist who researches international economic policy, I believe Trump’s impulse to rethink trade policy was understandable. If free trade hurt American workers, it stands to reason that putting up barriers to trade – even being willing to “go to war” – might protect those workers.

But wars can backfire – and trade wars are no different.

Free trade’s losers

Economic theory tells us that free trade means a greater availability of cheaper goods because everything will be produced where it can be made least expensively.

That sounds like a great deal for consumers and exporting industries like agriculture that find more buyers for their products. But it’s a raw deal for manufacturing workers as factories move to countries like Mexico and China with lower labor costs.

That’s what happened after the North American Free Trade Agreement became law in 1994 and China joined the World Trade Organization in 2001.

In each case, manufacturing workers were among the big losers as employment in the sector plunged from just under 18 million in 1990 to a little over 14 million in 2004.

The tide turns against trade

As a result, many politicians became more cautious about supporting free trade deals.

When he was a senator in 1993, former Vice President Joe Biden and many other Democrats voted to ratify NAFTA. A little over two decades later, when a free trade bill with Central America and the Dominican Republic came up for a vote, Biden and nearly every Democrat voted no. The bill barely passed.

And although Biden’s administration signed the Trans-Pacific Partnership in 2016 – which would have created the world’s largest free-trade zone – opposition among leading Democrats as well as Trump imperiled its passage in the Senate, leading to the U.S.‘s withdrawal in 2017.

When Trump launched his presidential campaign in 2016, opposition to trade deals like NAFTA was one of his signature issues. At a time when Republican leaders mostly were staunch supporters of free trade, his promise to bring manufacturing jobs back to the U.S. helped him win the primary – and ultimately the presidency – as a growing number of voters began to see trade as bad for Americans.

And as president, he followed through on his pledge and unilaterally imposed tariffs on a range of Chinese products – a list that now totals US$550 billion worth – as well as on most aluminum and steel imports. Thus, Trump’s trade wars began.

My research with colleagues at Boston University shows that trade agreements have indeed hurt U.S. workers. But Trump’s trade wars have not solved the offshoring problem that they were designed to fix.

The trouble with trade wars

Trump has claimed “trade wars are good and easy to win.”

Trump seems to have based this on the assumption that America’s trading partners would not retaliate. He was wrong.

Over many rounds of tit-for-tat, China has retaliated repeatedly by placing tariffs on $185 billion of U.S. exports, most notably agricultural products. After U.S. soybean farmers saw their largest market dry up, the Trump administration was forced to spend $23 billion to offset some of their losses. All told, more than one-third of farm income will come from government subsidies in 2020.

And when the Trump administration planned to impose steel tariffs on Canada earlier this year, America’s northern neighbor vowed retaliation, which would have hurt U.S. exporters. So Trump backed down.

That’s the problem with trade wars. Intended to protect a country’s own workers, they wind up doing a lot of self-inflicted damage, as retaliatory tariffs drive up the cost of exports, hurting businesses and workers at home as well as abroad.

At the same time, U.S. policy seems to have lost sight of the original enemy: the offshoring of American jobs, which has continued to grow. The 2017 tax cut, for example, actually made offshoring more profitable and attractive – making it even harder to achieve the primary goal of the trade war.

Trade wars pay off only if they have a clear vision and lead to meaningful changes in how everyone does business. That hasn’t happened either.

While Trump did reach a “phase one” deal with China in January, it actually looks like it will make the offshoring problem even worse. As part of the truce, the U.S. agreed to reduce its tariffs on Chinese goods and China said it would buy a lot more American products, especially soybeans.

While it may make up for some of the damage caused by the trade war – such as by aiding ailing soybean farmers – it will make offshoring easier by making it more advantageous and profitable for American companies to transfer operations to China. That’s because China also agreed to stop requiring foreign companies that seek to do business within its borders to transfer technology to domestic partners.

A better way to protect workers

One notable exception to all this is the U.S.-Mexico-Canada Agreement, Trump’s replacement for NAFTA that became law in July.

That deal is likely to prevent more offshoring to Mexico because of bipartisan support for labor and environmental provisions that raise minimum Mexican automaker wages.

This points to one of the best ways to actually stop manufacturing offshoring: Negotiate trade agreements that set higher labor and environmental standards for all signatories. This not only helps workers and communities in other countries get better treatment, but also makes U.S. workers more competitive by raising the cost of doing business there. That makes American companies less likely to move operations overseas.

The evidence suggests the best way to limit offshoring is through negotiation and cooperation, not war.The Conversation

About the Author:

Rebecca Ray, Senior Academic Researcher, Boston University

This article is republished from The Conversation under a Creative Commons license. Read the original article.

The Dollar Index Is Consolidating. Investors Expect Additional Drivers

by JustForex

The US dollar shows ambiguous results against a basket of world currencies. The dollar index (#DX) is consolidating in the range of 92.87-93.10. Investors have taken a wait-and-see attitude before the US presidential election, which is scheduled for November 3. The new wave of COVID-19 continues to impact the global economy negatively. At the moment, the number of infected in the world has approached 43.5 million. Some countries have introduced new restrictive measures.

Financial market participants also expect meetings of the Bank of Canada, Bank of Japan and the ECB later this week. Experts agree that regulators will keep the key marks of monetary policy at the same level. We recommend paying attention to the comments by the representatives of the Central Banks. Today, traders will be focused on economic releases from the US.

The “black gold” prices have been growing. At the moment, futures for the WTI crude oil are testing the $39.00 mark per barrel. At 22:30 (GMT+2:00), API weekly US crude oil stock will be published.

Market indicators

Yesterday, there were aggressive sales in the US stock market: #SPY (-1.85%), #DIA (-2.24%), #QQQ (-1.50%).

The 10-year US government bonds yield has become stable after a sharp drop the day before. At the moment, the indicator is at the level of 0.79-0.80%.

The news feed for 2020.10.27:
  • – Durable goods orders in the US at 14:30 (GMT+2:00);
  • – US consumer confidence index at 16:00 (GMT+2:00).

by JustForex


This article reflects a personal opinion and should not be interpreted as an investment advice, and/or offer, and/or a persistent request for carrying out financial transactions, and/or a guarantee, and/or a forecast of future events.

Technical Outlook: Risk-off mood likely to favour Yen

By Lukman Otunuga, Research Analyst, ForexTime

A tidal wave of risk aversion threatens to engulf financial markets as new coronavirus cases surge in the United States and Europe. On top of this, the US stimulus saga and uncertainty it presents continues to drain investor confidence – ultimately fuelling the risk-off vibe.

Our currency spotlight this week shines on the Japanese Yen which has been labelled a trader’s best friend in times of uncertainty. However, Yen bulls seem to be missing in action this morning despite the gloomy mood. Although the currency has weakened against most G10 majors excluding the Dollar, the Yen still has a shot at the throne if risk aversion intensifies ahead of the US election on November 3rd.

Focusing on the technicals, the return of risk aversion may present opportunities on various Yen crosses. Yesterday we covered the USDJPY on the weekly charts and identified key levels of support and resistance.

Our focus today will revolve around the daily timeframes and possible setups ahead of the US election.

USDJPY pressured below 105.00

For as long as the USDJPY is unable to break above the 105.00 resistance level, prices may decline back towards 104.00. Prices are trading below the 20 Simple Moving Average while the MACD trades to the downside. If investors rush towards the Yen’s safe embrace, this may accelerate the decline towards 104.00.

EURJPY on standby

One just can’t help but feel that the EURJPY is waiting for a directional catalyst. Prices are trading within a wide range with support at 123.00 and resistance around 125.00. A breakout/down could be around the corner with the fundamentals potentially sparking the move. Should the Yen gain on risk aversion, this may drag the EURJPY towards 123.00 and 122.40, respectively.

GBPJPY breakout/down setup in play

It’s the same old story on the GBPJPY. Support can be found at 135.70 and resistance may be found around 137.90. A breakout/down from these key levels may set the tone for the GBPJPY in the medium term. Technicals are slowing bending in favour of bears as the MACD trades to the downside while prices are struggling to keep above the 100 Simple Moving Average. If the 135.70 support is conquered, the next key level of interest may be found around 134.40.

AUDJPY finds comfort in lower range

The AUDJPY is rangebound on the daily charts. Sustained weakness below the pivotal 75.50 level may open the doors towards 74.00 and potentially 72.60. Alternatively, a move back above 75.50 could trigger a move towards 77.00 and 78.50.

Disclaimer: The content in this article comprises personal opinions and should not be construed as containing personal and/or other investment advice and/or an offer of and/or solicitation for any transactions in financial instruments and/or a guarantee and/or prediction of future performance. ForexTime (FXTM), its affiliates, agents, directors, officers or employees do not guarantee the accuracy, validity, timeliness or completeness, of any information or data made available and assume no liability as to any loss arising from any investment based on the same.


Forex-Time-LogoArticle by ForexTime

ForexTime Ltd (FXTM) is an award winning international online forex broker regulated by CySEC 185/12 www.forextime.com

The Analytical Overview of the Main Currency Pairs on 2020.10.27

by JustForex

The EUR/USD currency pair

Technical indicators of the currency pair:
  • Prev Open: 1.18574
  • Open: 1.18085
  • % chg. over the last day: -0.36
  • Day’s range: 1.18064 – 1.18359
  • 52 wk range: 1.0637 – 1.2012

There is an ambiguous technical pattern on the EUR/USD currency pair. The trading instrument is consolidating. Financial market participants have taken a wait-and-see attitude before the US presidential elections, which are scheduled for November 3. Investors also expect the ECB meeting later this week. At the moment, the local support and resistance levels are 1.1795 and 1.1840, respectively. We recommend opening positions from these marks.

The news feed on 2020.10.27:
  • – Durable goods orders in the US at 14:30 (GMT+2:00);
  • – US consumer confidence index at 16:00 (GMT+2:00).
EUR/USD

Indicators do not give accurate signals: 50 MA has crossed 100 MA.

The MACD histogram is near the 0 mark. There are no signals at the moment.

Stochastic Oscillator is in the overbought zone, the %K line has crossed the %D line. There are no signals at the moment.

Trading recommendations
  • Support levels: 1.1795, 1.1760, 1.1730
  • Resistance levels: 1.1840, 1.1865, 1.1880

If the price fixes below 1.1795, EUR/USD quotes are expected to fall. The movement is tending to 1.1760-1.1730.

An alternative could be the growth of the EUR/USD currency pair to 1.1870-1.1900.

The GBP/USD currency pair

Technical indicators of the currency pair:
  • Prev Open: 1.30540
  • Open: 1.30192
  • % chg. over the last day: -0.35
  • Day’s range: 1.30133 – 1.30445
  • 52 wk range: 1.1409 – 1.3516

The GBP/USD currency pair is in a sideways trend. There is no defined trend. At the moment, the British pound is consolidating near the round level of 1.3000. The 1.3065 mark is the key resistance. Investors expect additional catalysts to set the tone for trading in the foreign exchange market in the coming days. We recommend paying attention to the news feed from the US. Positions should be opened from key levels.

The publication of important UK economic releases is not planned.

GBP/USD

Indicators do not give accurate signals: 50 MA has crossed 100 MA.

The MACD histogram is near the 0 mark. There are no signals at the moment.

Stochastic Oscillator is in the neutral zone, the %K line is below the %D line, which gives a signal to sell GBP/USD.

Trading recommendations
  • Support levels: 1.3000, 1.2970, 1.2920
  • Resistance levels: 1.3065, 1.3110, 1.3150

If the price fixes below the round level of 1.3000, further correction of the GBP/USD currency pair is expected. The movement is tending to 1.2960-1.2940.

An alternative could be the growth of GBP/USD quotes to 1.3100-1.3120.

The USD/CAD currency pair

Technical indicators of the currency pair:
  • Prev Open: 1.31255
  • Open: 1.32078
  • % chg. over the last day: +0.47
  • Day’s range: 1.31713 – 1.32123
  • 52 wk range: 1.2949 – 1.4669

Purchases prevail on the USD/CAD currency pair. The trading instrument has updated local highs. Currently, the loonie is testing the “mirror” support at 1.3175. The 1.3210 mark is the nearest resistance. The trading instrument has the potential for further growth. Today, we recommend paying attention to economic releases from the US, as well as the dynamics of “black gold” prices. Positions should be opened from key levels.

The news feed on Canada’s economy is calm.

USD/CAD

Indicators signal the power of buyers: the price has fixed above 50 MA and 100 MA.

The MACD histogram is in the positive zone, but below the signal line, which gives a weak signal to buy USD/CAD.

Stochastic Oscillator is in the oversold zone, the %K line has crossed the %D line. There are no signals at the moment.

Trading recommendations
  • Support levels: 1.3175, 1.3155, 1.3125
  • Resistance levels: 1.3210, 1.3235, 1.3255

If the price fixes above 1.3210, further growth in USD/CAD quotes is expected. The movement is tending to 1.3235-1.3260.

An alternative could be a decline in the USD/CAD currency pair to 1.3150-1.3125.

The USD/JPY currency pair

Technical indicators of the currency pair:
  • Prev Open: 104.656
  • Open: 104.840
  • % chg. over the last day: +0.12
  • Day’s range: 104.668 – 104.891
  • 52 wk range: 101.19 – 112.41

The technical pattern on the USD/JPY currency pair is still ambiguous. The trading instrument is consolidating. There is no defined trend. At the moment, the local support and resistance levels are 104.65 and 104.90, respectively. Financial market participants expect additional drivers. We recommend paying attention to the dynamics of US government bonds yield. Positions should be opened from key levels.

The news feed for Japan’s economy is calm.

USD/JPY

Indicators do not give accurate signals: the price has crossed the 50 MA and 100 MA.

The MACD histogram is near the 0 mark. There are no signals at the moment.

Stochastic Oscillator is in the neutral zone, the %K line is above the %D line, which indicates the bullish sentiment.

Trading recommendations
  • Support levels: 104.65, 104.55, 104.40
  • Resistance levels: 104.90, 105.05, 105.30

If the price fixes below 104.65, USD/JPY quotes are expected to fall. The movement is tending to 104.40-104.10.

An alternative could be the growth of the USD/JPY currency pair to 105.20-105.40.

by JustForex


This article reflects a personal opinion and should not be interpreted as an investment advice, and/or offer, and/or a persistent request for carrying out financial transactions, and/or a guarantee, and/or a forecast of future events.

Risk off tone a week before US elections

By Han Tan, Market Analyst, ForexTime

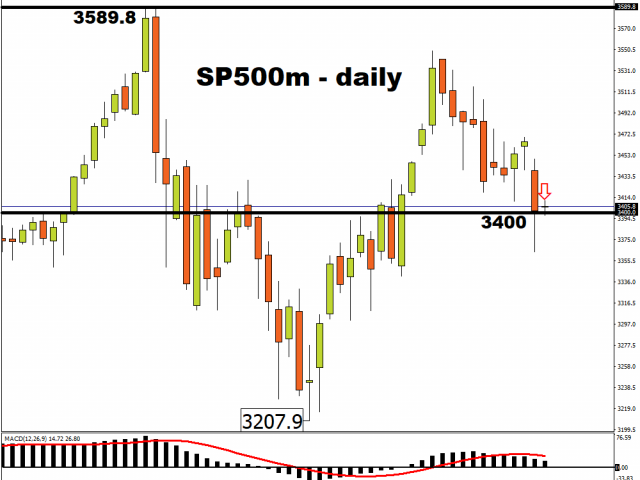
Asian stocks are falling in line with Monday’s selloff in US equities, after the S&P 500 posted a 1.86 percent drop, its biggest one-day decline in over a month. S&P 500 Minis are still smarting from the market’s decision to de-risk as pessimism creeps in over a pre-elections US fiscal stimulus agreement.


Even though China reported a 10.1 percent increase in its September industrial profits, the fourth consecutive month of double-digit on-year gains, leading the world once again in its journey into the post-pandemic era, Asian benchmark indices are still being gripped by the broader risk-off sentiment. The risk aversion nudged Gold higher, keeping it above the psychologically-important $1900 level though still within the tight range it has adhered to of late.


Market’s fears rising

Markets are getting choppier with just a week to go before the US presidential elections. The selloff at the onset of the trading week suggests that investors are facing up to the US political risks that lie just around the bend.

The VIX index, which is widely considered to be Wall Street’s fear gauge, has crossed above the psychologically-important 30 level once more. And the VIX futures contract, which extends into mid-November, rose by 8.86 percent on Monday, indicating expectations for heightened levels of volatility over the coming weeks.

Growing list of concerns

Market participants have to also keep a close watch over Covid-19’s resurgence in major economies, with US infections hitting new records while France reported its biggest spike in hospitalizations since April. The pandemic threatens to wreck the still fledgling recovery in the global economy. Without the veneer of an imminent fiscal support for the US economy, risk assets would likely have a hard time justifying any substantial climbs over the coming days, especially considering the looming political uncertainties.

With volatility comes potential opportunities

Investors who had initially seemed complacent about the above-mentioned downside risks may have to pay the price for their complacency, and brace for potentially more market angst over the coming days. The expected record-high US Q3 GDP due Thursday, with markets forecasting a print of 32 percent, may not be enough to dissuade the bears over the immediate term. Even positive surprises in the ongoing US earnings season may only evoke a fleeting response, with investors likely to focus on the longer-term implications of the US elections and the pandemic.

Still, a shock outcome after November 3rd may present outsized opportunities across broad asset classes, provided investors still have the wherewithal to take advantage of them. However, with market uncertainties running high, perhaps the bias for risk aversion will remain intact over the rest of this week.


Disclaimer: The content in this article comprises personal opinions and should not be construed as containing personal and/or other investment advice and/or an offer of and/or solicitation for any transactions in financial instruments and/or a guarantee and/or prediction of future performance. ForexTime (FXTM), its affiliates, agents, directors, officers or employees do not guarantee the accuracy, validity, timeliness or completeness, of any information or data made available and assume no liability as to any loss arising from any investment based on the same.


Forex-Time-LogoArticle by ForexTime

ForexTime Ltd (FXTM) is an award winning international online forex broker regulated by CySEC 185/12 www.forextime.com

Technical outlook: G10 currencies on standby

By Lukman Otunuga, Research Analyst, ForexTime

Anyone else feeling a strong sense of anticipation mounting across FX markets as the US Presidential election looms?

Over the past few weeks, most major currencies (excluding the Pound) have struggled for direction as investors remained on the side-lines ahead of the massive risk event on November 3rd.

According to Polls, Democrat challenger Joe Biden is currently leading Donald Trump. Whatever the outcome, the US election result will certainly have a lasting impact on currency markets.

Since most major currencies have found comfort within tight ranges, this may present some technical breakout/down opportunities in November.

Today, we will be focusing on the weekly charts for our technical setups are the setups discussed are longer term.

EURUSD yearns for freedom

Looking at the EURUSD on the weekly channel, it resembles a caged beast that yearns for freedom.

Minor support can be found around 1.1700 and minor resistance around 1.1190. Significant levels of interest remain around the 1.1610 higher low and 1.2000 psychological resistance. Prices remain bullish on the weekly timeframe as long as the 1.16100 proves to be reliable support. Should the EURUSD break above 1.1900 and attack 1.2000, this may open the doors towards levels not seen since April 2018 around 1.2250.

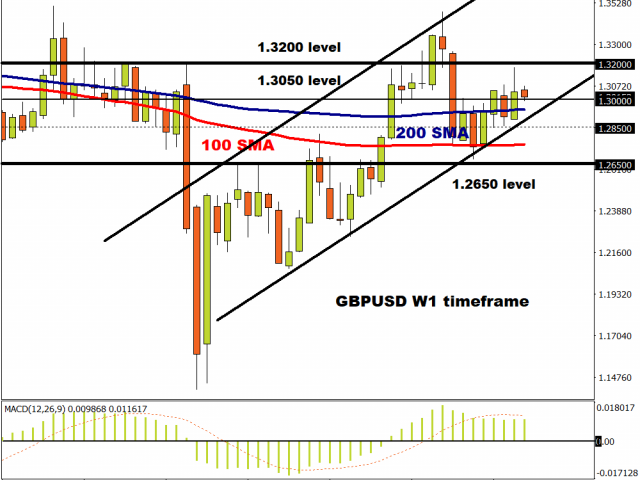
GBPUSD remains in an uptrend

Despite all the gloom, doom and drama around Brexit, the GBPUSD still remains in an uptrend on the weekly charts. There is a suspicion that the positive Pound’s performance could be attributed to Dollar weakness. However, technicals are suggesting that bulls remain in control as long as prices can keep above the 1.2650 support level.

Last week the Pound was injected with a renewed dosage of confidence as fears of a no-deal Brexit slightly eased on encouraging comments from the EU’s chief negotiator. Looking ahead, the GBPUSD could extend its tentacles back towards 1.3200 if 1.3000 proves to be reliable support.

However, a breakdown below 1.3000 may open the doors back towards 1.2850 and 1.2650, respectively.

USDJPY breakdown in the making?

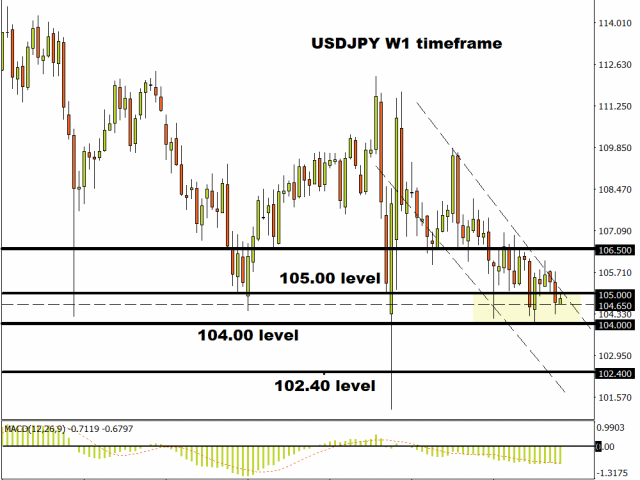
It is safe to say that the USDJPY remains in a downtrend on the weekly charts as there have been consistently lower lows and lower highs. Over the past few weeks, it has been the same old story with the currency pair oscillating within a range. However, prices are slowing approaching a significant support level that could open the doors to further downside.

A solid weekly close below 104.00 could trigger a selloff towards 102.40. However, should prices break back above 105.00, the USDJPY has the potential to rally back towards 106.50.

It must be kept in mind that due to the nature of the Japanese Yen as a safe-haven currency, its outlook may be influenced by the US Presidential election on November 3rd.

AUDUSD descending triangle…

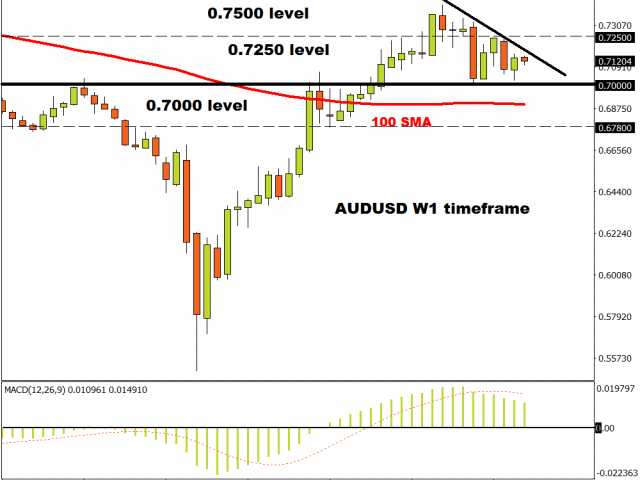
A descending triangle technical formation can be seen on the weekly timeframe.

If the 0.7000 proves to be unreliable support, this could signal a decline towards 0.6780. A breakout above 0.7250 may signal a move towards the 0.7500 level.

Disclaimer: The content in this article comprises personal opinions and should not be construed as containing personal and/or other investment advice and/or an offer of and/or solicitation for any transactions in financial instruments and/or a guarantee and/or prediction of future performance. ForexTime (FXTM), its affiliates, agents, directors, officers or employees do not guarantee the accuracy, validity, timeliness or completeness, of any information or data made available and assume no liability as to any loss arising from any investment based on the same.


Forex-Time-LogoArticle by ForexTime

ForexTime Ltd (FXTM) is an award winning international online forex broker regulated by CySEC 185/12 www.forextime.com