Forex Technical Analysis & Forecast 07.12.2020

Article By RoboForex.com

EURUSD, “Euro vs US Dollar”

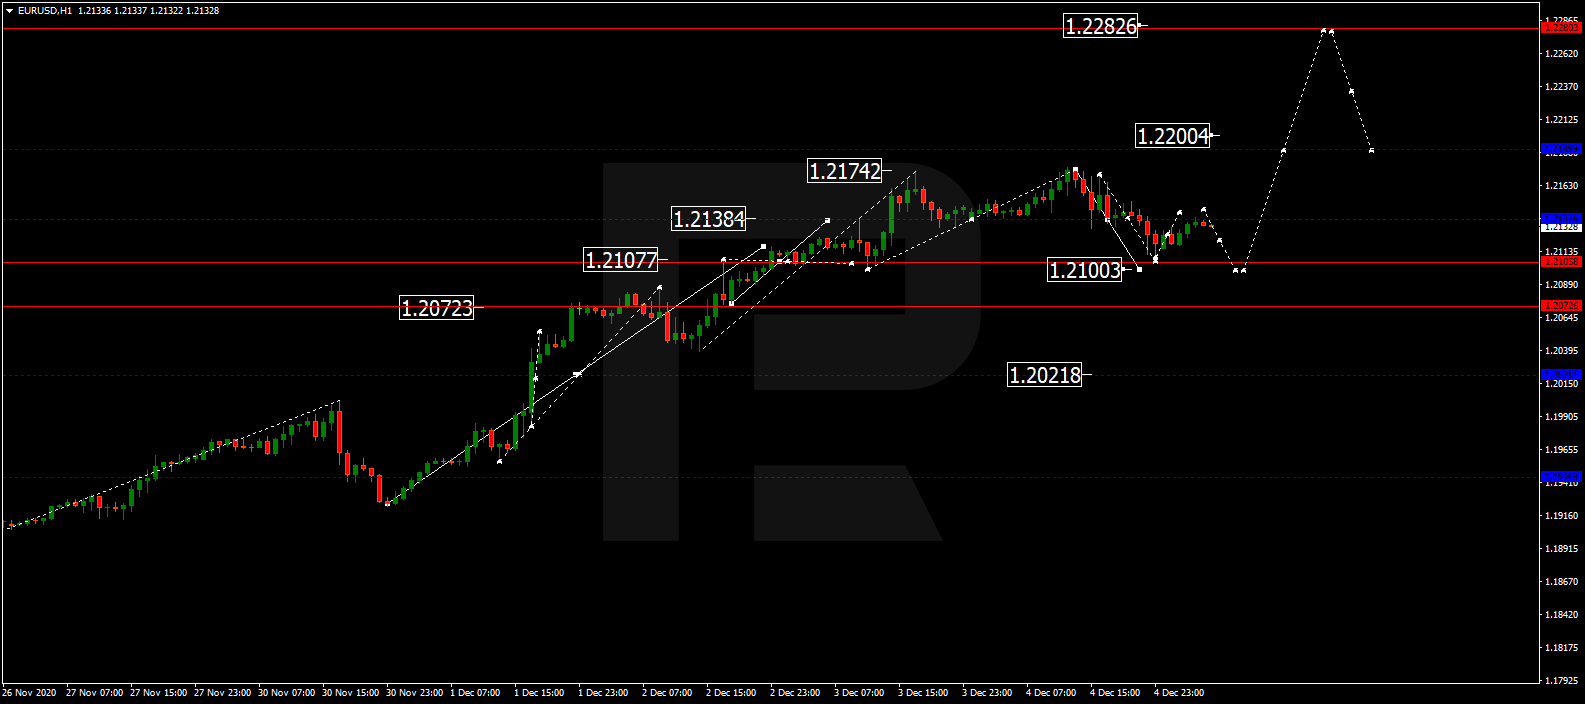
The currency pair has performed another matrix of growth towards 1.2175. Today, we expect a correction to 1.2100 to develop; when this level is reached, we will expect growth to 1.2140. At these levels, a consolidation range might develop. If the pair escapes it upwards, it might proceed to 1.2200. With an escapes downwards, the correction might continue to 1.2020.

EURUSD
Risk Warning: the result of previous trading operations do not guarantee the same results in the future

GBPUSD, “Great Britain Pound vs US Dollar”

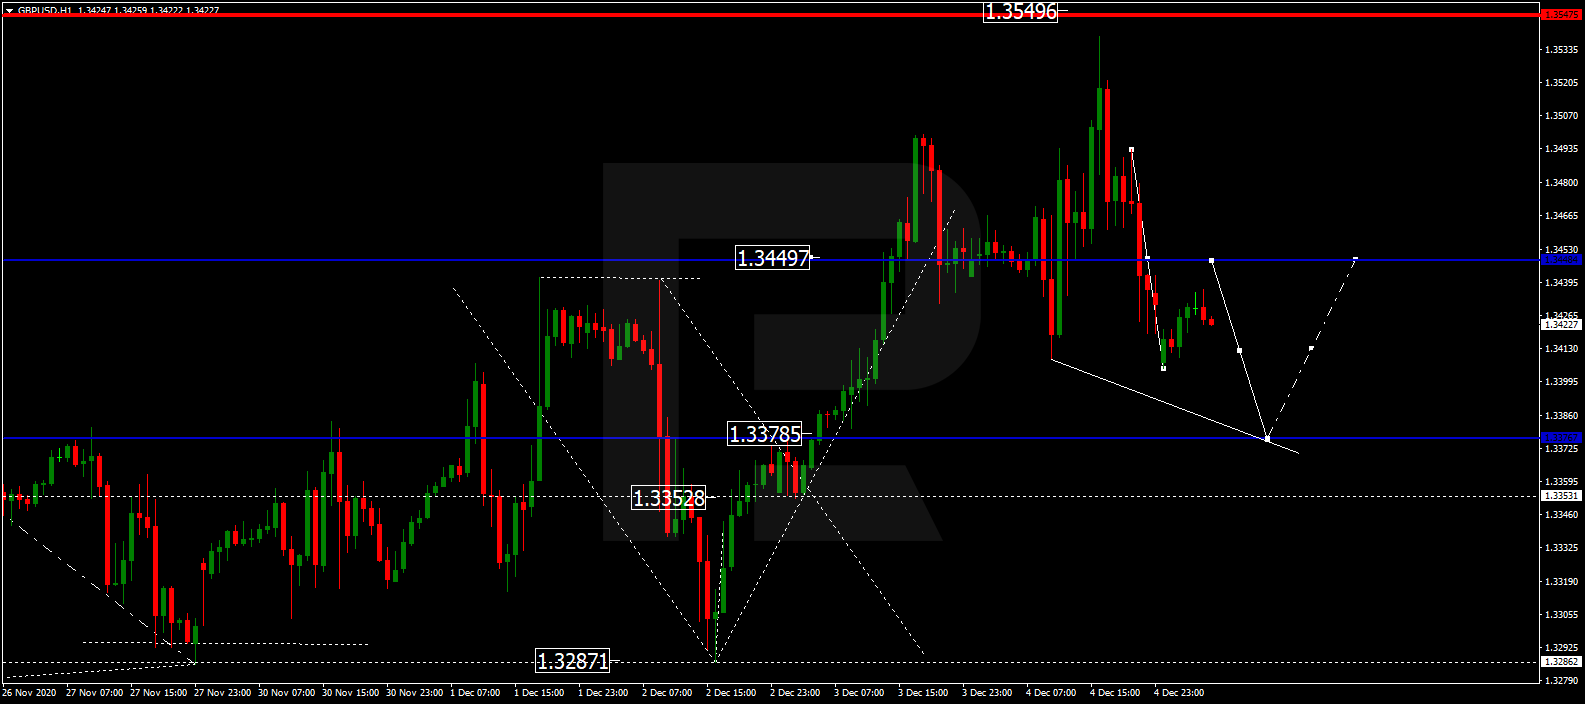
The currency pair bounced off 1.3400 and completed another matrix of growth to 1.3538. Today, the market is correcting to 1.3380. After this level is hit, we expect a link of growth to 1.3450. At these levels, a consolidation range might form. If it is escaped downwards, the correction might continue to 1.3290. With an escape upwards, the pair might grow to 1.3550.
GBPUSD
Risk Warning: the result of previous trading operations do not guarantee the same results in the future

USDRUB, “US Dollar vs Russian Ruble”

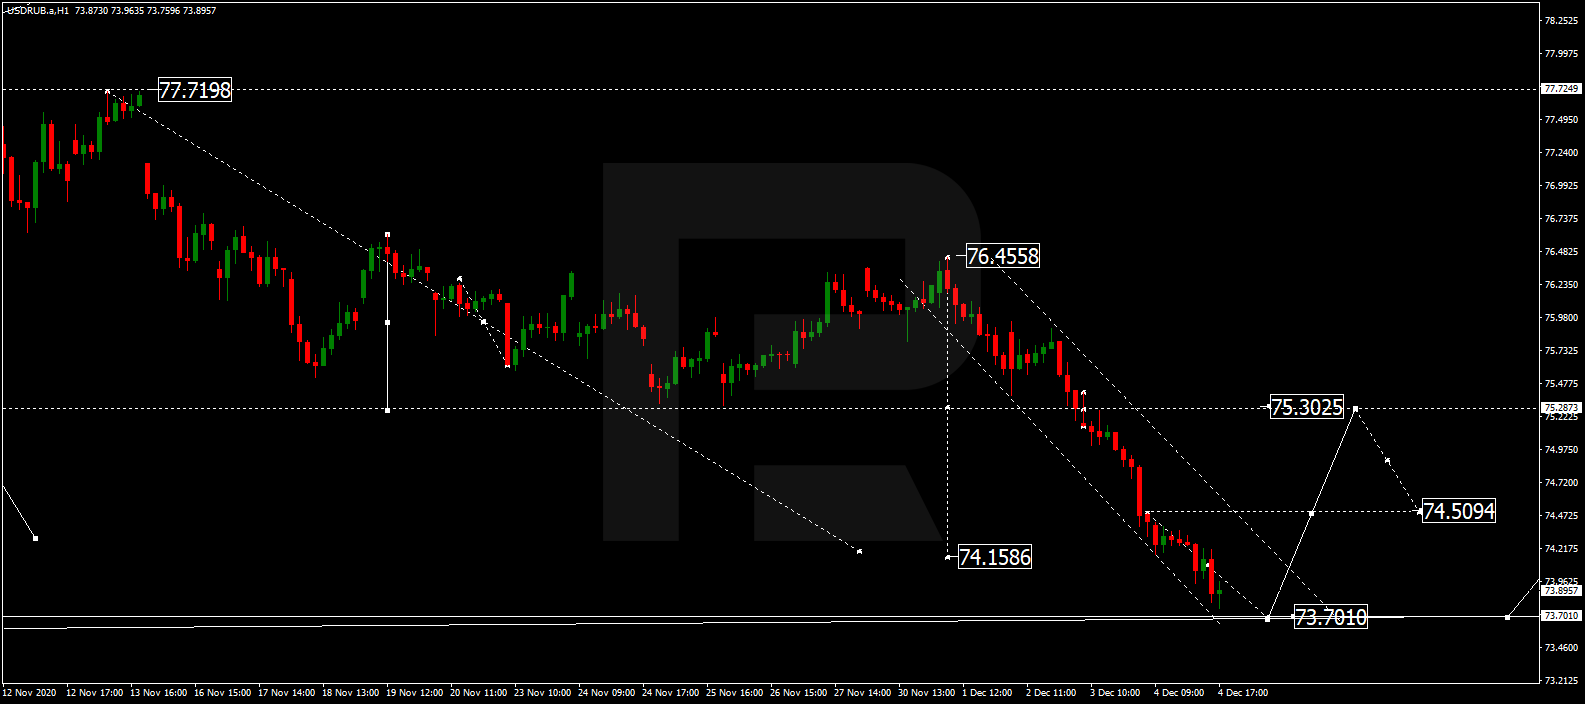
The currency pair keeps developing a wave of decline. Today, it might reach below 73.70. Then a consolidation range might form at the current lows. After an escape upwards, a wave of correction to 75.20 might start. The goal is first.
USDRUB
Risk Warning: the result of previous trading operations do not guarantee the same results in the future

USDJPY, “US Dollar vs Japanese Yen”

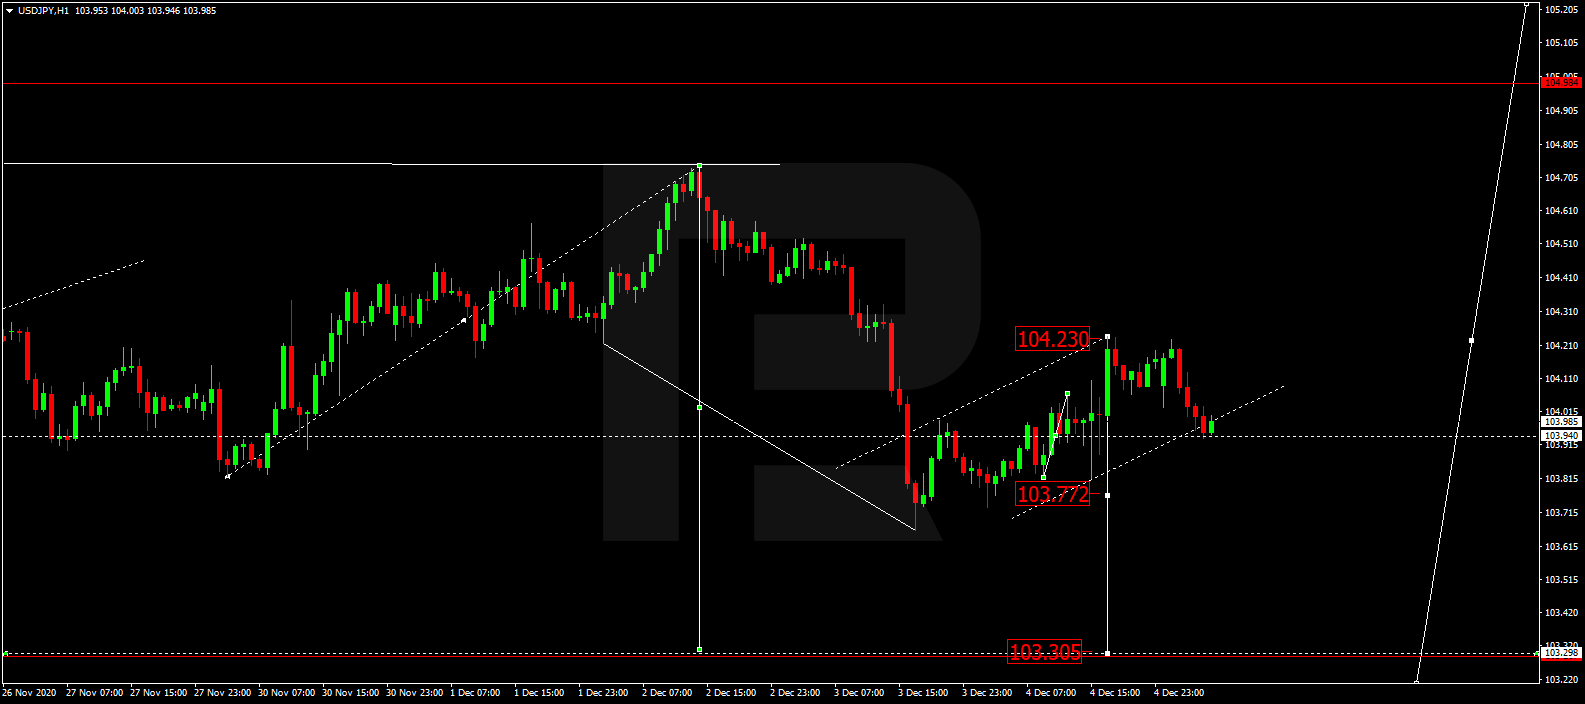
The currency pair keeps developing a consolidation range around 103.90. The main scenario presumes a decline to 103.77. With a breakaway downwards, the decline might continue to 103.30. The goal is local. Then the pair might turn to growth to 104.00 and then – decline to 102.50. The goal is main.
USDJPY
Risk Warning: the result of previous trading operations do not guarantee the same results in the future

USDCHF, “US Dollar vs Swiss Franc”

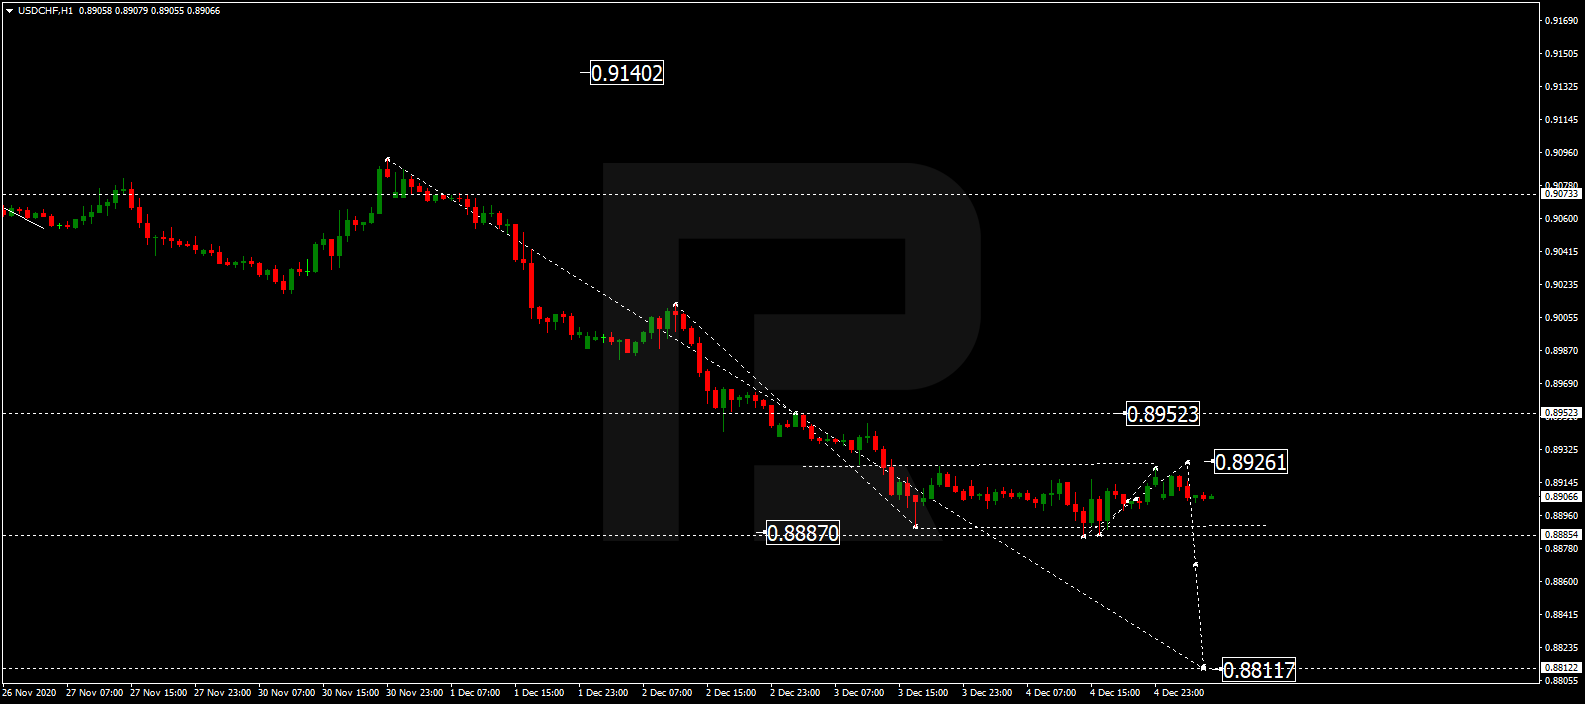
The currency pair is forming a consolidation range above 0.8888. We expect it to extend to 0.8926. Then the pair might decline to 0.8880. With a breakaway of this level, it might proceed to 0.8811.
USDCHF
Risk Warning: the result of previous trading operations do not guarantee the same results in the future

AUDUSD, “Australian Dollar vs US Dollar”

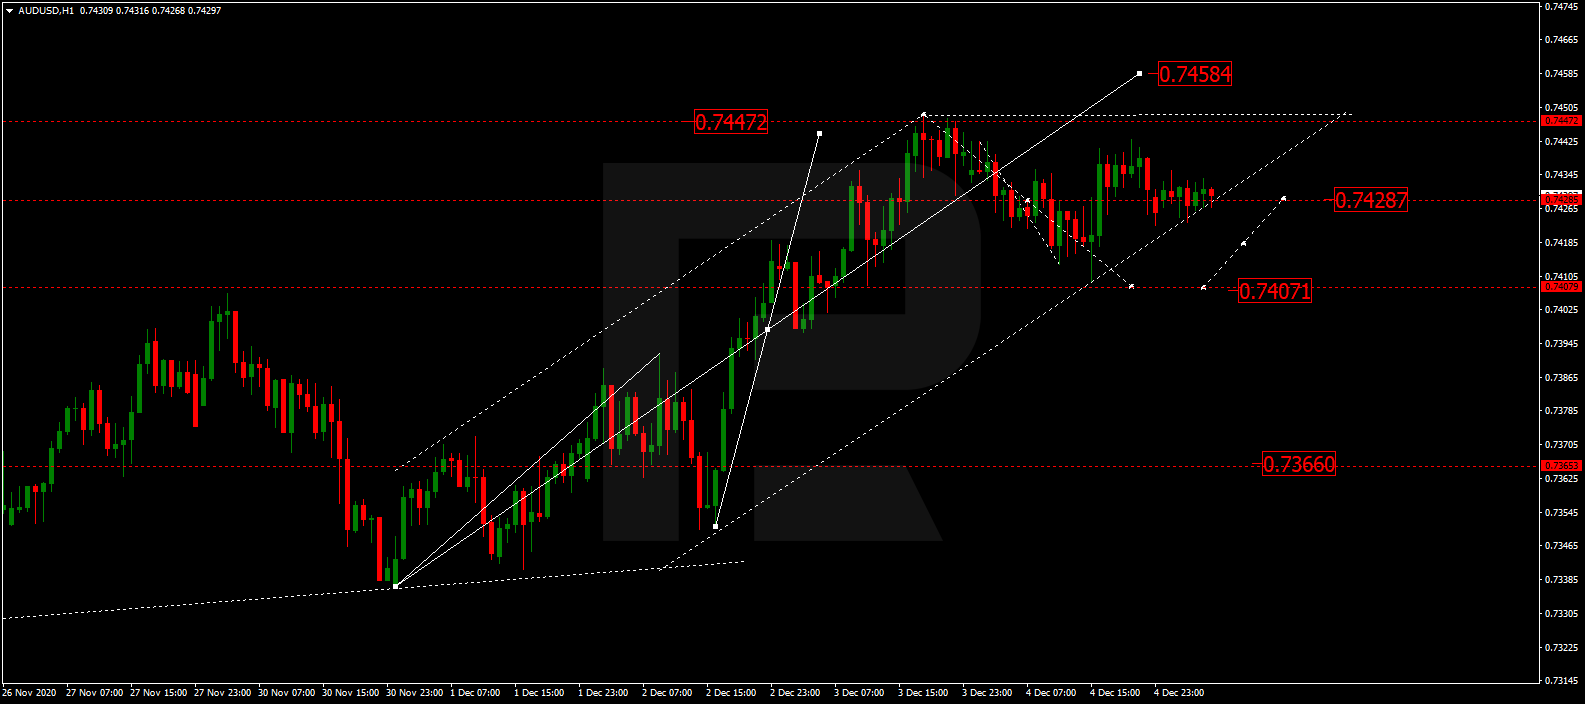
The currency pair keeps correcting to 0.7407. Upon reaching this level, we expect a link of growth to 0.7428. At these levels, we expect a consolidation range to form. With an escape upwards, the quotations might grow to 0.7458. With an escape downwards, the correction might continue to 0.7366.
AUDUSD
Risk Warning: the result of previous trading operations do not guarantee the same results in the future

BRENT

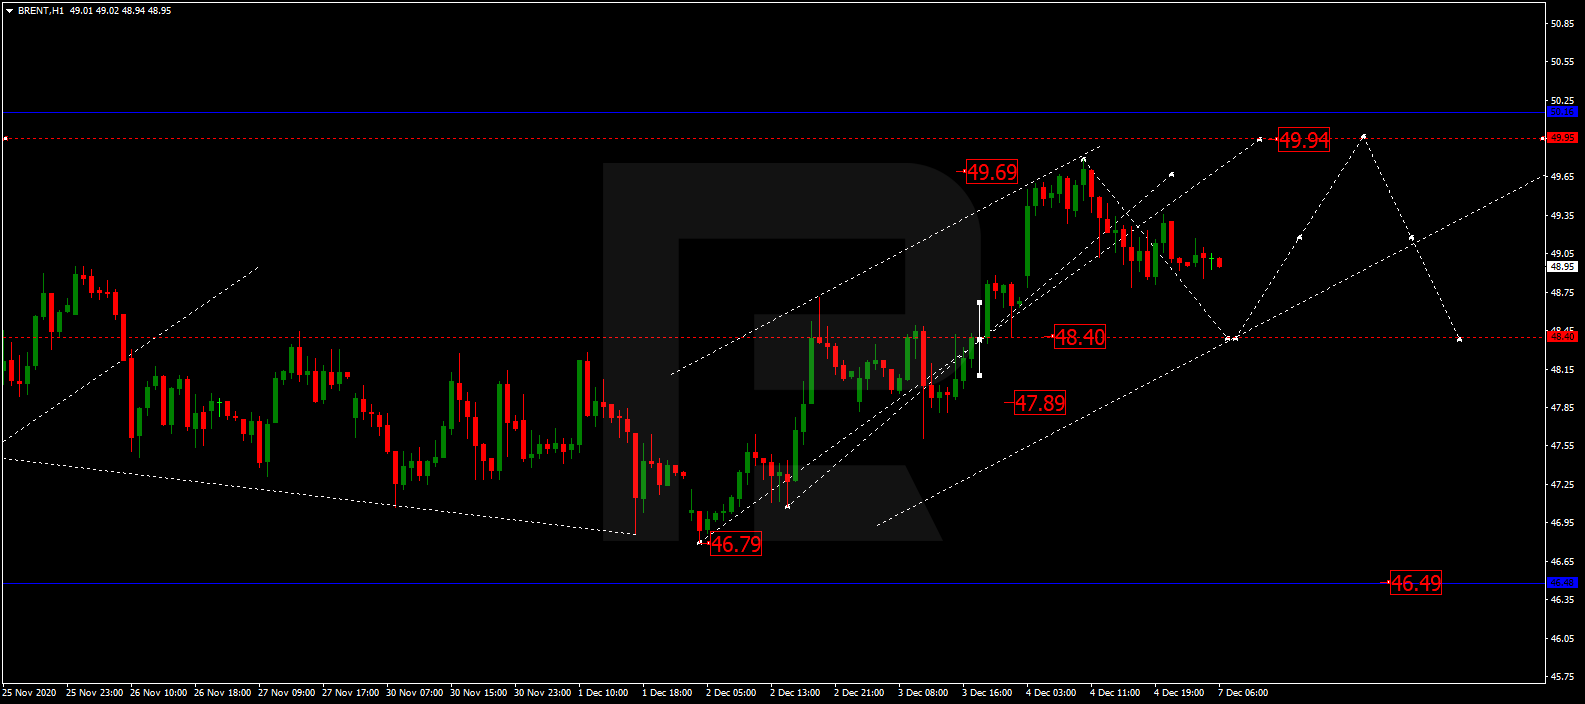
Oil completed another wave of growth, reaching over 49.79. Today, the market is forming a correction to 48.40. After the correction is over, we expect another wave of growth to 49.94. Here, the wave of growth should be over. Then a wave of decline to 46.46 might start. The goal is first.
BRENT
Risk Warning: the result of previous trading operations do not guarantee the same results in the future

XAUUSD, “Gold vs US Dollar”

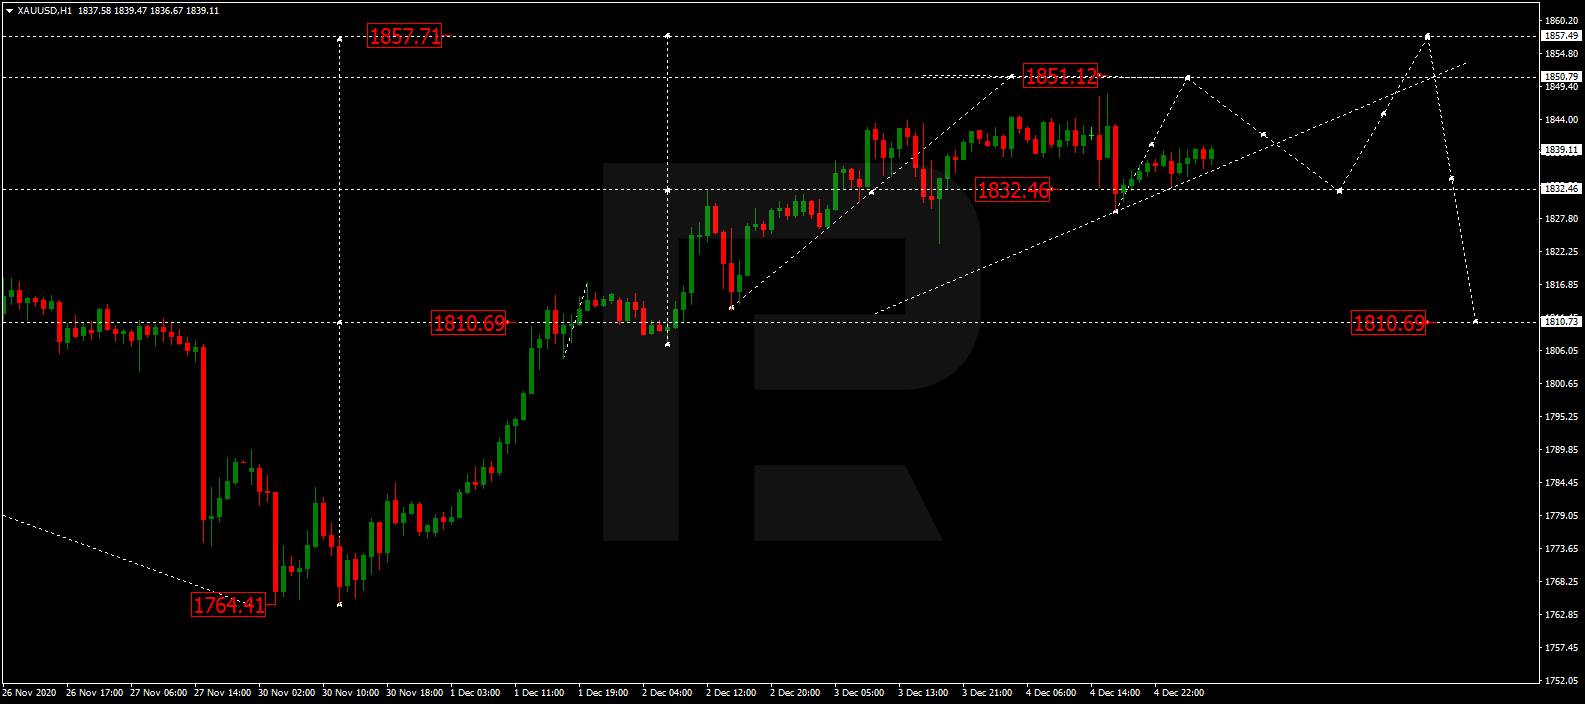
Gold keeps developing a wave of growth to 1851.11. Then we expect a correction to 1832.46. After the correction is over, growth to 1857.70 might begin. The goal is first. After this level is reached, correction to 1810.70 might start.
GOLD
Risk Warning: the result of previous trading operations do not guarantee the same results in the future

BTCUSD, “Bitcoin vs US Dollar”

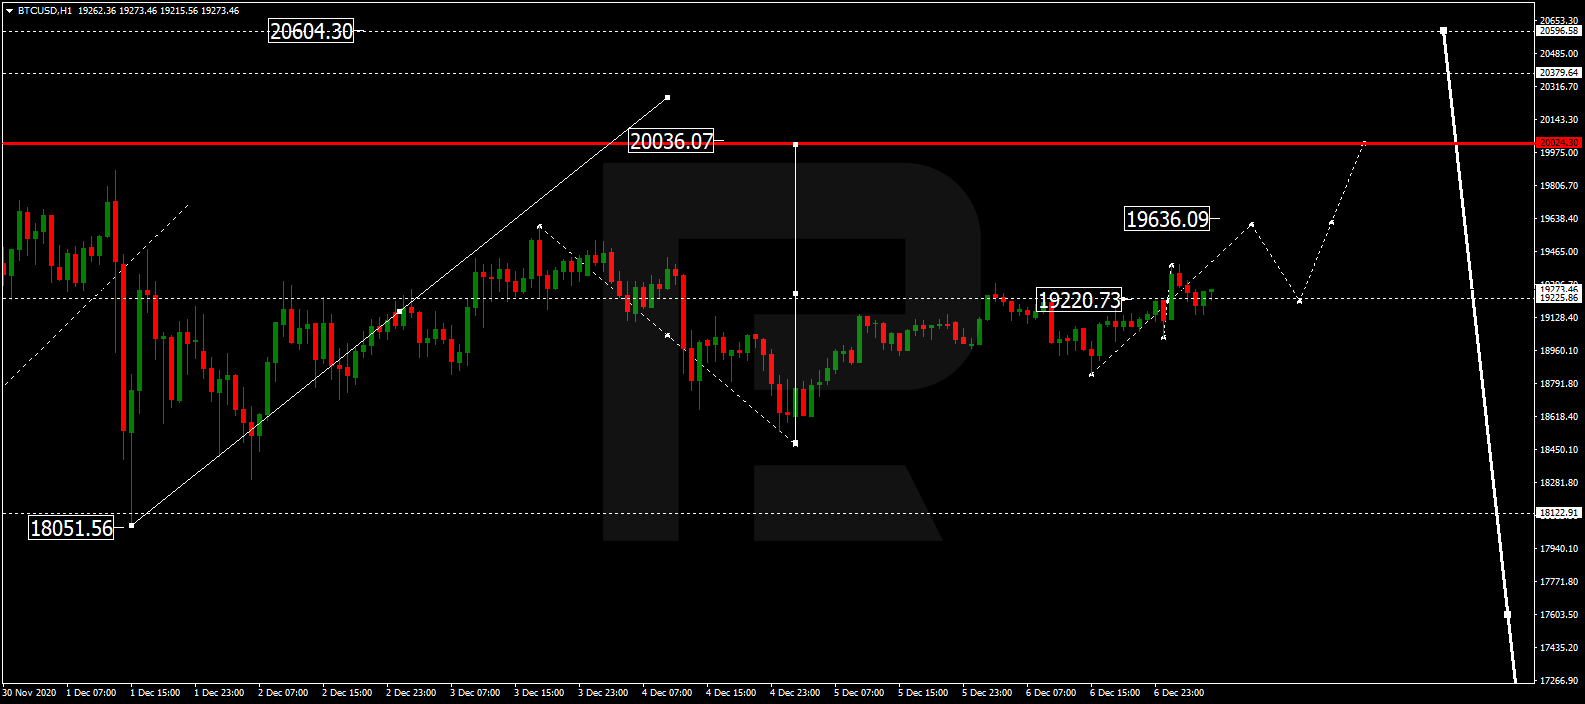
The market is trading in a consolidation range around 19,220. With an escape upwards, the price might leap up to 19,650. With an escape downwards, it might decline to 18,200. Then we expect growth to 20,000.
BITCOIN
Risk Warning: the result of previous trading operations do not guarantee the same results in the future

S&P 500

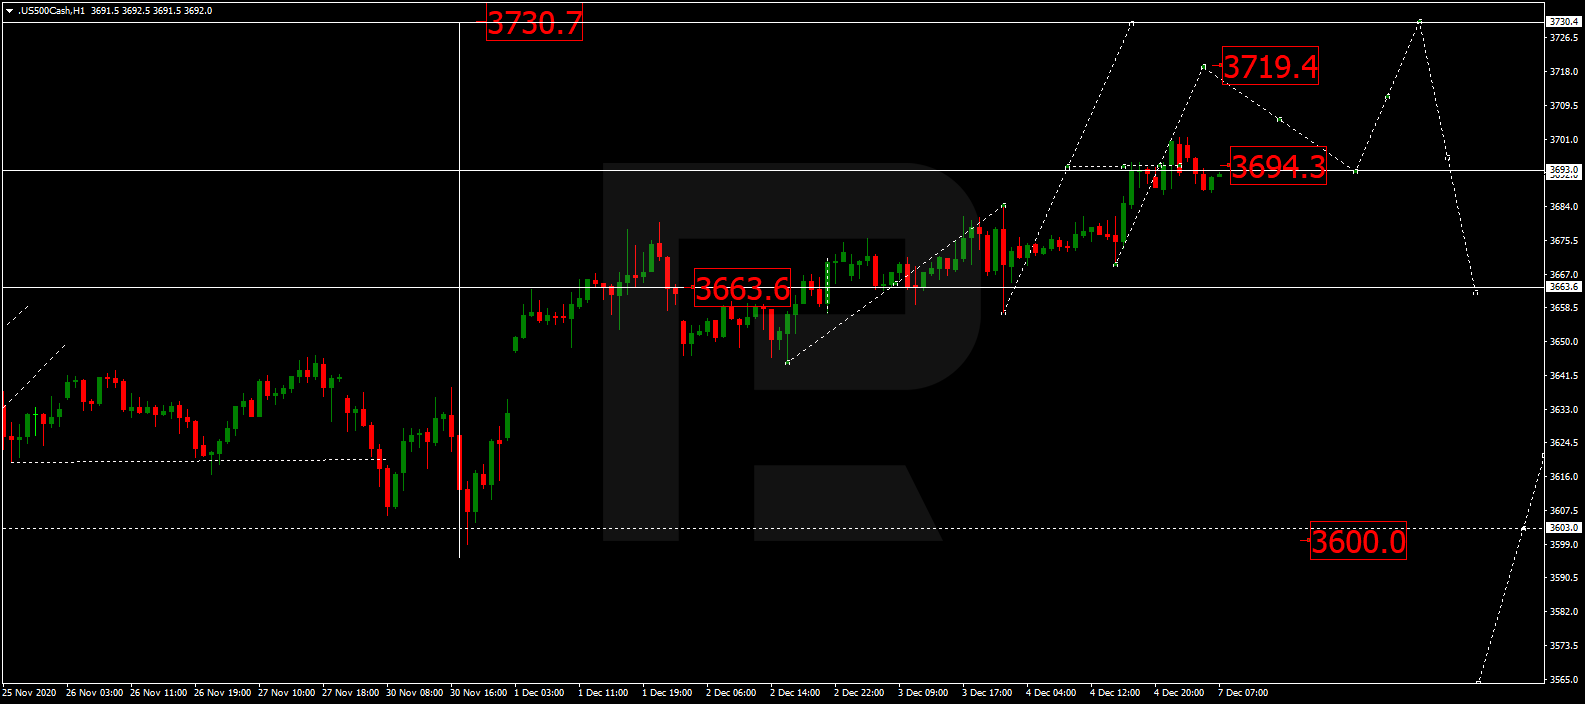
The stock index is trading in a consolidation range around 3694.0. With an escape from the range upwards, the price might proceed to 3719.4. Then a link of correction to 3394.0 might follow. After the correction is over, we expect growth to 3730.7.
S&P 500

Article By RoboForex.com

Attention!
Forecasts presented in this section only reflect the author’s private opinion and should not be considered as guidance for trading. RoboForex LP bears no responsibility for trading results based on trading recommendations described in these analytical reviews.

The Analytical Overview of the Main Currency Pairs on 2020.12.07

by JustForex

The EUR/USD currency pair

Technical indicators of the currency pair:
  • Prev Open: 1.2141
  • Prev Close: 1.2119
  • % chg. over the last day: -0.18%

On Friday, EUR/USD was traded in a downtrend and showed -0.18%. An uptrend is observed on the chart, which indicates the predominance of purchases on this asset. On the hourly timeframe, the price is being traded above the moving average MA 200. On the H4 timeframe, the situation is similar. The MACD indicator is currently in the negative zone on H1. Based on the above, it is worth considering only buy positions while the price is above MA 200 on H1.

Trading recommendations
  • Support levels: 1.2100,1.2039,1.2000
  • Resistance levels: 1.2173

The main scenario for trading EUR/USD is looking to buy entry points. Now the currency pair is making a correction. It is best to look for buy entry points when the price rolls back to the trend line or to the level of 1.2039. With the opening of long positions, quotes can reach the level of 1.2173. If the price can break through and fix above the level of 1.2173, quotes may go to 1.2200. It is also worth noting that divergence is observed on the H1 timeframe, which may signal the beginning of a pair correction.

Alternative scenario: if the price fixes below the level of 1.2039 on the H1 timeframe and below MA 200 on the H1, the currency pair may decline to the level of 1.2000.

EUR/USD
News feed for 2020.12.07:
  • There is no newsfeed for today

The GBP/USD currency pair

Technical indicators of the currency pair:
  • Prev Open: 1.3438
  • Prev Close: 1.3431
  • % chg. over the last day: -0.05%

On Friday, the GBP/USD currency pair was traded within the range 1.3415 – 1.3530 and showed a dynamics of -0.05%. On the hourly chart, GBP/USD is being traded above the moving average MA 200 H1. The situation is similar on the four-hour chart. The MACD indicator is in the negative zone on H1. An uptrend is maintained. Based on the above, it’s probably worth holding to bull trading and as long as the currency pair remains above MA 200 H1, it’s necessary to look for buy entry points.

Trading recommendations
  • Support levels: 1.3398, 1.3287
  • Resistance levels: 1.3439 1.3500, 1.3538

The main scenario: look for buy entry points. Now the pair is making a correction. Buying an asset should be considered at the level of 1.3398, as well as when the price rolls back to the trend line. With the opening of long positions, quotes can go to the level of 1.3500. It is also worth noting that divergence is observed on the MACD on the H1 timeframe. This may signal the beginning of a pair correction.

Alternative scenario: if the price fixes below 1.3398, you can consider selling the asset to the trend line.

GBP/USD
News feed for 2020.12.07:
  • There is no newsfeed for today

The USD/JPY currency pair

Technical indicators of the currency pair:
  • Prev Open: 103.84
  • Prev Close: 104.19
  • % chg. over the last day: +0.33%

On Friday, the USD/JPY currency pair was traded in an uptrend and closed the day with a result of +0.33%. On the hourly chart, the currency pair has fixed below the moving average MA 200. On the four-hour chart, the price is below MA 200. MACD indicator on the H1 is in the positive zone. Based on the above, you can try to look for entry points to sell the asset.

Trading recommendations
  • Support levels: 103.84, 103.65, 103.18
  • Resistance levels: 104.22, 104.75

The main scenario: consider selling an asset. It is best to look for entry points when the price breaks through the level of 103.84 and fixes below it. With the opening of short positions, quotes can go to the level of 103.65.

An alternative scenario assumes consolidation above the level of 104.22 with a subsequent increase to the level of 104.75.

USD/JPY
News feed for 2020.12.07:
  • There is no newsfeed for today

The USD/CAD currency pair

Technical indicators of the currency pair:
  • Prev Open: 1.2858
  • Prev Close: 1.2785
  • % chg. over the last day: -0.57%

Yesterday the USD/CAD currency pair was traded in a downtrend and closed at -0.57%. On the H1 timeframe, USD/CAD is below the moving average MA 200. On the four-hour chart, the price is below the moving average. Based on the above, it is worth considering selling an asset.

Trading recommendations
  • Support levels: 1.2770
  • Resistance levels: 1.2868, 1.2928, 1.2985, 1.3010,1.3091

The main scenario: we recommend considering the sale of an asset. It is best to look for a sell entry point when the price rolls back to the trend line or to the resistance level of 1.2868 when a signal is generated on lower timeframes.

Alternative scenario: if the price can break the trend line and fix above the level of 1.2868, you can consider a buy position to the level of 1.2928.

USD/CAD
News feed for 2020.12.07:
  • – Canada PMI at 17:00.

by JustForex


This article reflects a personal opinion and should not be interpreted as an investment advice, and/or offer, and/or a persistent request for carrying out financial transactions, and/or a guarantee, and/or a forecast of future events.

Weekly Fundamental Bulletin: All Eyes On The ECB Meeting

By Orbex

Last week’s highlights

Australia retail sales rise by 1.4% in October

The latest retail sales data from Australia showed a pickup in activity.

On a seasonally adjusted basis, retail sales on the month rose 1.4% in October. This was shy of the 1.6% forecasts estimated by economists.

On a year over year basis, Australia’s retail sales grew at a pace of 7.1%. Department store sales rose 4.5% on the month while food services involving takeaway service grew 5.4%.

Offsetting the gains was a drop in food retailing which fell 0.1% and household goods which were down by 1.0% on the month.

Eurozone private sector contracts in November

The private sector economy contracted in the Eurozone for the month of November. This was led by a sharp decline in the services sector amid new lockdown measures introduced across Europe.

The data from IHS Markit showed that the final composite output index fell to 45.3 compared to 50.0 in the previous month. The data was, however, slightly higher than the flash estimates.

The services PMI for the Eurozone fell to 41.7 in November, down from 46.9 previously. Based on the results, IHS Markit forecasts that the Eurozone economic growth will likely slow once again.

UK services sector fall less than forecasts

The monthly services sector activity from the UK showed a contraction that was less than the general forecasts.

Data from IHS Markit showed that the services PMI fell to 47.6 in November, down from 51.4 in October. Economists had forecast a reading of 45.8 for the month.

The data suggested that the pace of decline was not as big as initially expected.

The UK’s services sector is hit by the impact of nationwide lockdown measures. This has forced quite a few businesses to close down while some are adapting to the new norms.

The decline in the services sector was the first in over five months.

US ISM manufacturing index falls in November

The latest manufacturing data from the United States, as measured by the Institute for Supply Management showed a decline in activity.

The ISM manufacturing PMI fell to 57.5 in November, down from 59.3 in October. The declines were driven by a drop in the new orders index.

New orders activity fell to 65.1 in November, down from 67.9 in the previous month. The production index also slid from 63.0 in October to 60.8 in November.

US job creation slows in November

The United States economy added 245,000 jobs in November, even as the unemployment rate fell to 6.7%.

The total number of jobs created during November marks a sharp slowdown compared to the 610,000 jobs added in October. The data also fell short of the general forecasts of 480k.

Data for October was revised down from 638k to 610k for the period. The unemployment rate, however, continues to fall for the seventh consecutive month.

Upcoming Economic Events

Japan final GDP to remain unrevised

Japan will be releasing its final GDP revisions for the third quarter period ending September 2020.

No major revisions are expected as Japan’s GDP is forecast to rise by 5.0% during the period. This comes in line with the second revised estimates.

The data is also unlikely to move the markets much as they will be looking to the fourth-quarter GDP results already. Besides the GDP data, a number of other reports are also due.

Average cash earnings are forecast to improve moderately from -0.9% to -0.7% on the year. Household spending is also forecast to improve, rising by 2.5% compared to a -10% decline earlier.

China consumer prices to remain flat in November

The latest monthly consumer and producer prices data from China are due. The general forecasts point to no change on the headline inflation figures.

This comes after China’s consumer price index rose by 0.5% on the year ending October. Producer price data is also due at the same time.

Economists forecast that producer prices fell 1.8% on the year. This marks a slower pace of decline after producer prices fell 2.1% on the year in October.

Bank of Canada to keep rates steady

The Bank of Canada will be holding its monetary policy meeting on Wednesday. No big changes are expected as central bank officials will hold key rates steady.

However, the second wave of the Coronavirus has led to stronger lockdown measures. This could potentially set the BoC to keep a close watch on the exchange rate for the Canadian dollar.

Investors already got a glimpse of this during the October meeting. Furthermore, this week’s meeting will be a statement-only meeting. As a result, no big shocks are expected.

Investors prepare for ECB stimulus announcement

The European Central bank will be holding its key monetary policy meeting this week on Thursday. As widely expected, the central bank will be holding its key interest rates steady.

However, investors are preparing for a fresh new stimulus from the central bank as indicated in the previous monetary policy meeting.

Expectations are that the ECB will announce new stimulus measures which will take QE purchases closer to 1.6 trillion euro. This means that the central bank will be increasing QE by 50 billion.

The bank is also likely to cut its 2020 and 2021 growth forecasts.

By Orbex

Equity rally pauses, Greenback remains on back foot

By Hussein Sayed, Chief Market Strategist (Gulf & MENA), ForexTime

The global equity rally that took the MSCI’s world share index to record highs last week showed signs of weakness on Monday with most stock indices in Asia trading lower. Surging virus cases and a Reuters report signaling the US is preparing new sanctions on Chinese officials due to their role in disqualifying elected legislators in Hong Kong outweighed the positive sentiment driven by vaccine news.

European and US futures are also indicating a negative start for the week, following a record close on the S&P 500 on Friday. Meanwhile, Oil traded slightly lower following a five week rally, after OPEC+ agreed to raise production by 500,000 barrels per day in January which is about a quarter of the planned hike.

Despite the decline in risk assets, there does not seem to be the danger of a sharp pullback. Otherwise, we would have seen some inflows into the safe-haven Dollar. Instead, the Greenback remains under pressure, trading near two and a half year lows. Friday’s non-farm payrolls report came in well short of market expectations, increasing by only 245,000 versus forecasts of 469,000. That represented the smallest gain in jobs since the recovery in the labour market kicked off in May.

While a game changer in the long term, the vaccine deployment won’t be enough to address the stalling recovery over the next few months. Hence, markets are counting on US policymakers to act. Today, a bipartisan group of senators is expected to reveal a $0.9 trillion stimulus package. If Senate majority leader Mitch McConnell allows the legislation to go for a vote, even if the amount is scaled back, that could at least provide an economic bridge until wide scale deployment of the vaccine is applied.

Investors should also keep an eye on how far US Treasury yields climb if a new stimulus package is approved. On Friday, 10-year yields reached 0.99%, the highest since March. If we see a further sharp spike in yields that may impose a risk to the bull market in stocks and this is where the Federal Reserve’s role comes in. They need to assure markets that long term interest rates remain in check and that the Fed is ready to act by increasing purchases of long-term debt.

Elsewhere, Sterling fell to 1.3360 earlier this morning before recouping most of its losses. It is kind of surprising to see the Pound holding firm despite the deep division in UK-EU negotiations. Traders seem confident that the UK will leave the EU with a deal, but from what we learned over the weekend, there remain several sticking points especially towards rules governing future competition and fishing rights. It is important for Sterling bulls to protect their long positions as the upside from here seems limited, but a no-deal scenario could see the currency crash over the next several days.

Disclaimer: The content in this article comprises personal opinions and should not be construed as containing personal and/or other investment advice and/or an offer of and/or solicitation for any transactions in financial instruments and/or a guarantee and/or prediction of future performance. ForexTime (FXTM), its affiliates, agents, directors, officers or employees do not guarantee the accuracy, validity, timeliness or completeness, of any information or data made available and assume no liability as to any loss arising from any investment based on the same.


Forex-Time-LogoArticle by ForexTime

ForexTime Ltd (FXTM) is an award winning international online forex broker regulated by CySEC 185/12 www.forextime.com

An end to EURUSD’s 1,500 pip rise?

By Admiral Markets

economic announcements

A screenshot of this week’s economic announcements, taken directly from the MetaTrader 5 trading platform provided by Admiral Markets.

EURUSD – An end to a 1,500 pip rally?

EURUSD, Daily

Source: Admiral Markets MetaTrader 5, EURUSD, Daily – Data range: from Feb 24, 2020, to Dec 6, 2020. Performed on Dec 6, 2020, at 10:00 pm GMT. Please note: Past performance is not a reliable indicator of future results.

Past five-year performance: 2019 = -2.21%, 2018 = -4.47%, 2017 = +14.09%, 2016 = -3.21%, 2015 = -10.18%.

Since the low of the year at 1.0636 (dashed-horizontal blue line) recorded on 19 March 2020, EURUSD has rallied more than 1,500 pips higher. This has led to the 50-period (red line), 100-period (green line) and 200-period (blue line) exponential moving averages all pushing higher to confirm the uptrend.

However, the price now sits at the 1.272 Fibonacci overextension level of circa. 1.2132 – taken from the swing high of September 1 at 1.2016 to the swing low of November 4 at 1.1602 (as shown by the diagonal red line and subsequent Fibonacci lines.

The combination of a European Central Bank stimulus on Thursday may cause traders to rethink adding positions at these overextension levels with pullbacks towards the 1.2000 level interesting areas for buyers.

  • Traders may opt to look for potential reversal patterns to identify clues of buyers exiting and sellers stepping in. Learn more in the ‘Price Action Trading Strategies‘ article.

GBPUSD – Approaching key resistance at a key time

GBPUSD, Daily

Source: Admiral Markets MetaTrader 5, GBPUSD, Daily – Data range: from Jul 5, 2019, to Dec 6, 2020. Performed on Dec 6, 2020, at 10:10 pm GMT. Please note: Past performance is not a reliable indicator of future results.

Past five-year performance: 2019 = +3.95%, 2018 = -5.54%, 2017 = +9.43%, 2016 = -16.26%, 2015 = -5.38%.

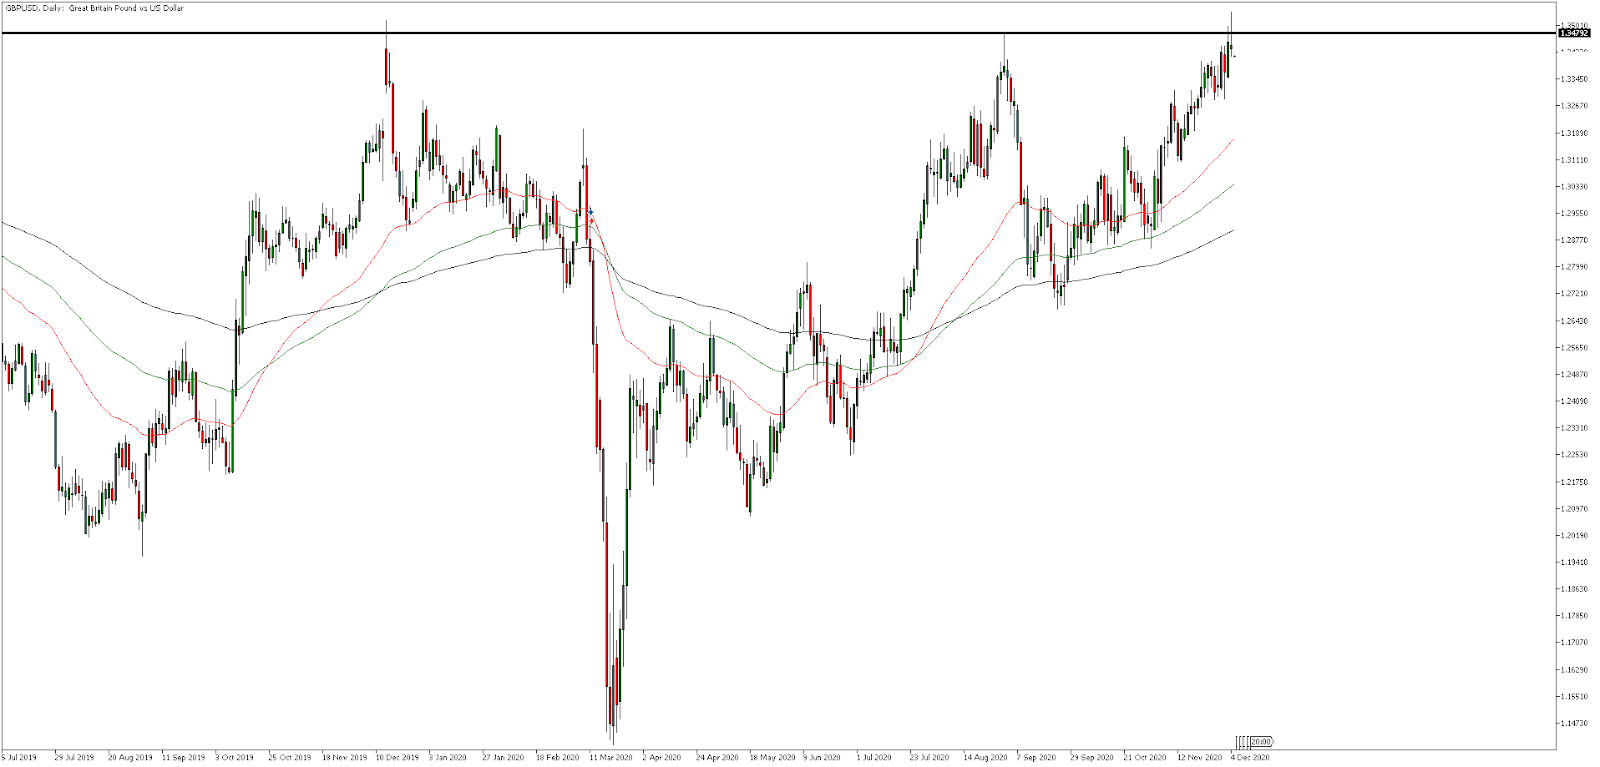
The GBPUSD has finally reached its significant level of horizontal resistance at circa. 1.3479, as denoted by the black horizontal line on the chart. Buyers have found it difficult to break through this price level in the past with sellers turning up in November 2019 and September 2020.

With roadblocks still remaining in UK and EU trade negotiations, buyers may consider taking some profits at these levels to hedge against a possible no-deal scenario. It may be too early to suggest if sellers will step in just yet, as it will be dependent on whether the UK can secure a trade deal with the EU or not.

  • Traders may opt to look for potential chart pattern formations such as double tops for clues on a reversal. If a trade deal is announced, breakout strategies may then become useful. Learn more in the ‘Trading Strategies Guide

Did you know that you can use the Trading Central Technical Ideas Lookup indicator to find actionable trading ideas on this index and thousands of other instruments across Forex, stocks, indices, commodities and more?

You can get this indicator completely FREE by upgrading your MetaTrader 5 trading platform provided by Admiral Markets UK Ltd to the exclusive Admiral Markets Supreme Edition! You’ll also receive a whole range of advanced trading tools such as correlation and sentiment indicators!

Start your free download by clicking on the banner below:

Download MetaTrader 5 Supreme Edition

INFORMATION ABOUT ANALYTICAL MATERIALS:

The given data provides additional information regarding all analysis, estimates, prognosis, forecasts, market reviews, weekly outlooks or other similar assessments or information (hereinafter “Analysis”) published on the website of Admiral Markets. Before making any investment decisions please pay close attention to the following:

1.This is a marketing communication. The content is published for informative purposes only and is in no way to be construed as investment advice or recommendation. It has not been prepared in accordance with legal requirements designed to promote the independence of investment research, and that it is not subject to any prohibition on dealing ahead of the dissemination of investment research.

2.Any investment decision is made by each client alone whereas Admiral Markets UK Ltd (Admiral Markets) shall not be responsible for any loss or damage arising from any such decision, whether or not based on the content.

3.With view to protecting the interests of our clients and the objectivity of the Analysis, Admiral Markets has established relevant internal procedures for prevention and management of conflicts of interest.

4.The Analysis is prepared by an independent analyst Jitan Solanki, Freelance Contributor (hereinafter “Author”) based on personal estimations.

5.Whilst every reasonable effort is taken to ensure that all sources of the content are reliable and that all information is presented, as much as possible, in an understandable, timely, precise and complete manner, Admiral Markets does not guarantee the accuracy or completeness of any information contained within the Analysis.

6.Any kind of past or modelled performance of financial instruments indicated within the content should not be construed as an express or implied promise, guarantee or implication by Admiral Markets for any future performance. The value of the financial instrument may both increase and decrease and the preservation of the asset value is not guaranteed.

7.Leveraged products (including contracts for difference) are speculative in nature and may result in losses or profit. Before you start trading, please ensure that you fully understand the risks involved.

By Admiral Markets

Last-ditch Deals: Euro enters week on knife’s edge

By Han Tan, Market Analyst, ForexTime

The Euro enters the new trading week with deadlines over two crucial deals hanging over its head.

Monday marks the deadline for the EU members must agree to the US$ 2.2 trillion stimulus and budget deal. Separately, negotiations over a post-Brexit trade deal between the UK and the EU are widely expected to conclude this week (no, but for real this time).

EU staring at political and financial paralysis

Let’s start with the EU’s recovery fund, which is facing political resistance from Hungary and Poland. These two non-euro members have threatened to veto plans to roll out US$ 2.2 trillion worth of financial plans for EU members to help cope with the pandemic.

If invoked, it could force the EU into operating on emergency monthly budgets as of January, as opposed to being able to roll out the full array of government financial support in a time of deep economic pain. In other words, the political deadlock could choke the EU from some much-needed funds, at a time when the continent needs more, not less, fiscal support.

Yet, markets appear relatively sanguine about such negative risks for the EU. The Euro is gaining against most of its G10 peers on Monday, while EURUSD is holding around its highest levels since April 2018. The FXTM Trader’s Sentiments remains net long on this currency pair.


Frantic Monday for Brexit negotiators

Then there’s the well-documented drama surrounding Brexit. The UK and EU are hoping that a post-Brexit trade deal can be secured by today, with both sides looking to reach a compromise over key sticking points, such as access to British fishing waters. Adding to the complications is France’s threat to veto the deal if it’s not to its liking.

Note that the 31st December deadline Brexit is set in stone; the UK will leave the EU starting 2021.

The question now is whether these two heavily-intertwined economies can seal a deal which cushions the ensuing economic fallout in the post-Brexit era. The UK economy is forecasted to suffer see a GDP decline of 1.5 – 2 percent in the event of a no-deal Brexit, while Bank of England officials have warned that a hard Brexit could have a more lasting impact on UK businesses and economy compared to the pandemic.

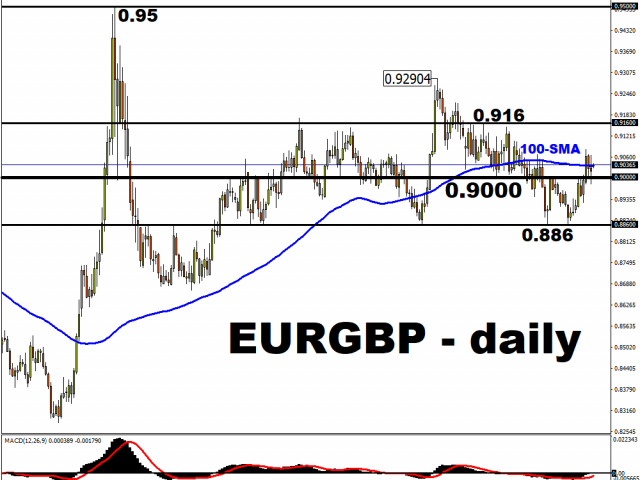
The uncertainty has kept EURGBP mostly within the 0.886 – 0.916 range it has adhered to since May, with the pair now trading close to its 100-day simple moving average. The FXTM Trader’s Sentiments are 75 percent short on this currency pair, which indicates the underlying belief that the Pound has potential for more upside against the Euro in the event of a post-Brexit trade deal.


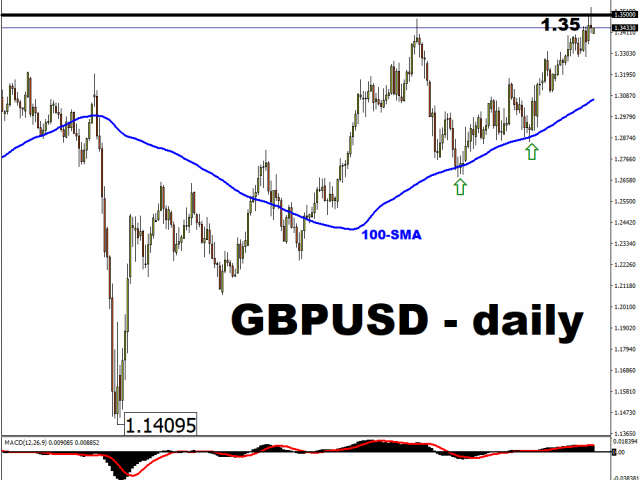
Though such risks haven’t deterred the Pound from taking advantage of the weaker US Dollar, with GBPUSD attempting to carve out a sustained presence above the 1.35 long-term resistance level. The FXTM Trader’s Sentiments are net long on cable, on account of the weaker Dollar environment and baked-in expectations for a positive conclusion to talks surrounding the post-Brexit trade deal.

Dec 10: Look out for two-day EU summit, ECB decision

Both the EU’s recovery package and also the post-Brexit trade deal are set to feature prominently at the two-day summit for EU leaders beginning 10 December. Ideally, agreements can be sealed on both fronts to be brought before the EU summit this week.

Should both major risks be resolved, that could go a long way in ensuring the efficacy of the ECB’s additional policy stimulus, which is widely expected to be rolled out at its 10 December meeting.

Otherwise, there could be chaos surrounding European assets. The Euro and the Pound could then face major bouts of volatility as investors reprice the economic outlooks for the EU and the UK.

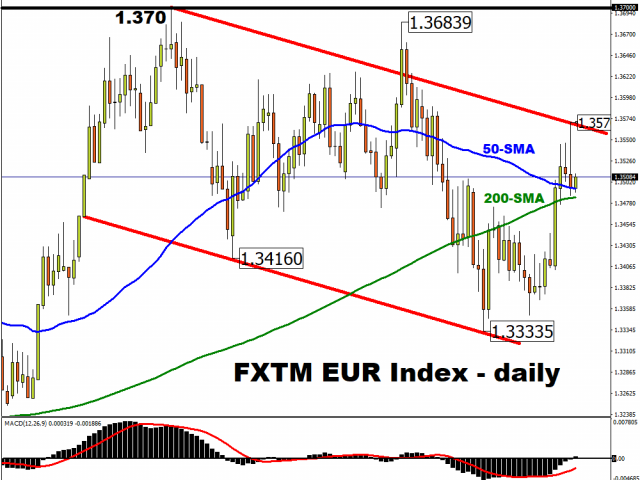
The FXTM EUR Index could also do with a picker-upper, or risk a ‘death cross’ forming on the daily chart, with its 50-day simple moving average (SMA) closing in on its 200-day counterpart.


Disclaimer: The content in this article comprises personal opinions and should not be construed as containing personal and/or other investment advice and/or an offer of and/or solicitation for any transactions in financial instruments and/or a guarantee and/or prediction of future performance. ForexTime (FXTM), its affiliates, agents, directors, officers or employees do not guarantee the accuracy, validity, timeliness or completeness, of any information or data made available and assume no liability as to any loss arising from any investment based on the same.


Forex-Time-LogoArticle by ForexTime

ForexTime Ltd (FXTM) is an award winning international online forex broker regulated by CySEC 185/12 www.forextime.com

US Dollar Index Speculators added to their bearish bets this week

US Dollar Index Speculator Positions

Large currency speculators edged their bearish net positions slightly higher in the US Dollar Index futures markets this week, according to the latest Commitment of Traders (COT) data released by the Commodity Futures Trading Commission (CFTC) on Friday.

The non-commercial futures contracts of US Dollar Index futures, traded by large speculators and hedge funds, totaled a net position of -3,075 contracts in the data reported through Tuesday December 1st. This was a weekly decrease of -321 contracts from the previous week which had a total of -2,754 net contracts.

This week’s net position was the result of the gross bullish position (longs) gaining by 4,061 contracts (to a weekly total of 23,708 contracts) but being more than offset by the gross bearish position (shorts) which rose by 4,382 contracts on the week (to a total of 26,783 contracts).

The US Dollar Index speculators raised their bearish bets for a second straight week and for the third time in the past four weeks this week. The Dollar Index spec position has now been in bearish territory for four straight weeks after rising to a small bullish position on November 3rd. Overall, the Dollar position has now been in a bearish standing for twenty-three out of the past twenty-five weeks, dating back to early June when the streak of 109 consecutive weeks of dollar bullish positions ended.


Individual Currencies Data this week:

In all of the individual contracts data, the major currencies that saw improving speculator positions this week were the euro (1,644 weekly change in contracts), British pound sterling (9,231 contracts), Japanese yen (7,261 contracts), New Zealand dollar (746 contracts) and the Mexican peso (5,246 contracts).

The currencies whose speculative bets declined this week were the US dollar index (-321 weekly change in contracts), Swiss franc (-335 contracts), Canadian dollar (-4,397 contracts) and the Australian dollar (-5,523 contracts).


Chart: Current Strength of Each Currency compared to their 3-Year Range

The above chart depicts each currency’s current speculator strength level compared to data of the past 3 years. A score of 0 percent would mean speculator bets are currently at the lowest level of the past three years. A 100 percent score would be at the highest level while a 50 percent score would mean speculator bets are right in the middle of the data (a neutral score). We use above 80 percent (extreme bullish) and below 20 percent (extreme bearish) as extreme score measurements.

Please see the data table and individual currency charts below.


Table of Large Speculator Levels & Weekly Changes:

CurrencyNet Speculator PositionSpecs Weekly Change
USD Index-3,075-321
EuroFx139,8941,644
GBP-7,8999,231
JPY47,5037,261
CHF14,651-335
CAD-21,243-4,397
AUD-10,800-5,523
NZD9,058746
MXN29,0415,246

This latest COT data is through Tuesday and shows a quick view of how large speculators or non-commercials (for-profit traders) were positioned in the futures markets. All currency positions are in direct relation to the US dollar where, for example, a bet for the euro is a bet that the euro will rise versus the dollar while a bet against the euro will be a bet that the dollar will gain versus the euro.


Weekly Charts: Large Trader Weekly Positions vs Price

EuroFX:

The Euro large speculator standing this week equaled a net position of 139,894 contracts in the data reported through Tuesday. This was a weekly increase of 1,644 contracts from the previous week which had a total of 138,250 net contracts.


British Pound Sterling:

The large British pound sterling speculator level came in at a net position of -7,899 contracts in the data reported this week. This was a weekly gain of 9,231 contracts from the previous week which had a total of -17,130 net contracts.


Japanese Yen:

Large Japanese yen speculators resulted in a net position of 47,503 contracts in this week’s data. This was a weekly gain of 7,261 contracts from the previous week which had a total of 40,242 net contracts.


Swiss Franc:

The Swiss franc speculator standing this week was a net position of 14,651 contracts in the data through Tuesday. This was a weekly decline of -335 contracts from the previous week which had a total of 14,986 net contracts.


Canadian Dollar:

Canadian dollar speculators was a net position of -21,243 contracts this week. This was a lowering of -4,397 contracts from the previous week which had a total of -16,846 net contracts.


Australian Dollar:

The large speculator positions in Australian dollar futures equaled a net position of -10,800 contracts this week in the data ending Tuesday. This was a weekly decline of -5,523 contracts from the previous week which had a total of -5,277 net contracts.


New Zealand Dollar:

The New Zealand dollar speculative standing reached a net position of 9,058 contracts this week in the latest COT data. This was a weekly lift of 746 contracts from the previous week which had a total of 8,312 net contracts.


Mexican Peso:

Mexican peso speculators equaled a net position of 29,041 contracts this week. This was a weekly boost of 5,246 contracts from the previous week which had a total of 23,795 net contracts.


Article By CountingPips.comReceive our weekly COT Reports by Email

*COT Report: The COT data, released weekly to the public each Friday, is updated through the most recent Tuesday (data is 3 days old) and shows a quick view of how large speculators or non-commercials (for-profit traders) were positioned in the futures markets.

The CFTC categorizes trader positions according to commercial hedgers (traders who use futures contracts for hedging as part of the business), non-commercials (large traders who speculate to realize trading profits) and nonreportable traders (usually small traders/speculators).

Find CFTC criteria here: (http://www.cftc.gov/MarketReports/CommitmentsofTraders/ExplanatoryNotes/index.htm).

WTI Crude Oil Speculators edged bullish bets lower after strong run

WTI Crude Oil Futures Sentiment: Updated Data Through: December 01 2020


WTI Crude Oil Large Trader Net Positions:


WTI Crude Oil Non-Commercial Speculator Positions:

Large energy speculators cut back on their bullish net positions in the WTI Crude Oil futures markets this week, according to the latest Commitment of Traders (COT) data released by the Commodity Futures Trading Commission (CFTC) on Friday.

The non-commercial futures contracts of WTI Crude Oil futures, traded by large speculators and hedge funds, totaled a net position of 517,165 contracts in the data reported through December 1st. This was a weekly shortfall of -5,474 net contracts from the previous week which had a total of 522,639 net contracts.

The week’s net position was the result of the gross bullish position (longs) gaining by 4,190 contracts (to a weekly total of 677,347 contracts) while the gross bearish position (shorts) increased by 9,664 contracts for the week (to a total of 160,182 contracts).

Crude oil speculators trimmed their bullish bets this week following a strong three-week run of rising bullish positions. Previously, bullish bets had jumped by a combined total of +80,179 contracts over the prior three weeks that pushed the net position back over the +500,000 contract level for the first time in twelve weeks and move the net position to the highest level in sixteen weeks. Despite this week’s slight decline, the net position remains above the +500,000 contract level for a second straight week at a total of +517,165 contracts.

The large speculators Strength Index level, the current score for traders compared to levels of the past three years, shows that specs are currently at a Bullish level with a score of 52.0 percent.

Speculators are seen as trend followers and usually trade in tandem with the price direction (blue line in above chart). At the extreme levels, specs are very important to watch as they have a tendency to bet the wrong way (that the trend will continue to even more extreme levels).


TRADER TYPE DATA:SPECULATORS
– Percent of Open Interest Longs:31.9
– Percent of Open Interest Shorts:7.5
– Net Position:517,165
– Gross Longs:677,347
– Gross Shorts:160,182
– Long to Short Ratio:4.2 to 1
NET POSITION TREND:
– COT Index Score (3 Year Range Pct):52.0
– COT Index Reading (3 Year Range):Bullish
NET POSITION MOVEMENT INDEX:
– 6-Week Change in Strength Index:5.8

Current Trader Positions as Percent of Open Interest:


Commercial Trader Positions:

The commercial traders position this week came in at a total net position of -559,995 contracts. This was a weekly change of -4,209 contracts from the total net of -555,786 contracts reported the previous week.

The commercials Strength Index level, a score that measures the contract levels of the past three years within a range of 0 to 100, shows that Commercials are currently at a Bearish level with a score of 41.8 percent.

At the extreme levels, commercials are very important to watch as they have a tendency to be correct at the major turning points in price trends.


TRADER TYPE DATA:COMMERCIALS
– Percent of Open Interest Longs:30.5
– Percent of Open Interest Shorts:56.9
– Net Position:-559,995
– Gross Longs:646,931
– Gross Shorts:1,206,926
– Long to Short Ratio:0.5 to 1
NET POSITION TREND:
– COT Index Score (3 Year Range Pct):41.8
– COT Index Reading (3 Year Range):Bearish
NET POSITION MOVEMENT INDEX:
– 6-Week Change in Strength Index:-10.0

Small Trader Positions:

The small traders position this week totaled a net position of 42,830 contracts. This was a weekly change of 9,683 contracts from the total net of 33,147 contracts reported the previous week.

The small traders Strength Index level shows that smalls are currently at a Bullish-Extreme level with a score of 88.6 percent.

Small traders are less important to watch (in most cases) as their numbers tend to be just a small part of the total trading open interest.


TRADER TYPE DATA:SMALL TRADERS
– Percent of Open Interest Longs:4.5
– Percent of Open Interest Shorts:2.5
– Net Position:42,830
– Gross Longs:96,053
– Gross Shorts:53,223
– Long to Short Ratio:1.8 to 1
NET POSITION TREND:
– COT Index Score (3 Year Range Pct):88.6
– COT Index Reading (3 Year Range):Bullish-Extreme
NET POSITION MOVEMENT INDEX:
– 6-Week Change in Strength Index:36.6

*COT Report: The COT data, released weekly to the public each Friday, is updated through the most recent Tuesday (data is 3 days old) and shows a quick view of how large speculators or non-commercials (for-profit traders) as well as the commercial traders (hedgers & traders for business purposes) were positioned in the futures markets. The CFTC categorizes trader positions according to commercial hedgers (traders who use futures contracts for hedging as part of the business), non-commercials (large traders who speculate to realize trading profits) and nonreportable traders (usually small traders/speculators). Find CFTC criteria here: (http://www.cftc.gov/MarketReports/CommitmentsofTraders/ExplanatoryNotes/index.htm).

By CountingPips.com

10-Year Treasury Note Speculators drop bullish bets for 2nd week

10-Year Note Futures Sentiment: Updated Data Through: December 01 2020


10-Year Note Large Trader Net Positions:


10-Year Note Non-Commercial Speculator Positions:

Large bond speculators lowered their bullish net positions in the 10-Year Note futures markets once again this week, according to the latest Commitment of Traders (COT) data released by the Commodity Futures Trading Commission (CFTC) on Friday.

The non-commercial futures contracts of 10-Year Note futures, traded by large speculators and hedge funds, totaled a net position of 25,748 contracts in the data reported through December 1st. This was a weekly drop of -89,227 net contracts from the previous week which had a total of 114,975 net contracts.

The week’s net position was the result of the gross bullish position (longs) lowering by -59,080 contracts (to a weekly total of 544,817 contracts) while the gross bearish position (shorts) gained by 30,147 contracts for the week (to a total of 519,069 contracts).

Speculative positions fell sharply this week for a second straight week and dropped the overall bullish standing to the lowest level of the past month. The bullish position has fallen by a total of -126,571 contracts in just the past two weeks and brought the current standing to a small bullish position of just +25,748 contracts. The speculative position has mostly remained in a small bullish level since ending a long streak of bearish positions in early June.

The large speculators Strength Index level, the current score for traders compared to levels of the past three years, shows that specs are currently at a Bullish-Extreme level with a score of 86.1 percent.

Speculators are seen as trend followers and usually trade in tandem with the price direction (blue line in above chart). At the extreme levels, specs are very important to watch as they have a tendency to bet the wrong way (that the trend will continue to even more extreme levels).


TRADER TYPE DATA:SPECULATORS
– Percent of Open Interest Longs:17.0
– Percent of Open Interest Shorts:16.2
– Net Position:25,748
– Gross Longs:544,817
– Gross Shorts:519,069
– Long to Short Ratio:1.0 to 1
NET POSITION TREND:
– COT Index Score (3 Year Range Pct):86.1
– COT Index Reading (3 Year Range):Bullish-Extreme
NET POSITION MOVEMENT INDEX:
– 6-Week Change in Strength Index:0.3

Current Trader Positions as Percent of Open Interest:


Commercial Trader Positions:

The commercial traders position this week came in at a total net position of 20,265 contracts. This was a weekly change of 97,594 contracts from the total net of -77,329 contracts reported the previous week.

The commercials Strength Index level, a score that measures the contract levels of the past three years within a range of 0 to 100, shows that Commercials are currently at a Bearish-Extreme level with a score of 19.7 percent.

At the extreme levels, commercials are very important to watch as they have a tendency to be correct at the major turning points in price trends.


TRADER TYPE DATA:COMMERCIALS
– Percent of Open Interest Longs:68.9
– Percent of Open Interest Shorts:68.3
– Net Position:20,265
– Gross Longs:2,205,787
– Gross Shorts:2,185,522
– Long to Short Ratio:1.0 to 1
NET POSITION TREND:
– COT Index Score (3 Year Range Pct):19.7
– COT Index Reading (3 Year Range):Bearish-Extreme
NET POSITION MOVEMENT INDEX:
– 6-Week Change in Strength Index:7.1

Small Trader Positions:

The small traders position this week totaled a net position of -46,013 contracts. This was a weekly change of -8,367 contracts from the total net of -37,646 contracts reported the previous week.

The small traders Strength Index level shows that smalls are currently at a Bullish level with a score of 63.7 percent.

Small traders are less important to watch (in most cases) as their numbers tend to be just a small part of the total trading open interest.


TRADER TYPE DATA:SMALL TRADERS
– Percent of Open Interest Longs:11.2
– Percent of Open Interest Shorts:12.6
– Net Position:-46,013
– Gross Longs:357,899
– Gross Shorts:403,912
– Long to Short Ratio:0.9 to 1
NET POSITION TREND:
– COT Index Score (3 Year Range Pct):63.7
– COT Index Reading (3 Year Range):Bullish
NET POSITION MOVEMENT INDEX:
– 6-Week Change in Strength Index:-20.0

*COT Report: The COT data, released weekly to the public each Friday, is updated through the most recent Tuesday (data is 3 days old) and shows a quick view of how large speculators or non-commercials (for-profit traders) as well as the commercial traders (hedgers & traders for business purposes) were positioned in the futures markets. The CFTC categorizes trader positions according to commercial hedgers (traders who use futures contracts for hedging as part of the business), non-commercials (large traders who speculate to realize trading profits) and nonreportable traders (usually small traders/speculators). Find CFTC criteria here: (http://www.cftc.gov/MarketReports/CommitmentsofTraders/ExplanatoryNotes/index.htm).

By CountingPips.com

Gold Speculators pushed bullish bets to 19-week high

Gold Futures Sentiment: Updated Data Through: December 01 2020


Gold Large Trader Net Positions:


Gold Non-Commercial Speculator Positions:

Large precious metals speculators increased their bullish net positions in the Gold futures markets this week, according to the latest Commitment of Traders (COT) data released by the Commodity Futures Trading Commission (CFTC) on Friday.

The non-commercial futures contracts of Gold futures, traded by large speculators and hedge funds, totaled a net position of 260,314 contracts in the data reported through December 01 2020. This was a weekly gain of 16,412 net contracts from the previous week which had a total of 243,902 net contracts.

The week’s net position was the result of the gross bullish position (longs) going up by 4,020 contracts (to a weekly total of 324,344 contracts) while the gross bearish position (shorts) fell by -12,392 contracts for the week (to a total of 64,030 contracts).

Gold speculators sharply boosted their bets this week for the second time in the past three weeks. The increase marked the largest one-week rise in the past nine weeks and pushed the bullish position to the highest level in nineteen weeks, dating back to July 21st. The gold speculator level has now been in a continuous bullish position for one hundred and seven weeks, starting back on November 20th of 2018.

The large speculators Strength Index level, the current score for traders compared to levels of the past three years, shows that specs are currently at a Bullish level with a score of 76.2 percent.

Speculators are seen as trend followers and usually trade in tandem with the price direction (blue line in above chart). At the extreme levels, specs are very important to watch as they have a tendency to bet the wrong way (that the trend will continue to even more extreme levels).


TRADER TYPE DATA:SPECULATORS
– Percent of Open Interest Longs:60.3
– Percent of Open Interest Shorts:11.9
– Net Position:260,314
– Gross Longs:324,344
– Gross Shorts:64,030
– Long to Short Ratio:5.1 to 1
NET POSITION TREND:
– COT Index Score (3 Year Range Pct):76.2
– COT Index Reading (3 Year Range):Bullish
NET POSITION MOVEMENT INDEX:
– 6-Week Change in Strength Index:2.7

Current Trader Positions as Percent of Open Interest:


Commercial Trader Positions:

The commercial traders position this week came in at a total net position of -293,263 contracts. This was a weekly change of -8,434 contracts from the total net of -284,829 contracts reported the previous week.

The commercials Strength Index level, a score that measures the contract levels of the past three years within a range of 0 to 100, shows that Commercials are currently at a Bearish level with a score of 22.4 percent.

At the extreme levels, commercials are very important to watch as they have a tendency to be correct at the major turning points in price trends.


TRADER TYPE DATA:COMMERCIALS
– Percent of Open Interest Longs:20.5
– Percent of Open Interest Shorts:75.0
– Net Position:-293,263
– Gross Longs:110,108
– Gross Shorts:403,371
– Long to Short Ratio:0.3 to 1
NET POSITION TREND:
– COT Index Score (3 Year Range Pct):22.4
– COT Index Reading (3 Year Range):Bearish
NET POSITION MOVEMENT INDEX:
– 6-Week Change in Strength Index:0.2


Small Trader Positions:

The small traders position this week totaled a net position of 32,949 contracts. This was a weekly change of -7,978 contracts from the total net of 40,927 contracts reported the previous week.

The small traders Strength Index level shows that smalls are currently at a Bullish level with a score of 63.6 percent.

Small traders are less important to watch (in most cases) as their numbers tend to be just a small part of the total trading open interest.


TRADER TYPE DATA:SMALL TRADERS
– Percent of Open Interest Longs:10.3
– Percent of Open Interest Shorts:4.2
– Net Position:32,949
– Gross Longs:55,439
– Gross Shorts:22,490
– Long to Short Ratio:2.5 to 1
NET POSITION TREND:
– COT Index Score (3 Year Range Pct):63.6
– COT Index Reading (3 Year Range):Bullish
NET POSITION MOVEMENT INDEX:
– 6-Week Change in Strength Index:-28.3

*COT Report: The COT data, released weekly to the public each Friday, is updated through the most recent Tuesday (data is 3 days old) and shows a quick view of how large speculators or non-commercials (for-profit traders) as well as the commercial traders (hedgers & traders for business purposes) were positioned in the futures markets. The CFTC categorizes trader positions according to commercial hedgers (traders who use futures contracts for hedging as part of the business), non-commercials (large traders who speculate to realize trading profits) and nonreportable traders (usually small traders/speculators). Find CFTC criteria here: (http://www.cftc.gov/MarketReports/CommitmentsofTraders/ExplanatoryNotes/index.htm).

By CountingPips.com