Ichimoku Cloud Analysis 23.12.2020 (BTCUSD, EURUSD, USDJPY)

Article By RoboForex.com

BTCUSD, “Bitcoin vs US Dollar”

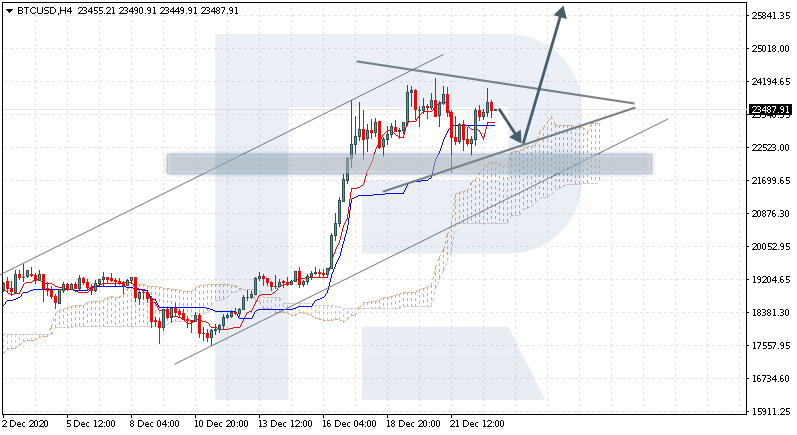
BTCUSD is trading at 23487.00; the instrument is moving above Ichimoku Cloud, thus indicating an ascending tendency. The markets could indicate that the price may test the cloud’s upside border at 22565.00 and then resume moving upwards to reach 25845.00. Another signal in favor of further uptrend will be a rebound from the downside border of a Triangle pattern. However, the bullish scenario may no longer be valid if the price breaks the cloud’s downside border and fixes below 20805.00. In this case, the pair may continue falling towards 19955.00. To confirm further growth, the asset must break the pattern’s upside border and fix above 24365.00.

BTCUSD
Risk Warning: the result of previous trading operations do not guarantee the same results in the future

EURUSD, “Euro vs US Dollar”

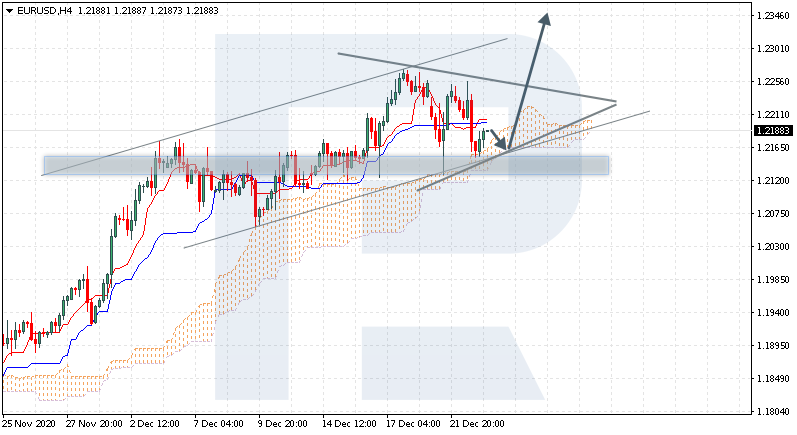
EURUSD is trading at 1.2188; the instrument is moving above Ichimoku Cloud, thus indicating an ascending tendency. The markets could indicate that the price may test the cloud’s downside border at 1.2155 and then resume moving upwards to reach 1.2345. Another signal in favor of further uptrend will be a rebound from the rising channel’s downside border. However, the bullish scenario may be canceled if the price breaks the cloud’s downside border and fixes below 1.2105. In this case, the pair may continue falling towards 1.2015. To confirm further growth, the asset must break the upside border of a Triangle pattern and fix above 1.2265.

EURUSD
Risk Warning: the result of previous trading operations do not guarantee the same results in the future

USDJPY, “US Dollar vs Japanese Yen”

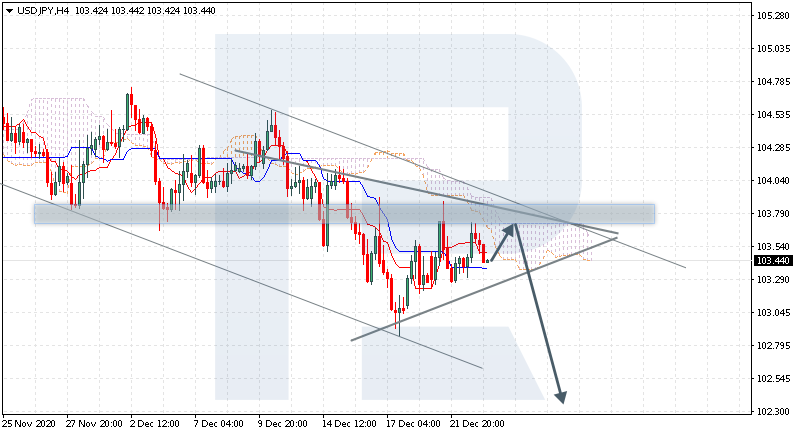
USDJPY is trading at 103.44; the instrument is moving below Ichimoku Cloud, thus indicating a descending tendency. The markets could indicate that the price may test the cloud’s upside border at 103.65 and then resume moving downwards to reach 102.45. Another signal in favor of further downtrend will be a rebound from the descending channel’s upside border. However, the bearish scenario may no longer be valid if the price breaks the cloud’s upside border and fixes above 104.05. In this case, the pair may continue growing towards 104.95. To confirm further decline, the asset must break the downside border of a Triangle pattern and fix below 103.10.

USDJPY

Article By RoboForex.com

Attention!
Forecasts presented in this section only reflect the author’s private opinion and should not be considered as guidance for trading. RoboForex LP bears no responsibility for trading results based on trading recommendations described in these analytical reviews.

The Analytical Overview of the Main Currency Pairs on 2020.12.23

by JustForex

The EUR/USD currency pair

Technical indicators of the currency pair:
  • Prev Open: 1.2241
  • Prev Close: 1.2161
  • % chg. over the last day: -0.66%

On Tuesday, EUR/USD came under pressure from bears again. Against the background of the closure of the borders with the UK and the lack of progress in the Brexit negotiations, the German Bonds continued to lose yield and reached -0.60%. The spread has decreased by 100 basis points over the past month against benchmark US Treasuries. The foreign exchange market started giving more signals for a mid-term correction.

Trading recommendations
  • Support levels: 1.2273
  • Resistance levels: 1.2177, 1.2124

The main scenario for trading EUR/USD is selling on growth. Technical indicators have changed to the south. On yesterday’s decline, the ADX demonstrated greater bearish potential than on Monday. The MACD has consolidated in the negative zone. The moving averages have also reorganized and are in the south direction. The price movement has formed a “contracting triangle” pattern, the borders of which will lie at 1.2250 above and 1.2163 below. Withdrawal from the triangle will give a clearer signal for actions.

Alternative scenario: if the price can fix above the level of 1.2250, it is possible that the price will move further to 1.2273, and the break-through of the last point will indicate further growth.

EUR/USD
News feed for 2020.12.23:
  • – United States Initial Jobless Claims at 16:30 (GMT+2).

The GBP/USD currency pair

Technical indicators of the currency pair:
  • Prev Open: 1.3462
  • Prev Close: 1.3358
  • % chg. over the last day: -0.78%

At the end of Tuesday, the sterling had the biggest intraday losses in December. Lack of progress in negotiations between the EU and Britain does not give the bulls the opportunity to push the pair higher. Taking into account the factor of positive expectations, on which the sterling was growing, it’s likely that the instrument was in the area of overvaluation. Against this background, the southern correction may be more significant.

Trading recommendations
  • Support levels: 1.3287, 1.3187
  • Resistance levels: 1.3553, 1.3623

The main trading scenario for GBP/USD is trading in a wide sideways range between 1.3553 and 1.3287. Today’s technical indicators were stronger than those of the euro. The ADX showed a very low downtrend potential, which causes doubts concerning bears’ strength. In this case, the upward movement in the Asian session is indicated on the oscillator as the true one. The price has fixed between the moving averages SMA 50 and SMA 100. The MACD is in the neutral zone. For a total, a neutral signal is obtained.

Alternative scenario: if the price fixes above 1.3553, the pair is likely to resume its growth. A break-through of 1.3287 will give a signal for further decline.

GBP/USD
There is no news feed for today.

The USD/JPY currency pair

Technical indicators of the currency pair:
  • Prev Open: 103.30
  • Prev Close: 103.63
  • % chg. over the last day: +0.32%

There have been some little changes in the currency pair since yesterday. The amplitude of oscillations decreased and the price range remained the same. Due to the lack of drivers for the growth of risky assets, it is difficult to hope for the development of corrective growth. At the same time, the main majors began to show signs of a correction, which strengthens the dollar index and pair.

Trading recommendations
  • Support levels: 103.26, 102.89
  • Resistance levels: 103.93, 104.15

The main scenario is trading in a sideways range. If yesterday there was a small priority to purchases, today it has decreased. The ADX has rebuilt and indicates the growth of bears’ strength. The MACD remains near zero. The price is likely to continue fluctuating in the area of 103.26 – 103.70.

An alternative scenario assumes a break-through of 103.26 and the development of a further fall. In case of breaking 103.93, it’s likely that there will be further growth.

USD/JPY
News feed for 2020.12.23:
  • – United States Initial Jobless Claims at 16:30 (GMT+2);
  • – New Home Sales in the United States (Nov) at 18:00 (GMT+2).

The USD/CAD currency pair

Technical indicators of the currency pair:
  • Prev Open: 1.2852
  • Prev Close: 1.2905
  • % chg. over the last day: +0.41%

USD/CAD continued its northern correction on Tuesday. Oil quotes remain under pressure from the worsening situation with the coronavirus pandemic, which puts pressure on the Canadian currency. The growth of the dollar index supports the northern direction of the currency pair.

Trading recommendations
  • Support levels: 1.2789, 1.2688
  • Resistance levels: 1.2954, 1.3079

The main scenario is buying on a decline. The support and resistance levels have remained the same, as new and more distinct extremes have not been formed. The pair is still in the first upward impulse. The ADX has weakened somewhat, which indicates the likelihood of a pullback or consolidation near current levels. The price remains above the moving averages, which additionally indicates the strength of the bulls.

Alternative scenario: if the price manages to return below 1.2787, the southern trend may resume.

USD/CAD
News feed for 2020.12.23:
  • – Canadian GDP (MoM) (Oct) at 16:30 (GMT+2);
  • – US crude oil reserves at 18:00 (GMT+2).

by JustForex


This article reflects a personal opinion and should not be interpreted as an investment advice, and/or offer, and/or a persistent request for carrying out financial transactions, and/or a guarantee, and/or a forecast of future events.

Boris Johnson’s offer was rejected. The market took a wait-and-see approach

by JustForex

European stocks moved up after a rebound in trade supplies. Earlier, the border crossing was blocked due to the worsening epidemiological situation. At the same time, the market got to know about the rejection of Boris Johnson’s offer for mutual concessions by the European Union. The EU still refuses to reduce the cost of fish products by more than 25%. However, officials assure that both sides are ready to make a “final push” and that “a deal is still possible.”

US equity futures have faltered after the statements from Donald Trump, who criticized the pandemic relief bill. This triggered a 0.25% pullback in the S&P 500 futures after falling by 0.7%. It requires lawmakers to increase the stimulus payments to $ 2,000 from the $ 600 indicated in the document.

On the one hand, the appeal appears to be positive for the market. But, on the other hand, Trump’s comments may cause a new disturbance in the markets, since it may take more time to bring the bill into practice. The House Speaker Nancy Pelosi is now pointing to the need for larger individual checks on incentive payments and said that the House of Representatives will try to deal with the additional measure during Thursday’s meeting.

It seems that the stock and foreign exchange markets aren’t yet ready to “press the sell button” and have taken a wait-and-see approach. The credit market is traded in different directions. German Bonds and British Gilts lost profitability, while the US Treasuries moved higher.

Major stock indices opened in different directions:

S&P 500 (F) 3,687.62 +10.37 +0.28%

DAX 13,508.05 +89.94 +0.67%

FTSE 100 6,449.85 -3.31 -0.05%

USD Index 90,325 -0.221 -0.24%

Important venets:
  • – United States Initial Jobless Claims at 16:30 (GMT+2).
  • – Canadian GDP (MoM) (Oct) at 16:30 (GMT+2);
  • – New Home Sales in the United States (Nov) at 18:00 (GMT+2);
  • – US crude oil reserves at 18:00 (GMT+2).

by JustForex


This article reflects a personal opinion and should not be interpreted as an investment advice, and/or offer, and/or a persistent request for carrying out financial transactions, and/or a guarantee, and/or a forecast of future events.

The Taliban are megarich – here’s where they get the money they use to wage war in Afghanistan

By Hanif Sufizada, University of Nebraska Omaha

The Taliban militants of Afghanistan have grown richer and more powerful since their fundamentalist Islamic regime was toppled by U.S. forces in 2001.

In the fiscal year that ended in March 2020, the Taliban reportedly brought in US$1.6 billion, according to Mullah Yaqoob, son of the late Taliban spiritual leader Mullah Mohammad Omar, who revealed the Taliban’s income sources in a confidential report commissioned by NATO and later obtained by Radio Free Europe/Radio Liberty.

In comparison, the Afghan government brought in $5.55 billion during the same period. The government is now in peace talks with the Taliban, seeking to end their 19-year insurgency.

I study the Taliban’s finances as an economic policy analyst at the Center for Afghanistan Studies. Here’s where their money comes from.

1. Drugs – $416 million

Afghanistan accounted for approximately 84% of global opium production over the past five years, according to the United Nation’s World Drug Report 2020.

Much of those illicit drug profits go to the Taliban, which manage opium in areas under their control. The group imposes a 10% tax on every link in the drug production chain, according to a 2008 report from the Afghanistan Research and Evaluation Unit, an independent research organization in Kabul. That includes the Afghan farmers who cultivate poppy, the main ingredient in opium, the labs that convert it into a drug and the traders who move the final product out of country.

2. Mining – $400 million to $464 million

Mining iron ore, marble, copper, gold, zinc and other metals and rare-earth minerals in mountainous Afghanistan is an increasingly lucrative business for the Taliban. Both small-scale mineral-extraction operations and big Afghan mining companies pay Taliban militants to allow them to keep their businesses running. Those who don’t pay have faced death threats.

According to the Taliban’s Stones and Mines Commission, or Da Dabaro Comisyoon, the group earns $400 million a year from mining. NATO estimates that figure higher, at $464 million – up from just $35 million in 2016.

3. Extortion and taxes – $160 million

Like a government, the Taliban tax people and industries in the growing swath of Afghanistan under their control. They even issue official receipts of tax payment.

“Taxed” industries include mining operations, media, telecommunications and development projects funded by international aid. Drivers are also charged for using highways in Taliban-controlled regions, and shopkeepers pay the Taliban for the right to do business.

The group also imposes a traditional Islamic form of taxation called “ushr” – which is a 10% tax on a farmer’s harvest – and “zakat,” a 2.5% wealth tax.

According to Mullah Yaqoob, tax revenues – which may also be considered extortion – bring in around $160 million annually.

Since some of those taxed are poppy growers, there could be some financial overlap between tax revenue and drug revenue.

4. Charitable donations – $240 million

The Taliban receive covert financial contributions from private donors and international institutions across the globe.

Many Taliban donations are from charities and private trusts located in Persian Gulf countries, a region historically sympathetic to the group’s religious insurgency. Those donations add up to about $150 million to $200 million each year, according to the Afghanistan Center for Research and Policy Studies. These charities are on the U.S. Treasurey Department’s list of groups that finance terrorism.

Private citizens from Saudi Arabia, Pakistan, Iran and some Persian Gulf nations also help finance the Taliban, contributing another $60 million annually to the Taliban-affiliated Haqqani Network, according to American counterterrorism agencies.

5. Exports – $240 million

In part to launder illicit money, the Taliban import and export various everyday consumer goods, according to the United Nations Security Council. Known business affiliates include the multinational Noorzai Brothers Limited, which imports auto parts and sells reassembled vehicles and spare automobile parts.

The Taliban’s net income from exports is thought to be around $240 million a year. This figure includes the export of poppy and looted minerals, so there may be financial overlap with drug revenue and mining revenue.

6. Real estate – $80 million

The Taliban own real estate in Afghanistan, Pakistan and potentially other countries, according to Mullah Yaqoob and the Pakistani TV Channel SAMAA. Yaqoob told NATO annual real estate revenue is around $80 million.

7. Specific countries

According to BBC reporting, a classified CIA report estimated in 2008 that the Taliban had received $106 million from foreign sources, in particular from the Gulf states.

Today, the governments of Russia, Iran, Pakistan and Saudi Arabia are all believed to bankroll the Taliban, according to numerous U.S. and international sources. Experts say these funds could amount to as much as $500 million a year, but it is difficult to put an exact figure on this income stream.

Building a peacetime budget

For nearly 20 years, the Taliban’s great wealth has financed mayhem, destruction and death in Afghanistan. To battle its insurgency, the Afghan government also spends heavily on war, often at the expense of basic public services and economic development.

[Deep knowledge, daily. Sign up for The Conversation’s newsletter.]

A peace agreement in Afghanistan would allow the government to redirect its scarce resources. The government might also see substantial new revenue flow in from legal sectors now dominated by the Taliban, such as mining.

Stability is additionally expected to attract foreign investment in the country, helping the government end its dependence on donors like the United States and the European Union.

There are many reasons to root for peace in war-scarred Afghanistan. Its financial health is one of them.The Conversation

About the Author:

Hanif Sufizada, Education and Outreach Program Coordinator, University of Nebraska Omaha

This article is republished from The Conversation under a Creative Commons license. Read the original article.

 

Markets little moved by Trumps refusal to sign the stimulus bill

By Hussein Sayed, Chief Market Strategist (Gulf & MENA), ForexTime

With less than a month left to go before he leaves the Oval Office, President Trump caught the markets by surprise threatening not to sign a long-debated Covid-19 relief package which took the Congress several months to agree upon. While he did not say he will veto the legislation, Trump demanded an increase in direct payments to Americans from $600 in the current bill to $2,000.

The $900 billion pandemic relief package that will deliver cash to individuals and businesses along with much-needed resources to vaccinate the country seemed to be a done deal 24 hours ago. Trump’s top administration official Treasury Secretary Mnuchin praised the package on Tuesday, saying it is critical for American workers, families and businesses.

US futures initially fell on the news but were quick to recover, with all three major indices sitting slightly below the flatline at the time of writing. The market reaction reflects the belief that the bill will be amended and signed in a couple of weeks. Alternatively, the Democrats are willing to offer an increase in stimulus cheques in a separate bill.

The new highly contagious coronavirus strain, which first appeared in the UK and canceled Christmas plans for millions, maybe of more considerable risk to sentiment. That depends widely on the trajectory it will take in the coming days and weeks as scientists scramble to fully understand the new variant.  Currently, there are more questions than answers. Will the mutated virus stop vaccines from working? How far will it spread? Is it more deadly? Does it spread more in the younger population? Until we get answers to these questions, it is difficult to know its impact on the economy.

Despite these challenges ahead, there has so far been little demand for the safe haven Dollar on Wednesday. The USD has declined against most major currencies with GBPUSD back above 1.34. The EU and UK have reached the final stages of the negotiations, and with Sterling still hovering around current levels traders are leaning towards a positive outcome for a Brexit deal. Expect conflicting headlines to drive more volatility in Sterling until we get the final result. The magnitude of the downside remains much higher than the upside given what is currently priced in.

In commodity markets, oil is feeling most of the pressure from the new coronavirus variant. Brent has fallen more than 5.5% in three days and is currently trading below $50. If the new strain leads to more lockdowns and travel restrictions, we can see more short-term pain. However, the medium-term outlook relies on the distribution speed and effectiveness of the vaccine. At current price levels it seems most of the positive news has already been baked in and it now requires solid data to support further upside.

Gold is another commodity to keep an eye on as we approach year-end. If asset managers want to book some profits and reduce risk in portfolios, gold is likely to receive some significant inflows in the final days of 2020. Overall, we remain positive on the yellow metal as long as real yields continue trading in negative territory, which is likely to be the scenario in the year ahead.

Disclaimer: The content in this article comprises personal opinions and should not be construed as containing personal and/or other investment advice and/or an offer of and/or solicitation for any transactions in financial instruments and/or a guarantee and/or prediction of future performance. ForexTime (FXTM), its affiliates, agents, directors, officers or employees do not guarantee the accuracy, validity, timeliness or completeness, of any information or data made available and assume no liability as to any loss arising from any investment based on the same.


Forex-Time-LogoArticle by ForexTime

ForexTime Ltd (FXTM) is an award winning international online forex broker regulated by CySEC 185/12 www.forextime.com

The Final Push

By Lukman Otunuga, Research Analyst, ForexTime

While some traders probably wish they were wrapping presents and opening a nice glass of their favourite beverage, markets are considering the abundant newsflow still going on with pandemic fears, deals and no deal headlines remaining front and centre. The US Senate has now passed the huge relief bill and although it could feel a bit like a ‘buy the rumour, sell the fact’ type trade, stocks are firmer today after the abrupt, almost panic-like price action yesterday.

It is the travel restrictions which continue to linger on the market psyche though, while last night’s raised hopes of a Brexit breakthrough on fishing quotas have been roundly rejected by the EU. Rising Covid case counts in the US are another risk which is helping to support the Dollar and encourage some position squaring as traders consider the thinning market conditions which will come over the festive period.

Key challenges into the New Year will remain for the greenback, although this loss of confidence in the recovery from the new virus strain or a more active Fed touching on the brakes of monetary policy may give the world’s premier reserve currency a chance to hold on to some of its dignity. King Dollar could sure do with a welcome Christmas break after such a tempestuous year!

GBP volatility assured

Currency moves around this time of year are always susceptible to thin volumes and liquidity. This means with Brexit noise near its peak, we should expect ever wilder price action. The latest news is now suggesting some more narrowing of divisions on fishing and the UK Parliament possibly preparing for an emergency sitting on 30 December to approve any deal. The original risk around the European Parliament not being able to ratify any agreement before the New Year has also diminished, as the EU Council can provisionally apply the UK-EU treaty pending full ratification next year.

The EU’s Barnier is due to speak within the hour so watch those headlines, with consensus now veering towards a compromise agreement between Christmas and the New Year.

Disclaimer: The content in this article comprises personal opinions and should not be construed as containing personal and/or other investment advice and/or an offer of and/or solicitation for any transactions in financial instruments and/or a guarantee and/or prediction of future performance. ForexTime (FXTM), its affiliates, agents, directors, officers or employees do not guarantee the accuracy, validity, timeliness or completeness, of any information or data made available and assume no liability as to any loss arising from any investment based on the same.


Forex-Time-LogoArticle by ForexTime

ForexTime Ltd (FXTM) is an award winning international online forex broker regulated by CySEC 185/12 www.forextime.com

Japanese Candlesticks Analysis 22.12.2020 (USDCAD, AUDUSD, USDCHF)

Article By RoboForex.com

USDCAD, “US Dollar vs Canadian Dollar”

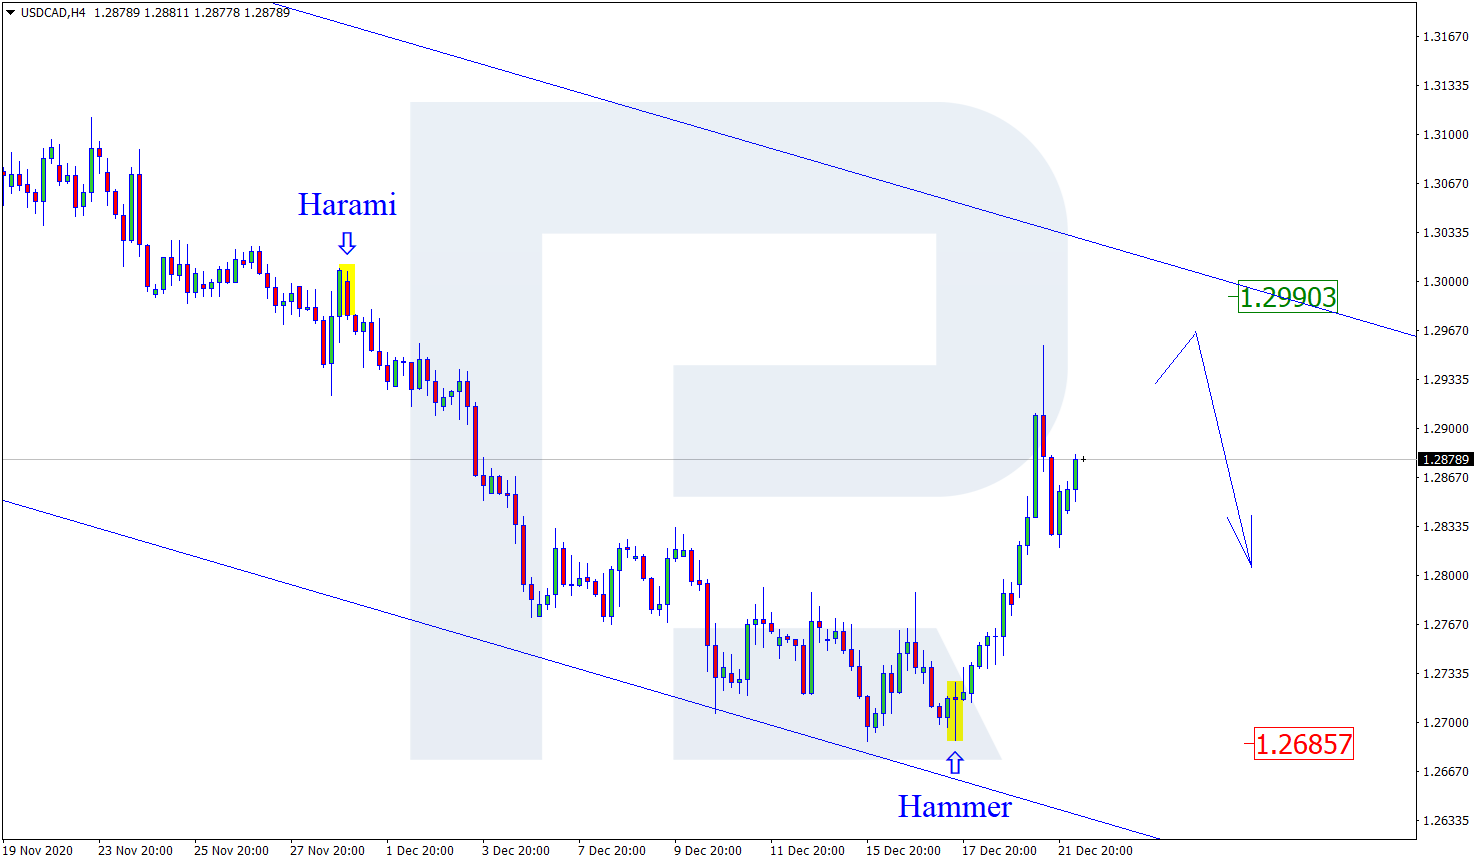
As we can see in the H4 chart, the pullback within the descending tendency continues. Right now, after forming several reversal patterns, such as Hammer, not far from the support level, USDCAD is reversing in the form of another correction and may later continue growing within the descending channel. in this case, the upside target will be at 1.2990. However, an alternative scenario implies that the price may continue falling to reach 1.2685 without testing the channel’s upside border.

USDCAD
Risk Warning: the result of previous trading operations do not guarantee the same results in the future

AUDUSD, “Australian Dollar vs US Dollar”

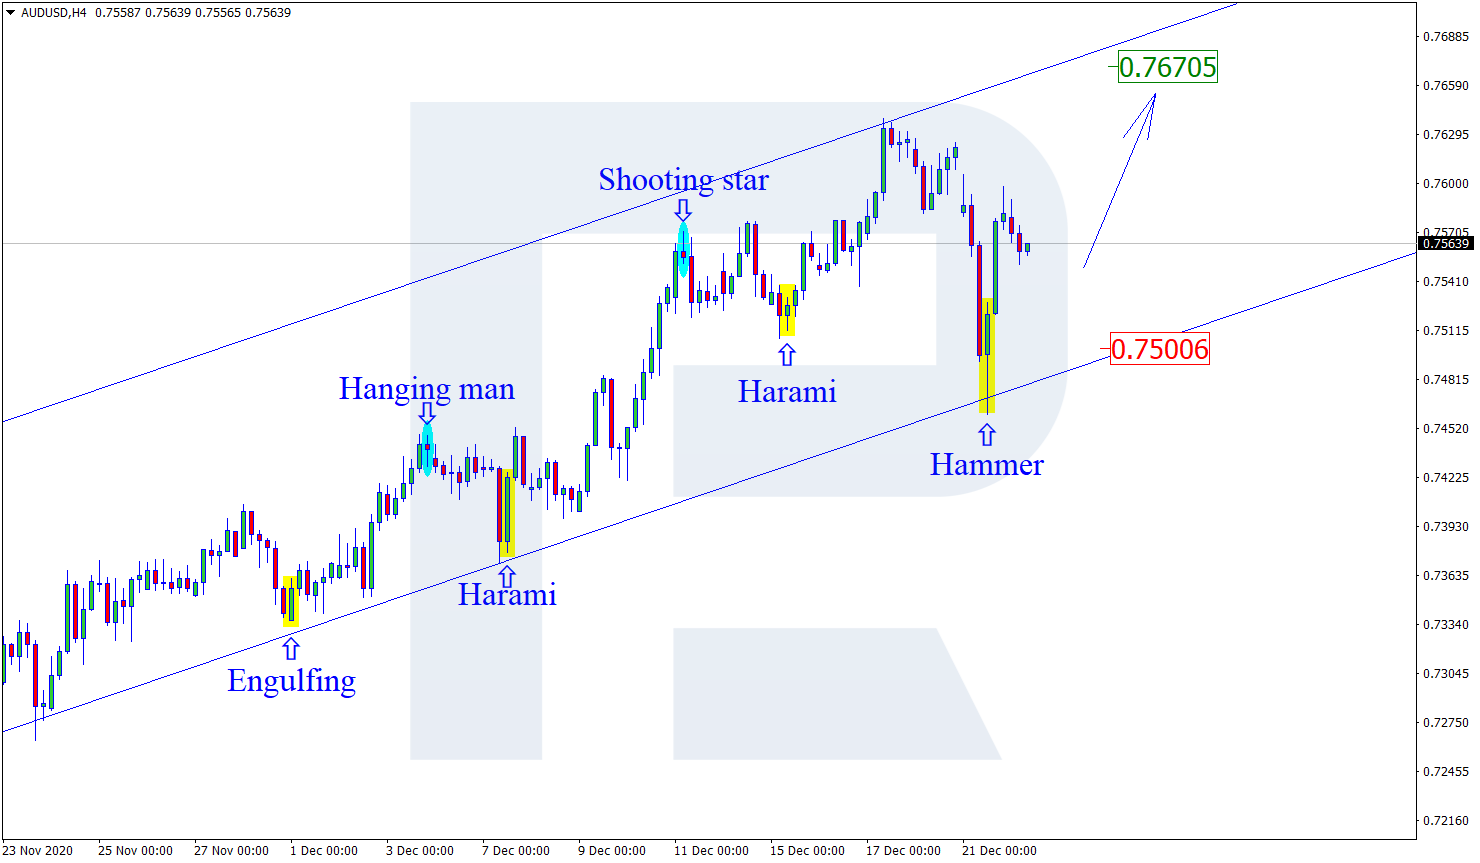
As we can see in the H4 chart, after forming a Hammer pattern, the pair is reversing. Right now, AUDUSD continues growing within the rising channel. In this case, the upside target will be the next resistance level at 0.7670. At the same time, an opposite scenario says that the price may continue falling to return to 0.7500 before resuming its growth.

AUDUSD
Risk Warning: the result of previous trading operations do not guarantee the same results in the future

USDCHF, “US Dollar vs Swiss Franc”

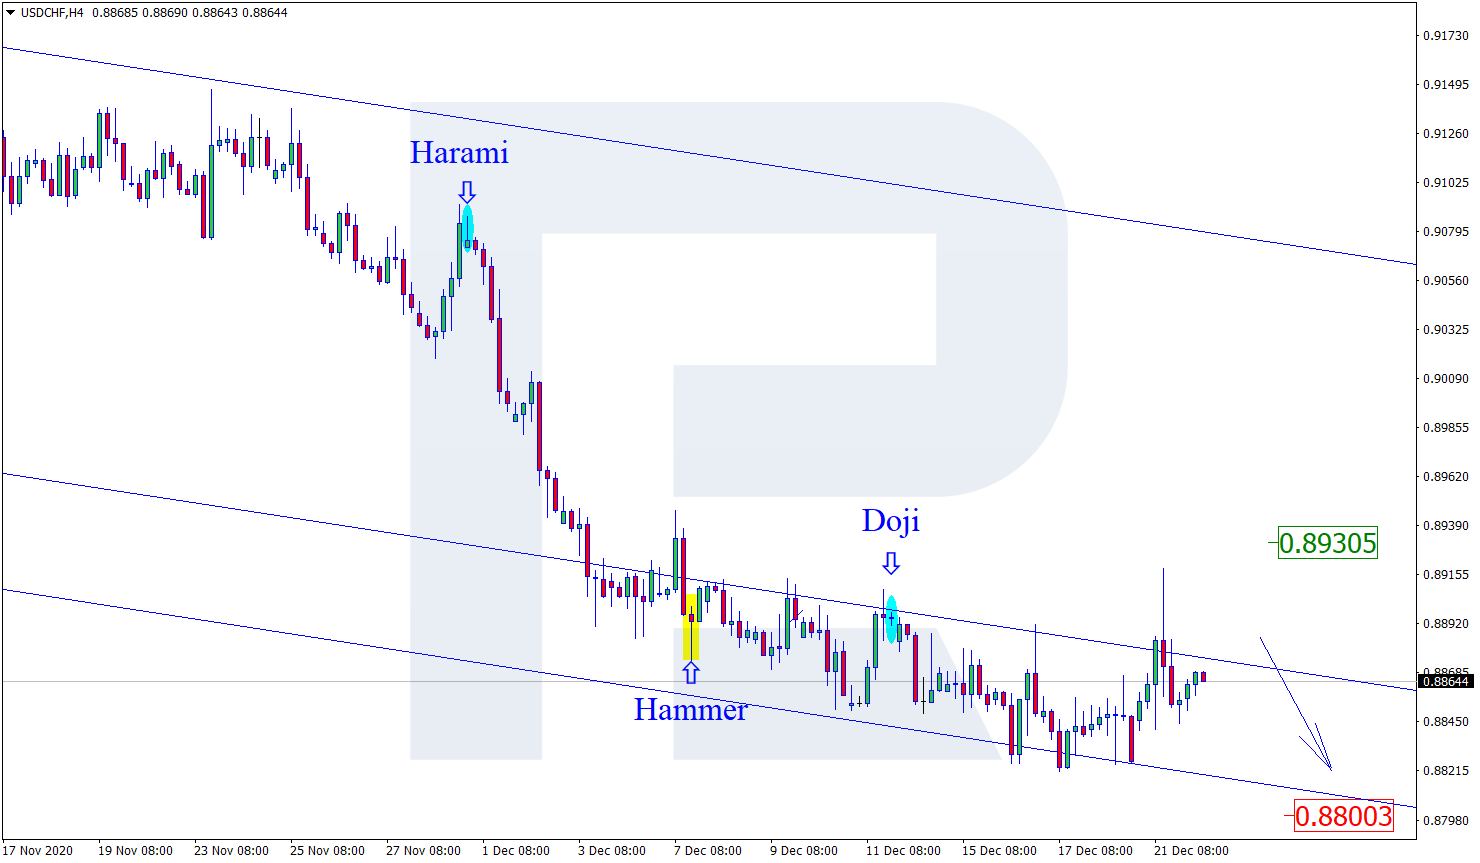
As we can see in the H4 chart, after breaking the descending channel’s downside border and forming several reversal patterns, such as Doji, not far from the resistance area, USDCHF is reversing and may resume the descending tendency. In this case, the next downside target may be the support area at 0.8800. Still, there might be an alternative scenario, according to which the asset may return to 0.8930 before resuming its decline.

USDCHF

Article By RoboForex.com

Attention!
Forecasts presented in this section only reflect the author’s private opinion and should not be considered as guidance for trading. RoboForex LP bears no responsibility for trading results based on trading recommendations described in these analytical reviews.

Boris Johnson’s fishing concession proposal is being discussed, but the market is worried

by JustForex

On Monday evening, the British Prime Minister Boris Johnson’s desire to compromise and make concessions to the European Union on the fishing clause became known. According to his new plan, the cost of fish that the EU catches in British waters should be reduced by 30%. In return, the United Kingdom seeks concessions in other items of the contract.

Last week the UK pushed for the European bloc to cut costs by 60%, but the EU refuses to cut costs by more than 25%. The European Commission is currently consulting with EU member states on the UK proposal, and Michelle Barnier is due to inform his 27 ambassadors at approximately 16:00 (GMT+1) on Tuesday in Brussels. The authorities added that a compromise could still be reached.

Against this background, the market has stabilized after falling on Monday. Hopes for a deal remain. An additional bullish driver for the market is the US Congress’s positive decision on the $ 900 billion bailout bill. As noted in ING Group, the agreed package of tax breaks will undoubtedly help mitigate some of the negative factors, but, unfortunately, it will not fully offset the effects of the pandemic.

The European stock market has partially recovered its losses but is in no hurry to return to the highs. The likelihood of developing a correction remains as the yield of the primary bonds continues to decline.

Major stock indices are trading down:

S&P 500 (F) 3,687.88 +2.13 +0.06%

Dow Jones 30,216.45 +37.40 +0.12%

DAX 13,364.25 +117.95 +0.89%

FTSE 100 6,421.65 +5.33 +0.08%

Important venets:
  • – 16:30 (GMT+3) The number of initial applications for unemployment benefits in the United States;
  • – 16:30 (GMT+3) Canadian GDP (m/m) (Oct);
  • – 18:00 (GMT+3) New Home Sales in the United States (Nov);
  • – 18:30 (GMT+3) US crude oil reserves.

by JustForex


This article reflects a personal opinion and should not be interpreted as an investment advice, and/or offer, and/or a persistent request for carrying out financial transactions, and/or a guarantee, and/or a forecast of future events.

Forex Technical Analysis & Forecast 22.12.2020

Article By RoboForex.com

EURUSD, “Euro vs US Dollar”

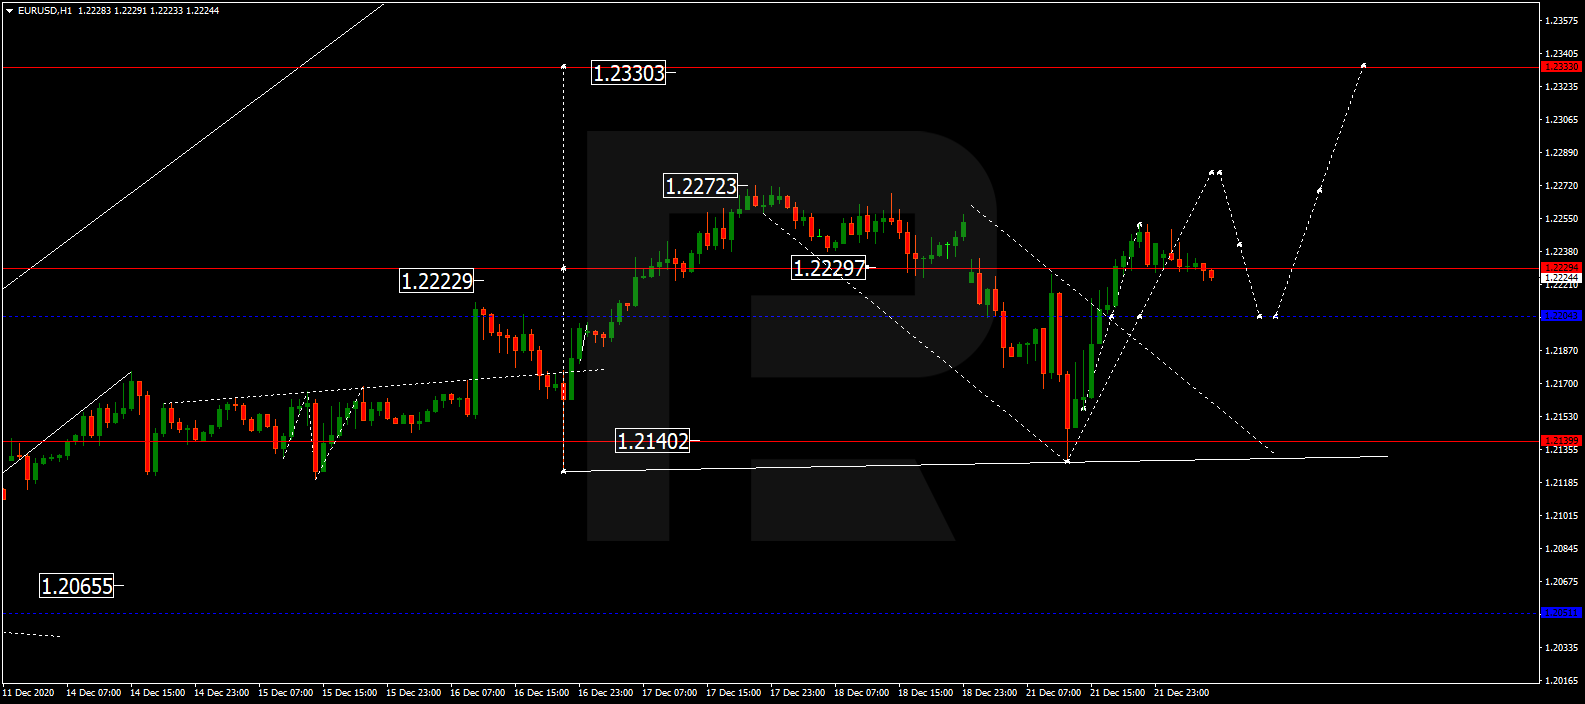
After completing the descending wave at 1.2140 and then breaking 1.2200 to the upside, EURUSD has reached the short-term upside target at 1.2249; right now, it is falling to test 1,2200 from above and may later form one more ascending structure towards 1.2277. However, if the price breaks 1.2190 to the downside, the market may continue the correction to reach 1.2050 and then start another growth with the target at 1.2330.

EURUSD
Risk Warning: the result of previous trading operations do not guarantee the same results in the future

GBPUSD, “Great Britain Pound vs US Dollar”

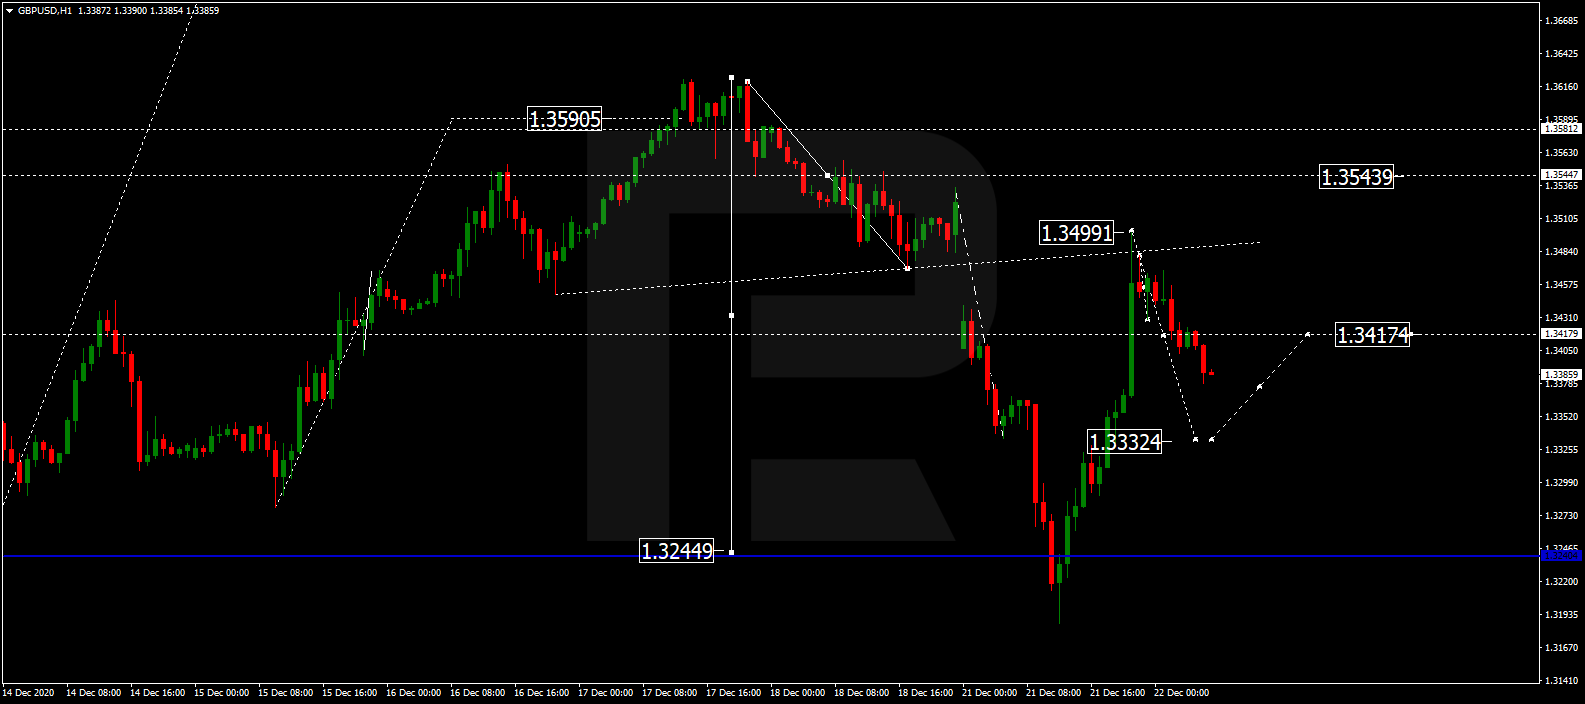
After finishing the descending wave at 1.3230 and then breaking 1.3330 to the upside, GBPUSD has reached the short-term target at 1.3499; right now, it is falling to test 1.3330 from above and may later start another growth towards 1.3544. However, if the price breaks 1.3320 to the downside, the instrument may continue trading downwards with the target at 1.3200.

GBPUSD
Risk Warning: the result of previous trading operations do not guarantee the same results in the future

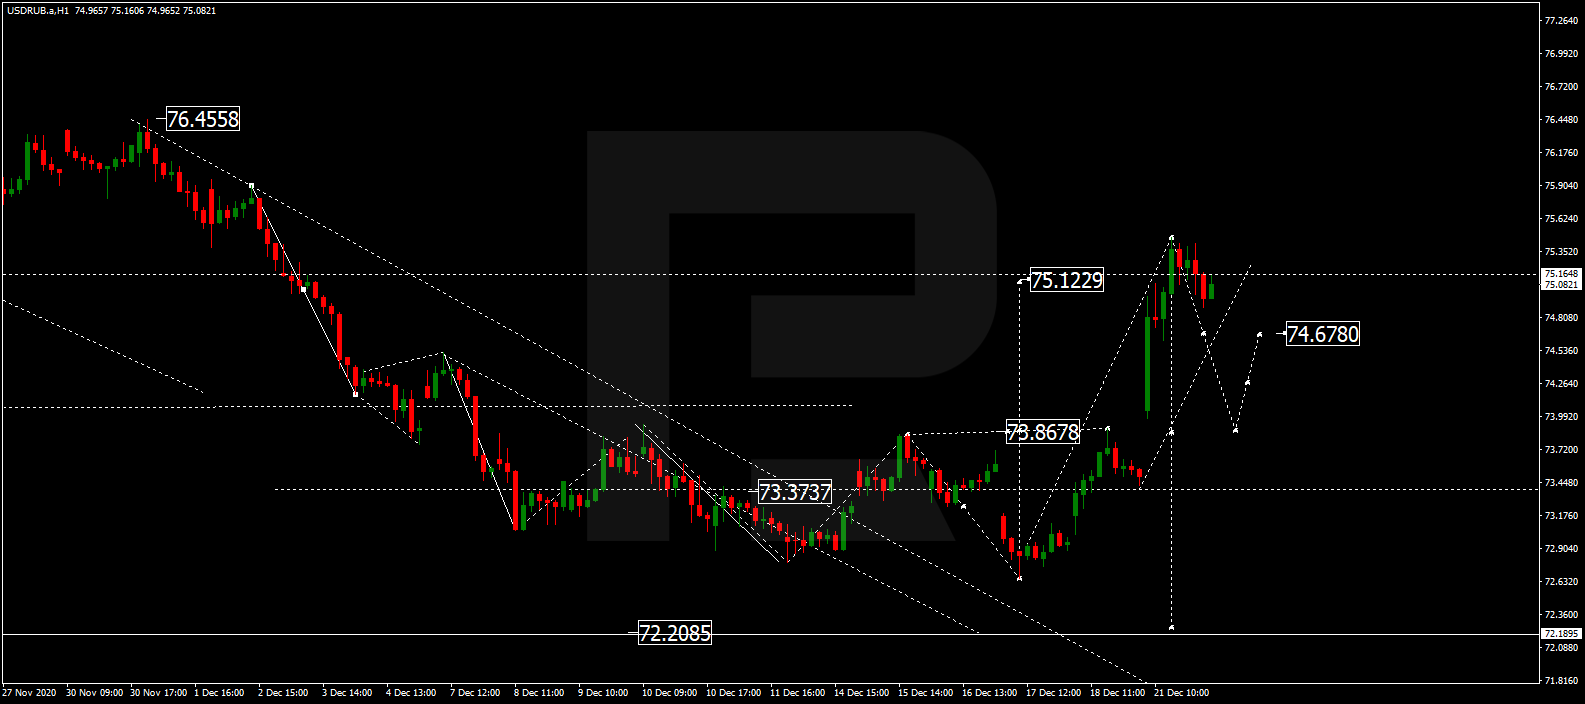
USDRUB, “US Dollar vs Russian Ruble”

After breaking 73.83 to the upside and then completing the ascending structure at 75.12, USDRUB is expected to test 73.83 from above and may later form one more ascending structure towards 74.67, thus forming a new consolidation range between two latter levels. If later the price breaks this range to the upside, the market may start another growth to reach 76.76; if to the downside – resume trading downwards with the target at 72.20.

USDRUB
Risk Warning: the result of previous trading operations do not guarantee the same results in the future

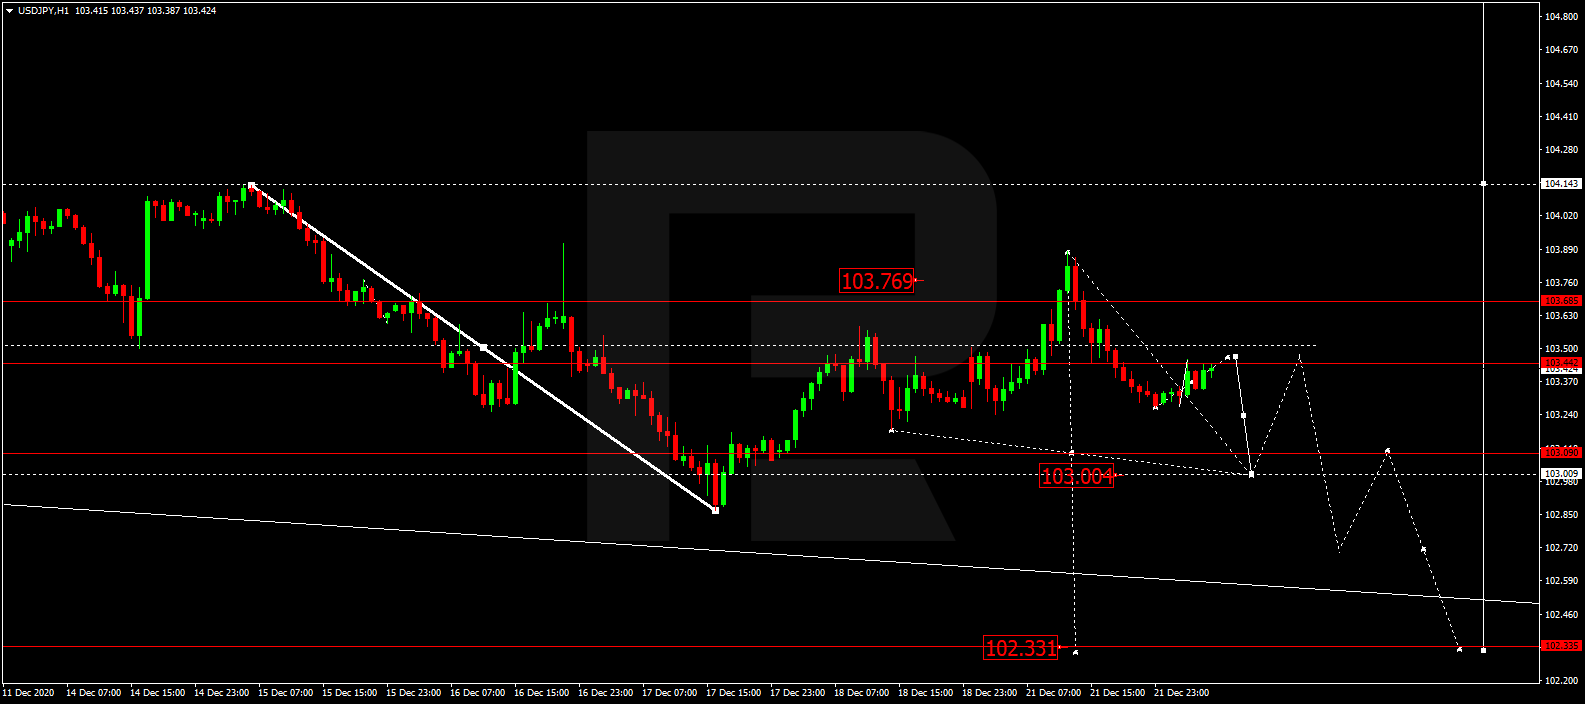
USDJPY, “US Dollar vs Japanese Yen”

After finishing the ascending wave at 103.77, USDJPY is falling towards 103.00. After that, the instrument may grow to reach 103.40 and then start another decline to break 102.70. Later, the market may form a new descending structure with the closest target at 102.50.

USDJPY
Risk Warning: the result of previous trading operations do not guarantee the same results in the future

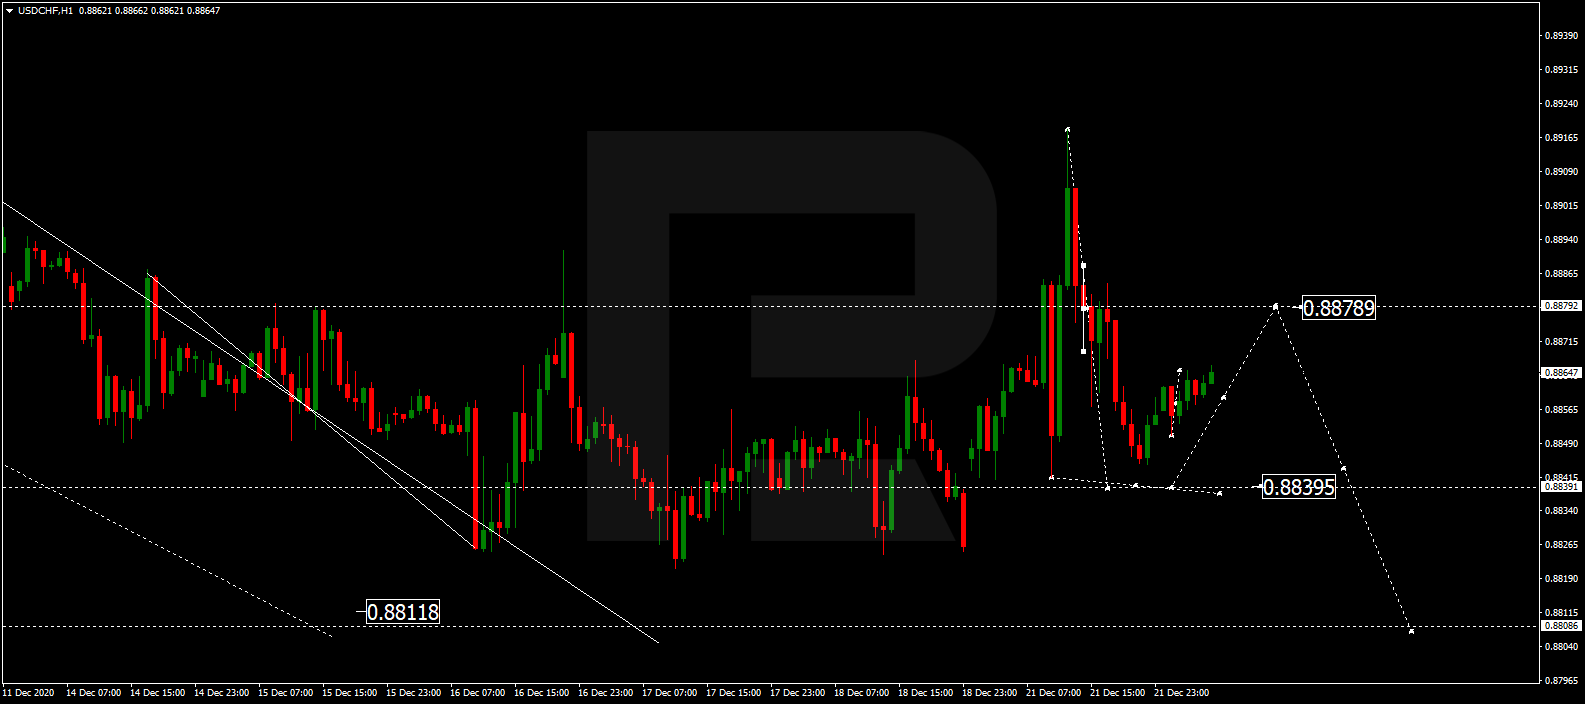
USDCHF, “US Dollar vs Swiss Franc”

After finishing the ascending structure at 0.8900, then reaching 0.8880, and forming a new consolidation range there, USDCHF has broken this range to the downside to reach the short-term target at 0.8844; right now, it is correcting to test 0.8877 from below. After that, the instrument may start another decline with the target at 0.8839.

USDCHF
Risk Warning: the result of previous trading operations do not guarantee the same results in the future

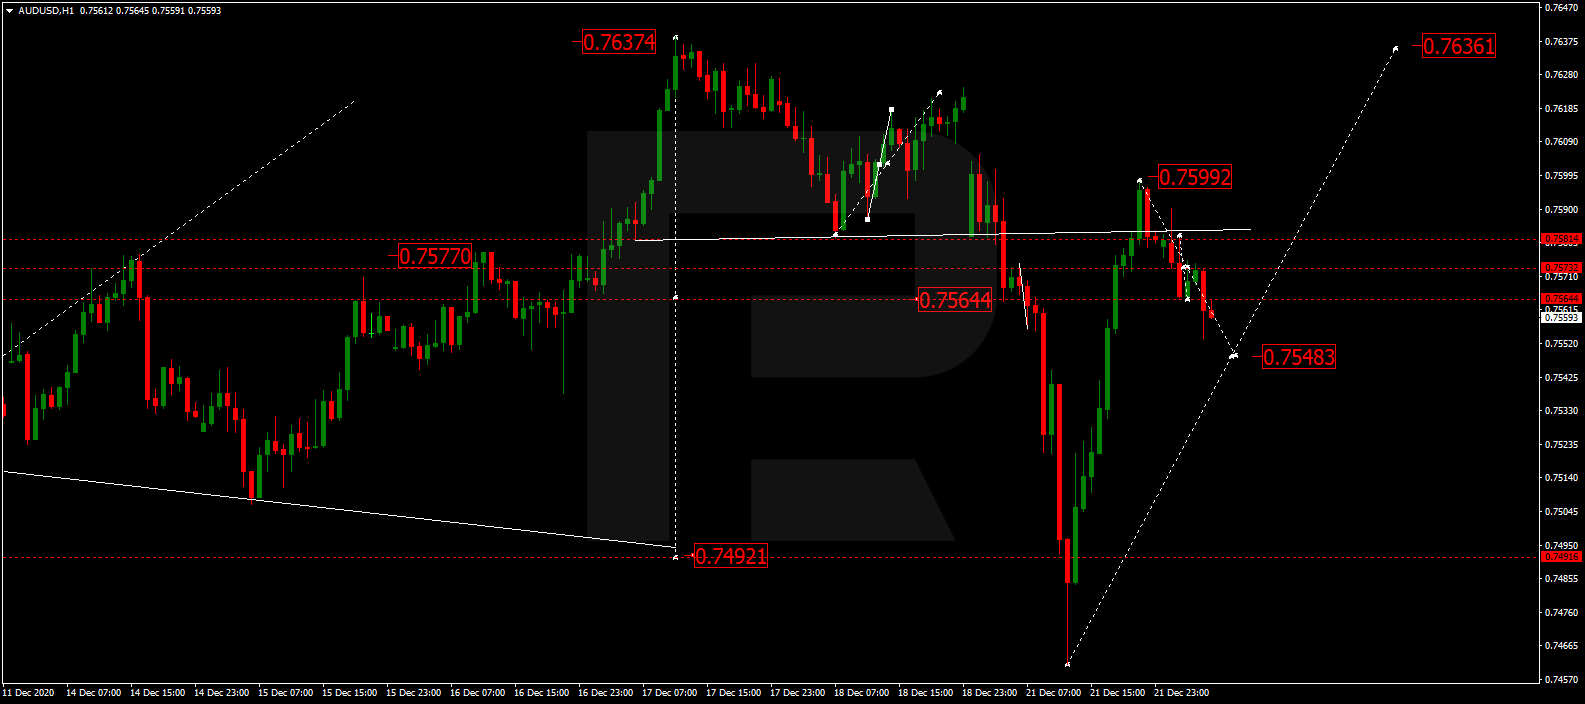
AUDUSD, “Australian Dollar vs US Dollar”

After completing the descending wave at 0.7490 along with the correction towards 0.7599, AUDUSD is trading downwards to reach 0.7548. Later, the market may start a new growth with the target at 0.7636.

AUDUSD
Risk Warning: the result of previous trading operations do not guarantee the same results in the future

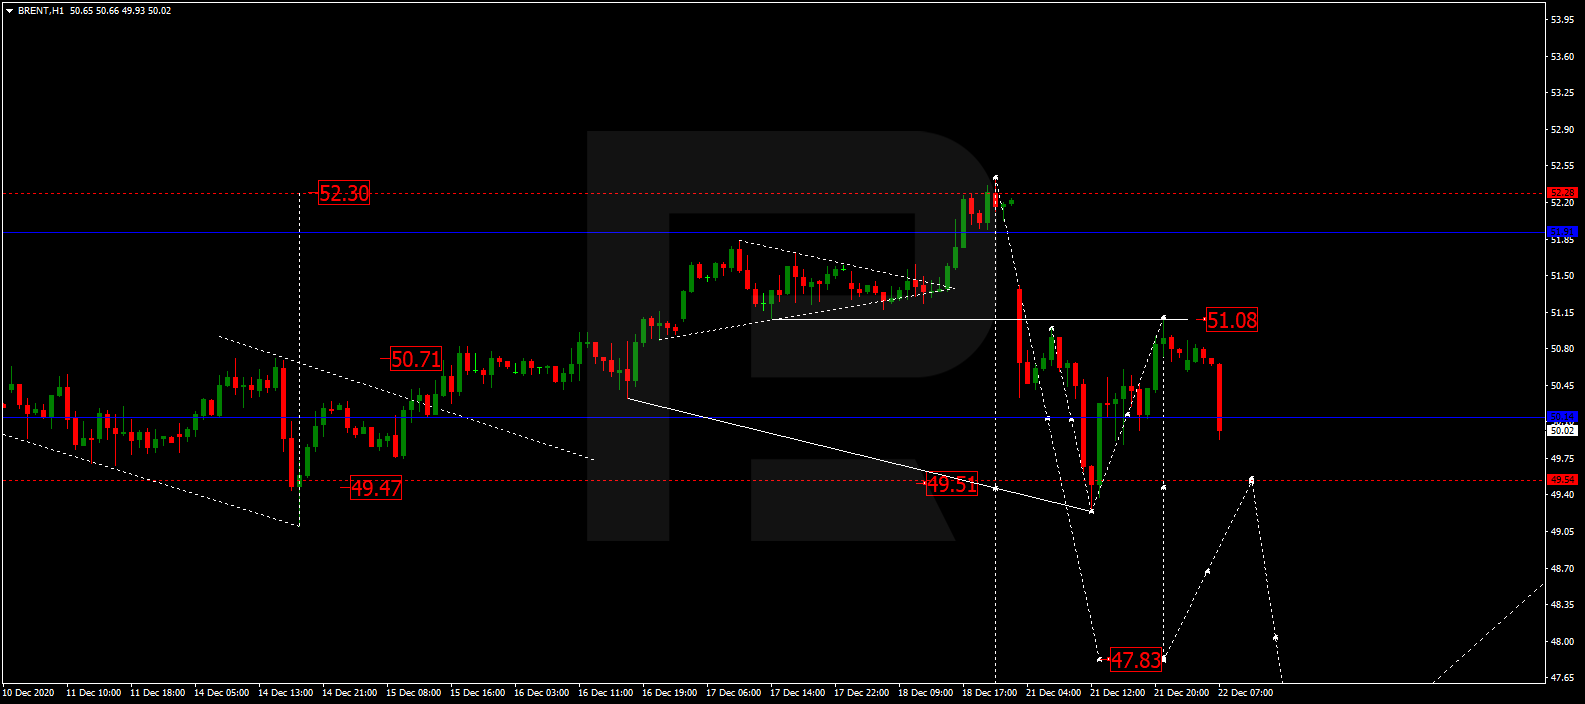
BRENT

After completing another descending structure at 49.50, Brent has tested 51.08 from below and may later fall towards 50.00, thus forming a new consolidation range between these two levels. If later the price breaks this range to the downside; the market may continue the correction to reach 47.84; if to the upside – resume trading upwards to break 52.85 and then continue growing with the target at 55.00.

BRENT
Risk Warning: the result of previous trading operations do not guarantee the same results in the future

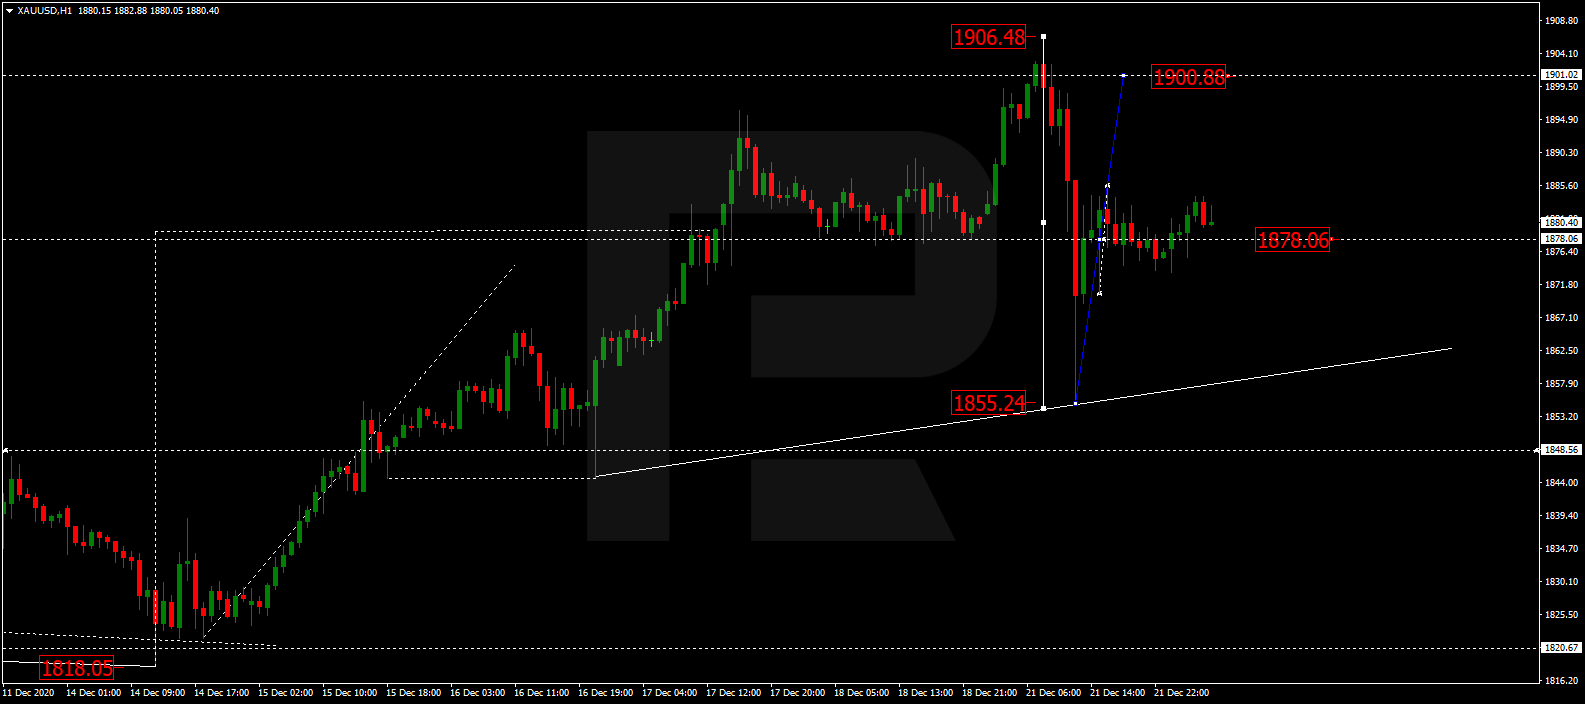
XAUUSD, “Gold vs US Dollar”

After finishing the ascending wave at 1906.48 and then falling towards 1855.25, Gold has formed one more ascending structure to reach 1878.00; right now, it is forming a new consolidation range between the latter level. If later the price breaks this range to the downside at 1870.00; the market may form a new descending structure to break 1850.00 and then continue trading downwards to reach 1820.66; if to the upside at 1886.00 – resume trading upwards with the target at 1900.00 and then start another decline towards 1750.00.

GOLD
Risk Warning: the result of previous trading operations do not guarantee the same results in the future

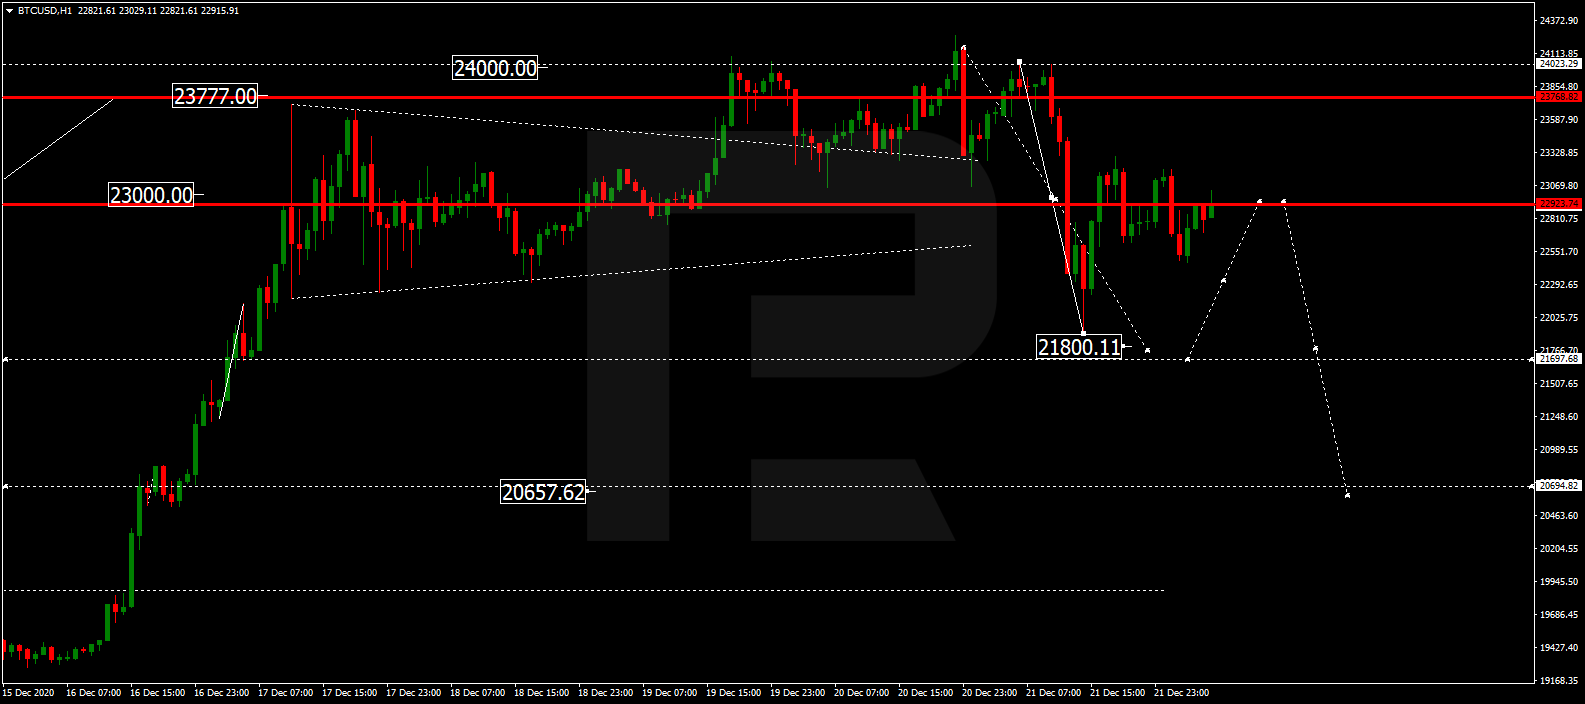
BTCUSD, “Bitcoin vs US Dollar”

BTCUSD continues falling to reach 21800.00 and may later correct towards 22900.00, thus forming a new consolidation range between these two levels. If later the price breaks this range to the downside; the market may form a new descending structure with the target at 20600.00; if to the upside – resume trading upwards to reach 24700.00 and then start a new decline towards the above-mentioned target.

BITCOIN
Risk Warning: the result of previous trading operations do not guarantee the same results in the future

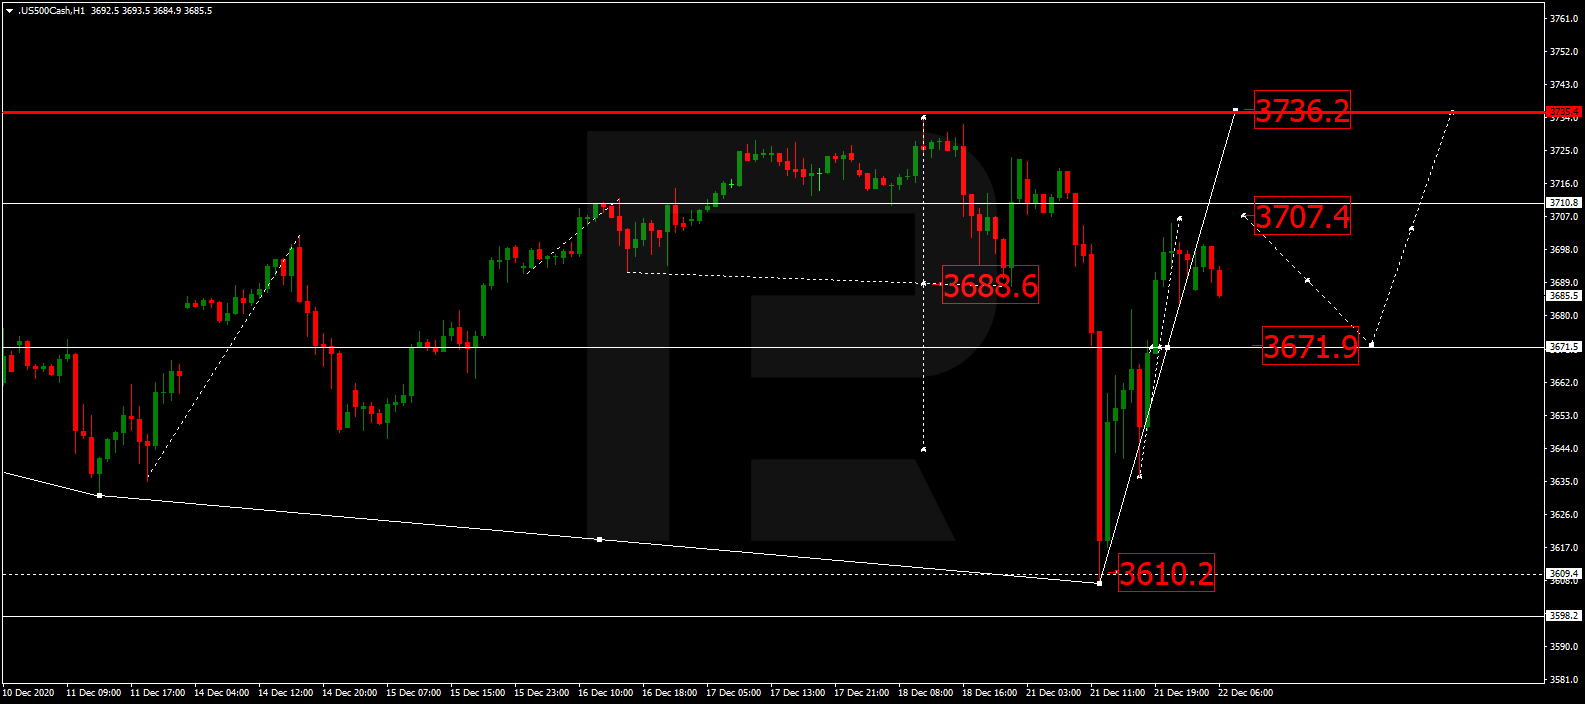
S&P 500

After finishing the descending structure at 3610.2 along with the correction towards 3700.0, the S&P index is falling to reach 3671.9, thus forming a new consolidation range between two latter levels. If later the price breaks this range to the downside; the market may form a new descending structure to reach 3600.0; if to the upside – resume trading upwards with the target at 3737.0.

S&P 500

Article By RoboForex.com

Attention!
Forecasts presented in this section only reflect the author’s private opinion and should not be considered as guidance for trading. RoboForex LP bears no responsibility for trading results based on trading recommendations described in these analytical reviews.

New Coronavirus Variant Darkens Recovery Prospects

By Lukman Otunuga, Research Analyst, ForexTime

Asian stocks tumbled with U.S. futures on Tuesday morning as the swelling coronavirus outbreak and round of lockdowns dampened the outlook for the global economic recovery.

Investors hoping for a ‘Santa clause rally’ may be left empty-handed as rising virus cases and the emergence of a fast-spreading new coronavirus strain in the United Kingdom fuel risk aversion for the rest of 2020. Although U.S. lawmakers have approved a $900 billion pandemic relief package and countries across the globe are rolling out the COVID-19 vaccine, the good news is being overshadowed by current negative developments.

This sentiment is likely to be reflected in European markets as risk aversion encourages market players to maintain a safe distance from equity markets.  S&P 500 futures slipped after the benchmark dropped on Monday and may extend losses if risk-off remains the name of the game.

UK GDP revised up in Q3

The last 36 hours have been chaotic for the British Pound. It has been bashed and thrashed by Brexit related uncertainty and a wave of countries closing their borders to Britain amid tougher lockdown restrictions to fight the new strain of COVID-19. Although the week ahead is likely to be rough and rocky for the Pound due to Brexit talks, there was some good news this morning.

The final reading of the third quarter of 2020 UK GDP came in at 16.0% versus 15.5% expected while on an annualized basis the figure stood at -8.6% vs. -9.6% expected. Sterling picked up fresh bids in reaction to the positive GDP numbers. However, the upside is poised to face many obstacles as investors closely observe Brexit talks.

In our technical outlook on Monday, we discussed the possibility of the GBPUSD rebounding from the 1.3300 support level. Prices are trading around 1.3440 as of writing with the MACD trading to the upside. A daily close above 1.3440 may open the doors back towards the 1.3600 regions.

Dollar steady ahead of US GDP

All eyes will be on the latest GDP date from the United States this afternoon.

Markets expect the third estimation of GDP for Q3 to rise around 33.1% due to an overall increase in consumer spending and fixed asset investments.  Since this estimate is in line with the past two readings, the market reaction could be muted if the report meets expectations. An upside surprise may boost sentiment towards the largest economy in the world, potentially weakening the Dollar amid the improving market mood.

Speaking of the Dollar, it has weakened against every single G10 currency since Monday despite the risk-off sentiment. Although Dollar bulls were inspired by the negative developments revolving around COVID-19, bears gained ample support from the bipartisan breakthrough in U.S. stimulus talks.

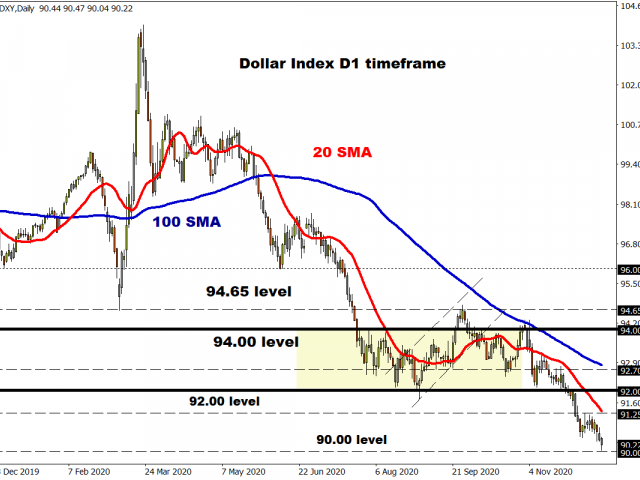
Looking at the technical picture, the Dollar Index (DXY) is under pressure on the daily charts with prices wobbling above the 90.00 support level. A breakdown below this point may inspire a decline towards 88.00. Should 90.00 prove to be reliable support, the DXY could have a shot at testing 91.00 in the short to medium term.

Disclaimer: The content in this article comprises personal opinions and should not be construed as containing personal and/or other investment advice and/or an offer of and/or solicitation for any transactions in financial instruments and/or a guarantee and/or prediction of future performance. ForexTime (FXTM), its affiliates, agents, directors, officers or employees do not guarantee the accuracy, validity, timeliness or completeness, of any information or data made available and assume no liability as to any loss arising from any investment based on the same.


Forex-Time-LogoArticle by ForexTime

ForexTime Ltd (FXTM) is an award winning international online forex broker regulated by CySEC 185/12 www.forextime.com