
Author: Dmitriy Gurkovskiy, Chief Analyst at RoboForex
On Monday, October 12th, 2020, the British Pound remains “in the black” and is primed for consolidation. The instrument is mostly trading at 1.3038.
The Pound had a positive reaction to the GDP report published by the United Kingdom last Friday. The indicator showed +2.1% m/m in August after adding 6.4% m/m the month before. Of course, the previous reading was better but it didn’t upset market layers due to the fact that the GDP had been improving for the fourth consecutive time – it’s very positive.
The GDP 3-Month Average expanded by 8.0% 3m/y and that’s good news: the country’s economy was falling for two quarters in a row.
According to the statistics, in August, the GDP corrected by 21.7% if compared with the decline this April. Of course, this reading is rather relative but it provides insight into what is happening in the British economy, which is recovery nut not as fast as wished it to be.
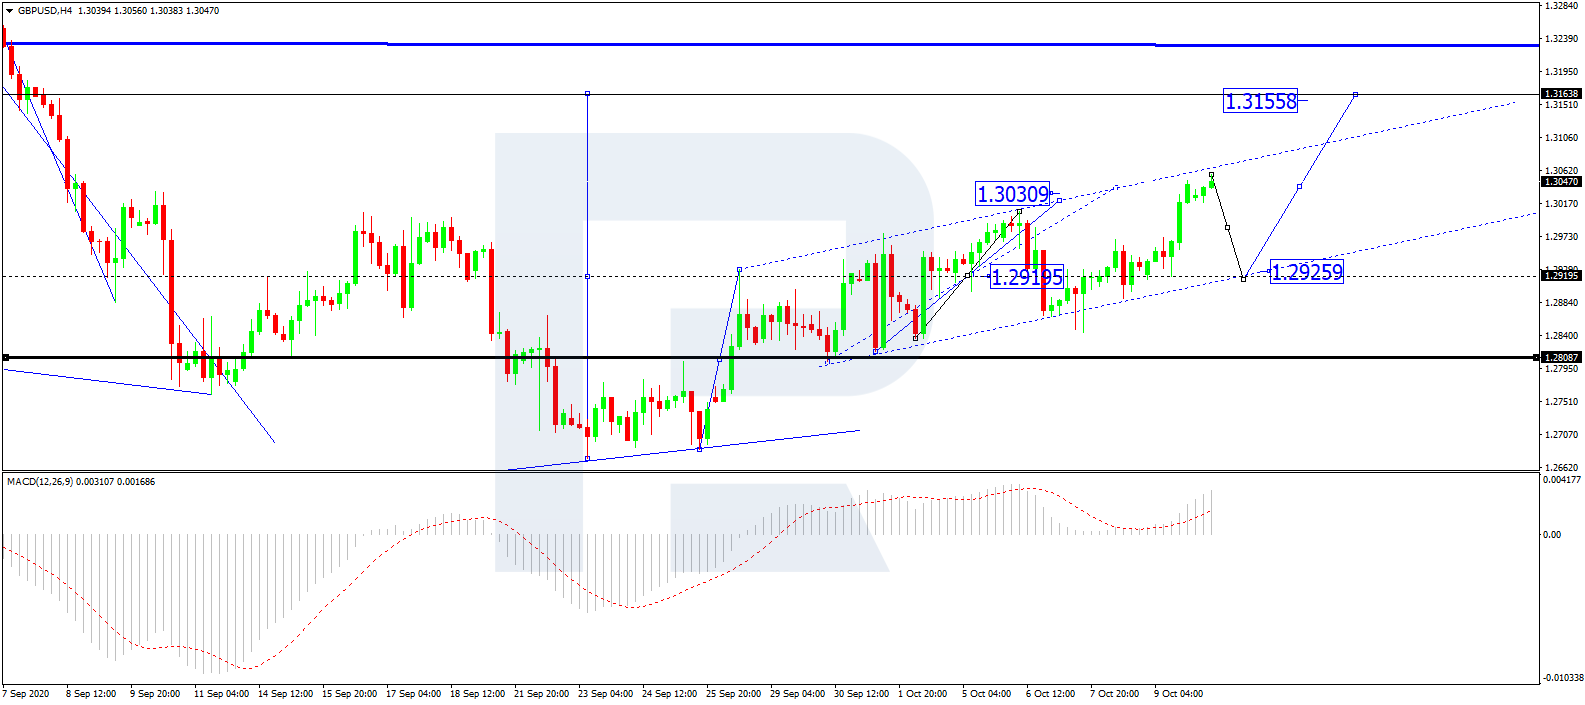
As we can see in the H4 chart, GBP/USD has broken 1.2920 to the upside. The entire structure formed around this level may be considered as a wide consolidation range, which, in its turn, may be considered as an upside continuation pattern. Possibly, the pair may continue the correction. After growing and reaching the short-term at 1.3030, the asset is expected for a narrow consolidation range close to the highs. If later the price breaks this range to the downside, the market may correct towards 1.2922 and then form one more ascending wave with the target at 1.3155. From the technical point of view, this scenario is confirmed by MACD Oscillator: its signal line is moving not far from the highs. Later, the line is expected to leave the histogram area and start falling towards 0. A breakout of this level to the downside may boost the descending correction on the price chart.
Free Reports:
 Sign Up for Our Stock Market Newsletter – Get updated on News, Charts & Rankings of Public Companies when you join our Stocks Newsletter
 Get our Weekly Commitment of Traders Reports - See where the biggest traders (Hedge Funds and Commercial Hedgers) are positioned in the futures markets on a weekly basis.
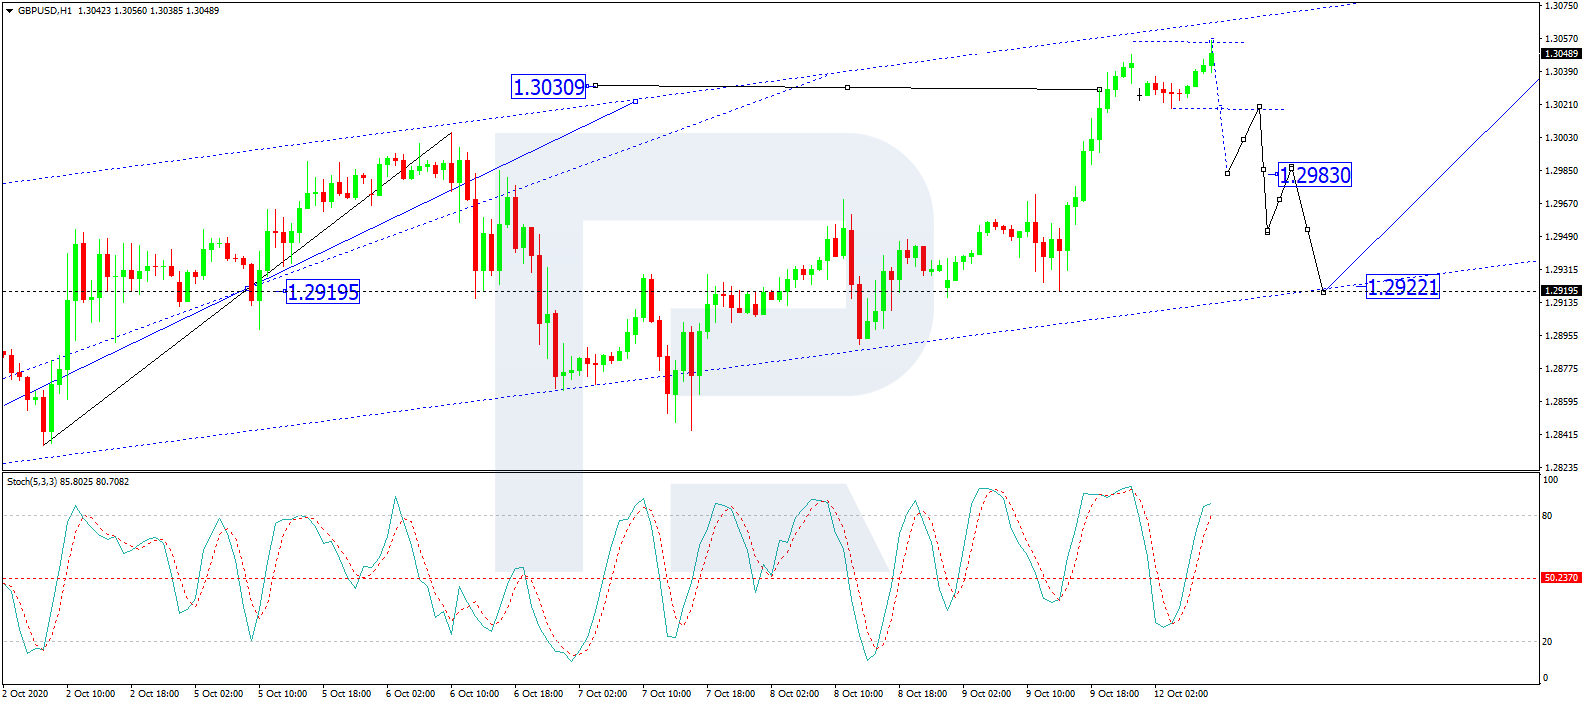
In the H1 chart, after reaching the target of the third ascending wave at 1.3030, GBP/USD is consolidating around this level. Possibly, the pair may break the range to the downside and correct in the form of a wide Flag pattern with the target at 1.2922. From the technical point of view, this scenario is confirmed by Stochastic Oscillator: its signal line has rebounded from 80 to the downside, which suggests that the market is moving within the “overbought area” and the line may start a new decline towards 50. If later the line breaks this level, it will continue moving to reach 20.
Disclaimer
Any forecasts contained herein are based on the author’s particular opinion. This analysis may not be treated as trading advice. RoboForex bears no responsibility for trading results based on trading recommendations and reviews contained herein.

- Geopolitical and macroeconomic conditions continue to pressure market sentiment Jul 20, 2026
- USD/JPY Poised to Continue Gains as Expensive Oil and Lack of Support Weigh on Yen Jul 20, 2026
- COT Metals Charts: Weekly Speculator Bets led by Copper & Steel Jul 18, 2026
- COT Bonds Charts: Weekly Speculator Bets led by 2-Year, SOFR 3M & 5-Year Bonds Jul 18, 2026
- COT Energy Charts: Weekly Speculator Bets led by Brent Oil & Heating Oil Jul 18, 2026
- COT Soft Commodities Charts: Weekly Speculator Bets led by Wheat, Corn & Soybean Meal Jul 18, 2026
- The Bank of Canada kept its interest rate unchanged. Platinum prices reached a three‑week high Jul 16, 2026
- Stock indices rose after the release of US inflation data. China’s GDP slowed sharply Jul 15, 2026
- GBP/USD Awaits Political News: What Will Happen Next Jul 15, 2026
- USD/JPY Holds at Highs: Pressure Lingers on Yen Jul 14, 2026
