Archive for Forex and Currency News – Page 353

The Analytical Overview of the Main Currency Pairs on 2020.10.13

by JustForex

The EUR/USD currency pair

Technical indicators of the currency pair:
  • Prev Open: 1.18101
  • Open: 1.18105
  • % chg. over the last day: +0.01
  • Day’s range: 1.17783 – 1.18149
  • 52 wk range: 1.0637 – 1.2012

EUR/USD quotes have been declining after prolonged growth. The trading instrument has updated local lows. At the moment, the euro is consolidating in the range of 1.1780-1.1805. Investors expect updates on a new stimulus package in the US, as well as new restrictive measures in Europe and Asia. Further correction of the EUR/USD currency pair is possible. We recommend opening positions from key levels.

The news feed on 2020.10.13:
  • – German ZEW economic sentiment index at 12:00 (GMT+3:00);
  • – Report on inflation in the US at 15:30 (GMT+3:00).
EUR/USD

Indicators do not give accurate signals: the price has crossed the 100 MA.

The MACD histogram has been declining, which indicates the bearish sentiment.

Stochastic Oscillator is in the neutral zone, the %K line has crossed the %D line. There are no signals at the moment.

Trading recommendations
  • Support levels: 1.1780, 1.1755, 1.1725
  • Resistance levels: 1.1805, 1.1830, 1.1860

If the price fixes below 1.1780, further correction of EUR/USD quotes is expected. The movement is tending to 1.1750-1.1730.

An alternative could be the growth of the EUR/USD currency pair to 1.1830-1.1860.

The GBP/USD currency pair

Technical indicators of the currency pair:
  • Prev Open: 1.30228
  • Open: 1.30626
  • % chg. over the last day: +0.26
  • Day’s range: 1.30146 – 1.30681
  • 52 wk range: 1.1409 – 1.3516

The GBP/USD currency pair has become stable after a prolonged rally. At the moment, the British pound is consolidating. Local support and resistance levels are 1.3010 and 1.3055, respectively. In the near future, a technical correction of the trading instrument is possible. Investors expect up-to-date information on the Brexit issue. Positions should be opened from key levels.

The UK published ambiguous labor market data.

GBP/USD

Indicators do not give accurate signals: the price has crossed the 50 MA.

The MACD histogram is near the 0 mark. There are no signals at the moment.

Stochastic Oscillator is in the neutral zone, the %K line has crossed the %D line. There are no signals at the moment.

Trading recommendations
  • Support levels: 1.3010, 1.2970, 1.2925
  • Resistance levels: 1.3055, 1.3080, 1.3100

If the price fixes above 1.3055, further growth of the GBP/USD currency pair is expected. The movement is tending to 1.3100-1.3120.

An alternative could be the correction of GBP/USD quotes to 1.2970-1.2950.

The USD/CAD currency pair

Technical indicators of the currency pair:
  • Prev Open: 1.31286
  • Open: 1.31096
  • % chg. over the last day: -0.15
  • Day’s range: 1.31071 – 1.31452
  • 52 wk range: 1.2949 – 1.4669

The USD/CAD currency pair has become stable after a prolonged fall. At the moment, the trading instrument is consolidating. Financial market participants expect additional drivers. The key support and resistance levels are 1.3100 and 1.3150, respectively. In the near future, a technical correction is possible. Positions should be opened from key levels.

The news feed on Canada’s economy is calm.

USD/CAD

Indicators do not give accurate signals: the price has crossed the 50 MA.

The MACD histogram is near the 0 mark. There are no signals at the moment.

Stochastic Oscillator is in the neutral zone, the %K line has crossed the %D line. There are no signals at the moment.

Trading recommendations
  • Support levels: 1.3100, 1.3050
  • Resistance levels: 1.3150, 1.3185, 1.3225

If the price fixes below 1.3100, a further drop in USD/CAD quotes is expected. The movement is tending to 1.3070-1.3050.

An alternative could be the growth of the USD/CAD currency pair to 1.3185-1.3220.

The USD/JPY currency pair

Technical indicators of the currency pair:
  • Prev Open: 105.754
  • Open: 105.336
  • % chg. over the last day: -0.31
  • Day’s range: 105.271 – 105.499
  • 52 wk range: 101.19 – 112.41

USD/JPY quotes show a negative trend. The trading instrument has updated local lows. At the moment, the USD/JPY currency pair is consolidating in the range of 105.25-105.50. The trading instrument has the potential for further decline. We recommend paying attention to the dynamics of US government bonds yield. Positions should be opened from key levels.

The news feed for Japan’s economy is calm.

USD/JPY

Indicators signal the power of sellers: the price has fixed below 50 MA and 100 MA.

The MACD histogram is in the negative zone, but above the signal line, which gives a weak signal to sell USD/JPY.

Stochastic Oscillator is in the neutral zone, the %K line has crossed the %D line. There are no signals at the moment.

Trading recommendations
  • Support levels: 105.25, 105.00
  • Resistance levels: 105.50, 105.65, 105.80

If the price fixes below 105.25, a further fall in USD/JPY quotes is expected. The movement is tending to 105.00-104.80.

An alternative could be the growth of the USD/JPY currency pair to 105.70-105.90.

by JustForex


This article reflects a personal opinion and should not be interpreted as an investment advice, and/or offer, and/or a persistent request for carrying out financial transactions, and/or a guarantee, and/or a forecast of future events.

FCA and BoE encourage liquidity providers to move towards SONIA

By ForexNewsNow

The Financial Conduct Authority and the Bank of England which are leading financial institutions in Britain decided to support liquidity providers to make some changes and start quoting SONIA instead of LIBOR. They encourage adopting these new quoting conventions in the sterling swaps for the liquidity providers from the end of October. The financial institutions openly support SONIA-based inter-dealer trading which means focusing on traders where there is no official exchange or market maker system.

As experts at Bloomberg suppose, the reasons for the plan of both financial institutions can be connected to Brexit. It is said that these new conventions that FCA and BoE are pushing for are in preparation for Brexit sell-offs which they would like to make as available as possible so that the curve corrects as fast as possible. But it’s not only about Brexit. According to this report, this will also weed out some financial service providers who are not necessarily following the rules too well. Should the plan from the Financial Conduct Authority fail, it’s likely that the leverage offers with most brokers are going to decrease because they can’t provide that much liquidity anymore. But if it succeeds, then it should remain the same. However, it’s for this time it’s highly unlikely that these new conventions will succeed considering the rates of market liquidity of some of the British financial service providers.

The above-mentioned initiative of British financial institutions is not only the case. Besides, adopting this new quoting convention, British financial institutions also plan to promote further movement in market liquidity. For the end of 2021, they plan to completely shift toward SONIA swaps and stop using LIBOR. The key point for refusing LIBOR and making this move is to prevent linear derivatives connected to the new GBP LIBOR from starting. However, this change doesn’t apply to the risk management of already existing positions.

This type of development is sure to add a bit more complication to the creation of an online trading account as almost every broker will have to now re-adjust their services to suit this decision from the BoG and FCA. This may also limit the trading capabilities of large retail traders, but not by much. As long as the SONIA requirements are met, only market makers will see a huge shift in their volumes for the GBP in particular.

General influence on trading

The biggest issue for traders is going to be the massive shift in lucidity capacity for many non-market-maker service providers. These companies usually employ liquidity providers in order to process their client orders as fast as possible and make leverage more readily available for the population. Due to such major shifts to SONIA, it’s likely that most retail brokers will have to lower their leverage cap due to impossible liquidity caps. This then directly translates into much fewer profits for FX traders considering the massive curve movements that we can anticipate during the Brexit transitions. People will still have the ability to take advantage of such a volatile situation, but not nearly as much as before the SONIA shift. On the other hand, though, it may also be a good idea as the unpredictability of the Brexit transition could cause mass zero-outs for retail FX traders as they place the wrong trade at the wrong time with too much leverage. It’s a very iffy situation thus forcing the FCA to go with the safer route as it always does.

Possible threat to the BoG and FCA initiative

What can be an interfering factor in any new initiative today if not the Coronavirus pandemic? Not surprisingly,  in this case, COVID-19 is a major threat as well. Spreading the virus delayed the previous plan of the Financial Conduct Authority from happening. FCA had been planning to speed up the change in quoting convention for March 2020 but the pandemic started and it made the plan impossible to be realized. The same thing can happen now as the coronavirus outbreak hasn’t gone anywhere and still bothers anyone in the world. However, now some things have changed and more liquidity providers agree to implement this new convention in comparison with the previous attempt. In fact, in the survey done by the Finance Magnates, 95% of the respondents expressed agreement for the SONIA-first convention switch which is much more than before.

According to Edwin Schooling Latter, head of Markets Policy at the FCA the chances to succeed are higher this time than back to spring. “I encourage as many liquidity providers as possible to join the initiative as we’ve seen a great improvement in the use of SONIA in recent years”. AS he believes, we will be able to see a shift from using LIBOR at the end of 2021.

By ForexNewsNow

The US Dollar Is Consolidating

by JustForex

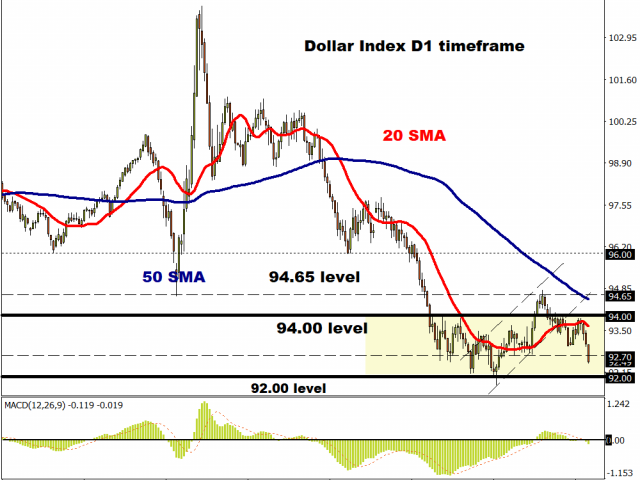
The US currency does not show a defined trend against its main competitors. The dollar index (#DX) closed yesterday’s session with a slight increase (+0.04%). On Friday, the dollar weakened amid hopes that the US could negotiate new incentives to reduce the need for a safe-haven currency. Donald Trump’s administration has offered a new $1.8 trillion economic aid package. However, this offer did not receive government support: Democrats believe that it is not comprehensive enough, and Republicans are worried that it will only increase the country’s accumulated debts. Also, financial market participants are closely following the US election campaign. According to polls, the Democratic presidential candidate Joe Biden is in the lead, while the position of the incumbent President Donald Trump is rapidly deteriorating.

On Monday, the Chinese yuan weakened after the People’s Bank of China said it would cut the reserve requirement ratio for financial institutions on some forward foreign exchange transactions. Today, during the Asian trading session, quite ambiguous economic data have been published in the PRC. The volume of exports increased by 9.9% in September, while experts expected growth by 10.0%. At the same time, the volume of imports increased by 13.2% in September, which turned out to be better than the forecasted growth by 0.3%. The trade surplus counted to 37.00B instead of 58.00B.

The “black gold” prices have become stable. At the moment, futures for the WTI crude oil are testing the $39.65 mark per barrel.

Market indicators

Yesterday, there was the bullish sentiment in the US stock market: #SPY (+1.61%), #DIA (+0.88%), #QQQ (+3.09%).

The 10-year US government bonds yield is consolidating. The indicator has reached 0.75-0.76%.

The news feed for 2020.10.13:
  • – UK labor market data at 09:00 (GMT+3:00);
  • – German ZEW economic sentiment index at 12:00 (GMT+3:00);
  • – US inflation report at 15:30 (GMT+3:00).

by JustForex


This article reflects a personal opinion and should not be interpreted as an investment advice, and/or offer, and/or a persistent request for carrying out financial transactions, and/or a guarantee, and/or a forecast of future events.

Technical Outlook: Pound Crosses in Focus

By Lukman Otunuga, Research Analyst, ForexTime

Anyone else feeling that this will be a week to remember for the British Pound?

As Boris Johnson’s October 15th Brexit deadline looms, fears remain elevated over a messy divorce between the United Kingdom and the European Union by the end of 2020. Earlier today we covered the fundamentals influencing the Pound, now its time for us to take a deep dive into the technicals.

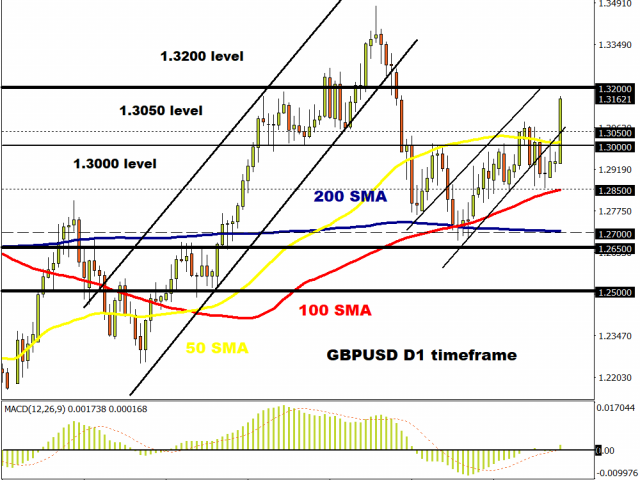
It is safe to say that since July 2016 (one month after the historic referendum), the GBPUSD has resided within a very wide range with support around 1.2100 and resistance around 1.3140. There was a period during early 2018 were prices sprinted through this resistance to punch above 1.4100 before later tumbling back below 1.3140 as Brexit drama intensified.

Looking at the monthly timeframe, 1.2850 has acted as a dynamic level over the past few years, constantly switching between support and resistance. Should this level act as support this month, the GBPUSD could push higher towards 1.3140 which is roughly 350 pips away from current prices.


Zooming straight into the daily, the GBPUSD is bullish. There has been consistently higher highs and higher lows while prices are trading above the 100 & 200 Simple Moving Average. If prices can keep above 1.3000, the next key levels of interest rate may be found around 1.31000 and just below 1.3200. Alternatively, a decline towards 1.3000 could open the doors back toward 1.2830 and 1.2700.


Given the significance of the EU Summit taking place on October 15th, there could be some spice and action on the GBPJPY. If uncertainty boosts appetite for the safe-haven Yen, this could cap the GBPJPY ascent below 137.90. However, a solid breakout above this support may open the doors wide open towards 139.00. Prices are already above the 100 SMA while the MACD is in the process of crossing to the upside. 


Did someone say breakout? Well, it may be slightly early for that on the GBPAUD but support can be found at 1.7850 and resistance at 1.8400. Where the GBPAUD concludes this week will be influenced by what happens on Thursday. A solid daily close above 1.8100 may signal a move higher over the next few days.


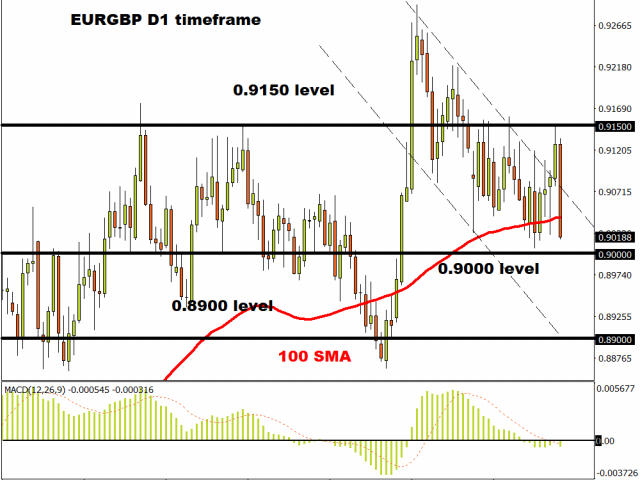
Lastly, let us not forget about the EURGBP. Prices are trading around 0.9040 as of writing. A breakdown below 0.9020 could trigger a decline towards 0.8875. Should 0.9020 prove to be reliable support, a rebound back to 0.9150 could be on the cards.


Disclaimer: The content in this article comprises personal opinions and should not be construed as containing personal and/or other investment advice and/or an offer of and/or solicitation for any transactions in financial instruments and/or a guarantee and/or prediction of future performance. ForexTime (FXTM), its affiliates, agents, directors, officers or employees do not guarantee the accuracy, validity, timeliness or completeness, of any information or data made available and assume no liability as to any loss arising from any investment based on the same.


Forex-Time-LogoArticle by ForexTime

ForexTime Ltd (FXTM) is an award winning international online forex broker regulated by CySEC 185/12 www.forextime.com

Fibonacci Retracements Analysis 12.10.2020 (GOLD, USDCHF)

Article By RoboForex.com

XAUUSD, “Gold vs US Dollar”

As we can see in the H4 chart, XAUUSD is forming another rising wave and has almost reached 38.2% fibo. However, this movement should be considered only as a correction. The next upside targets may be 50.0%, 61.8%, and 76.0% fibo at 1962.00, 1988.40, 2020.30 respectively but the price’s reaching the high 2074.50 remains questionable. If the instrument finishes the pullback within the current range, the asset may fall to reach the low at 1848.67 and then the long-term 38.2% and 50.0% fibo at 1836.50 and 1763.40 respectively.

GOLD_H4
Risk Warning: the result of previous trading operations do not guarantee the same results in the future

The H1 chart shows a new rising wave, which has already updated the previous local high. Right now, the pair is approaching 38.2% fibo at 1934.85 and slowing down a bit. However, there are no other signs of a possible reversal, that’s why it’s just a question of time when the asset reaches 50.0% fibo at 1962.00.

GOLD_H1
Risk Warning: the result of previous trading operations do not guarantee the same results in the future

USDCHF, “US Dollar vs Swiss Franc”

As we can see in the H4 chart, after reaching 23.6% fibo, USDCHF is forming a steady descending wave, which may reach 76.0% fibo at 0.9070. The next descending impulse may head to break the low at 0.8999 and then reach the post-correctional extension area between 138.2% and 161.8% fibo at 0.8885 and 0.8816 respectively. However, if the asset fails to break the low, the instrument may rebound and start a new wave to the upside to break the high at 0.9296 and even reach the long-term 38.2% fibo at 0.9472.

USDCHF_H4
Risk Warning: the result of previous trading operations do not guarantee the same results in the future

In the H1 chart, the asset is moving downwards to reach 76.0% fibo. At the same time, there is a convergence on MACD, which may indicate a possible pullback or a reversal soon. The local resistance is at 50.0% fibo at 0.9147: if the pair breaks it, the asset may reverse.

USDCHF_H1

Article By RoboForex.com

Attention!
Forecasts presented in this section only reflect the author’s private opinion and should not be considered as guidance for trading. RoboForex LP bears no responsibility for trading results based on trading recommendations described in these analytical reviews.

Forex Technical Analysis & Forecast 12.10.2020

Article By RoboForex.com

EURUSD, “Euro vs US Dollar”

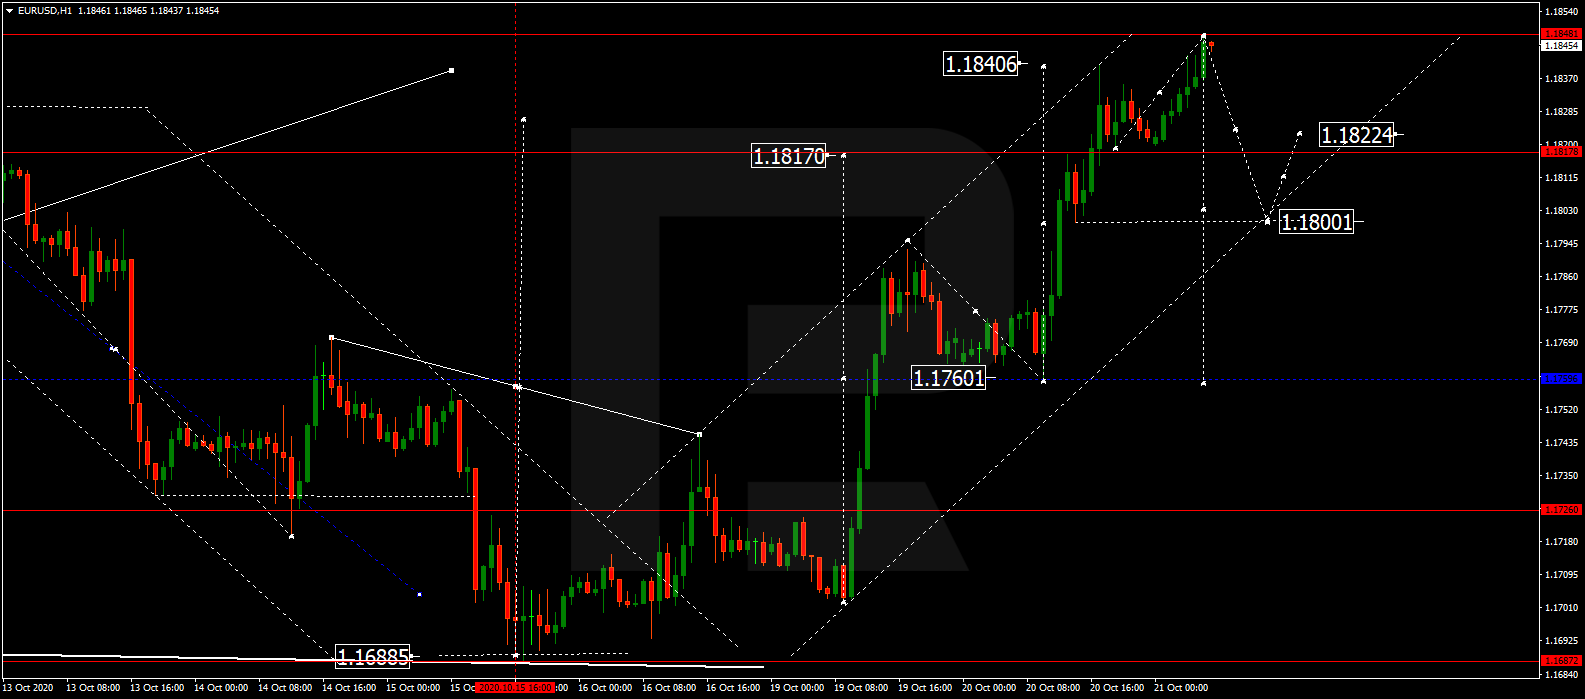
After choosing an alternative scenario and reaching 1.1820, EURUSD is consolidating below this level. Possibly, the pair may break the range to the downside and start a new correction to reach 1.1750. Later, the market may form one more ascending structure with the target at 1.1888.

EURUSD
Risk Warning: the result of previous trading operations do not guarantee the same results in the future

GBPUSD, “Great Britain Pound vs US Dollar”

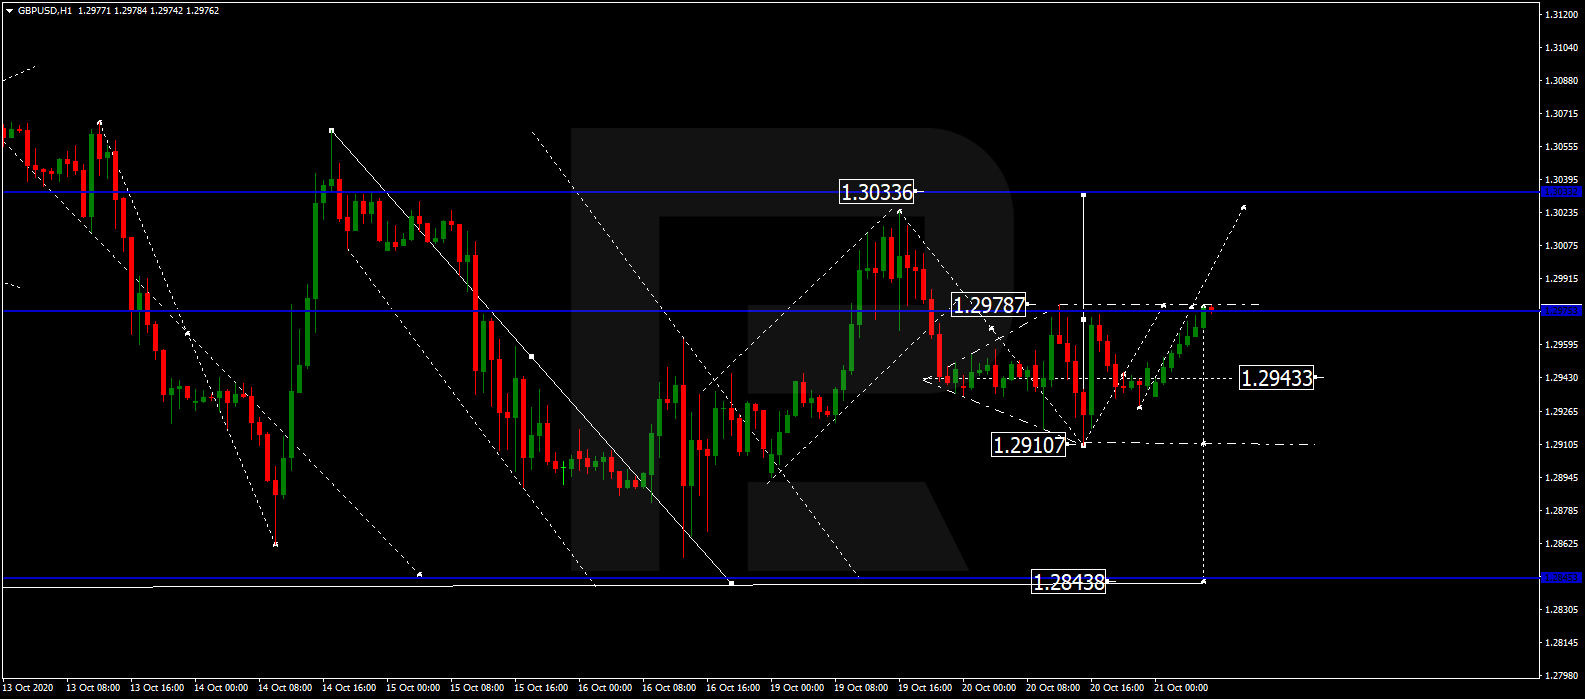
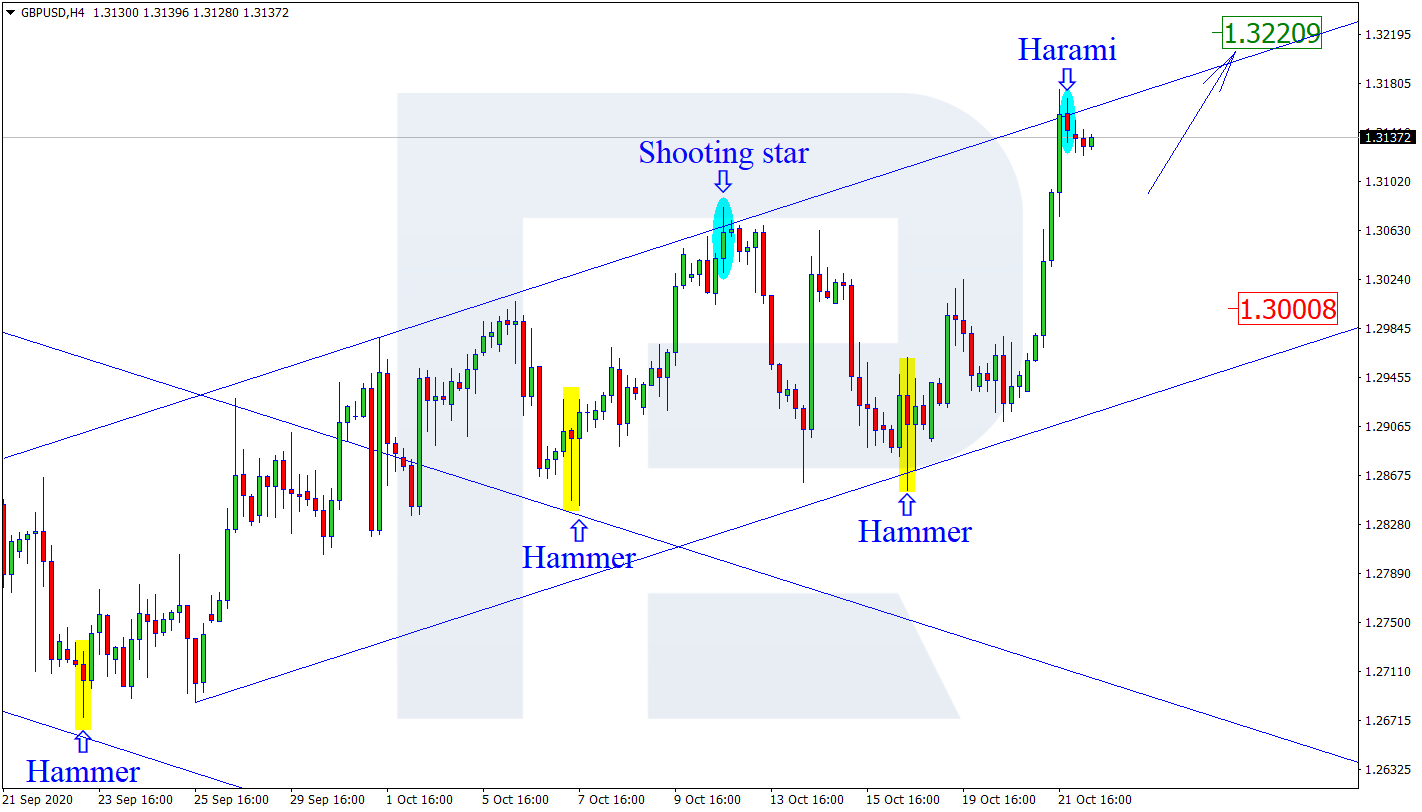
After choosing an alternative scenario and reaching 1.3033, GBPUSD is still consolidating below this level. Today, the pair may break the range to the downside and start another correction with the target at 1.2922. After that, the instrument may resume trading upwards to reach 1.3155.

GBPUSD
Risk Warning: the result of previous trading operations do not guarantee the same results in the future

USDRUB, “US Dollar vs Russian Ruble”

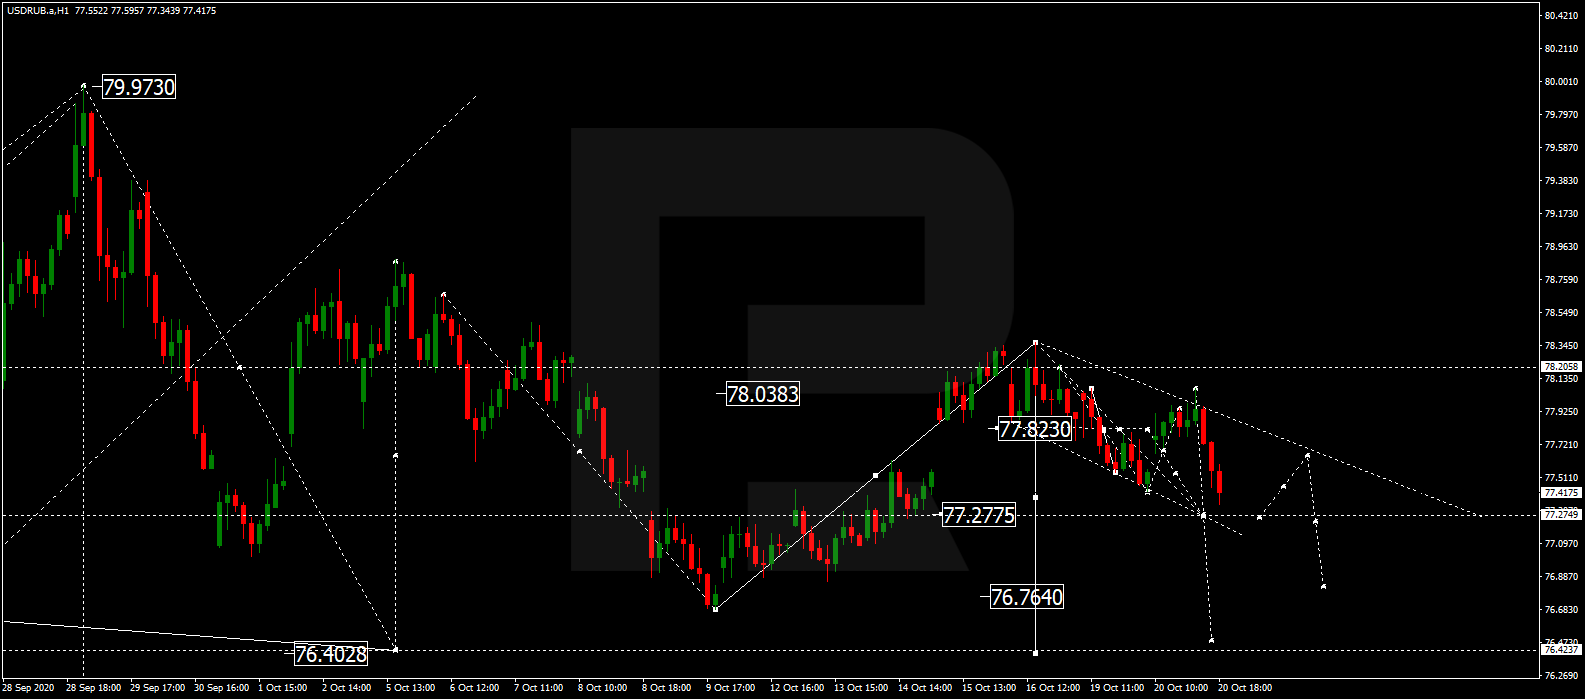
USDRUB continues falling towards 76.40. After reaching this level, the instrument may correct towards 77.30 and then resume falling with the target at 74.04. Later, the market may start another growth to reach 78.16.

USDRUB
Risk Warning: the result of previous trading operations do not guarantee the same results in the future

USDJPY, “US Dollar vs Japanese Yen”

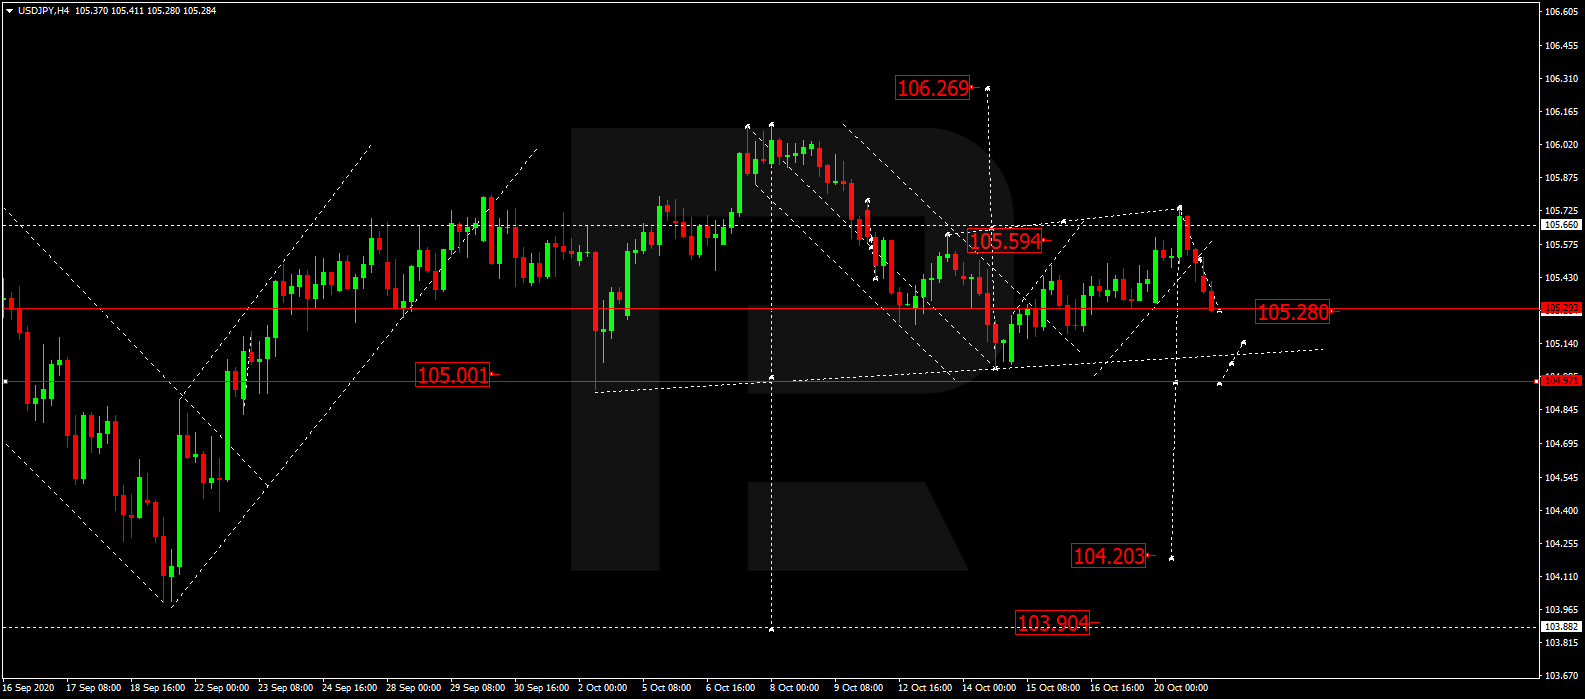
USDJPY is falling with the target at 105.00. After that, the instrument may correct towards 105.50, thus forming a new consolidation range between these two levels. If later the price breaks this range to the downside, the market may start another decline to reach 103.25; if to the upside – resume trading upwards with the target at 106.00.

USDJPY
Risk Warning: the result of previous trading operations do not guarantee the same results in the future

USDCHF, “US Dollar vs Swiss Franc”

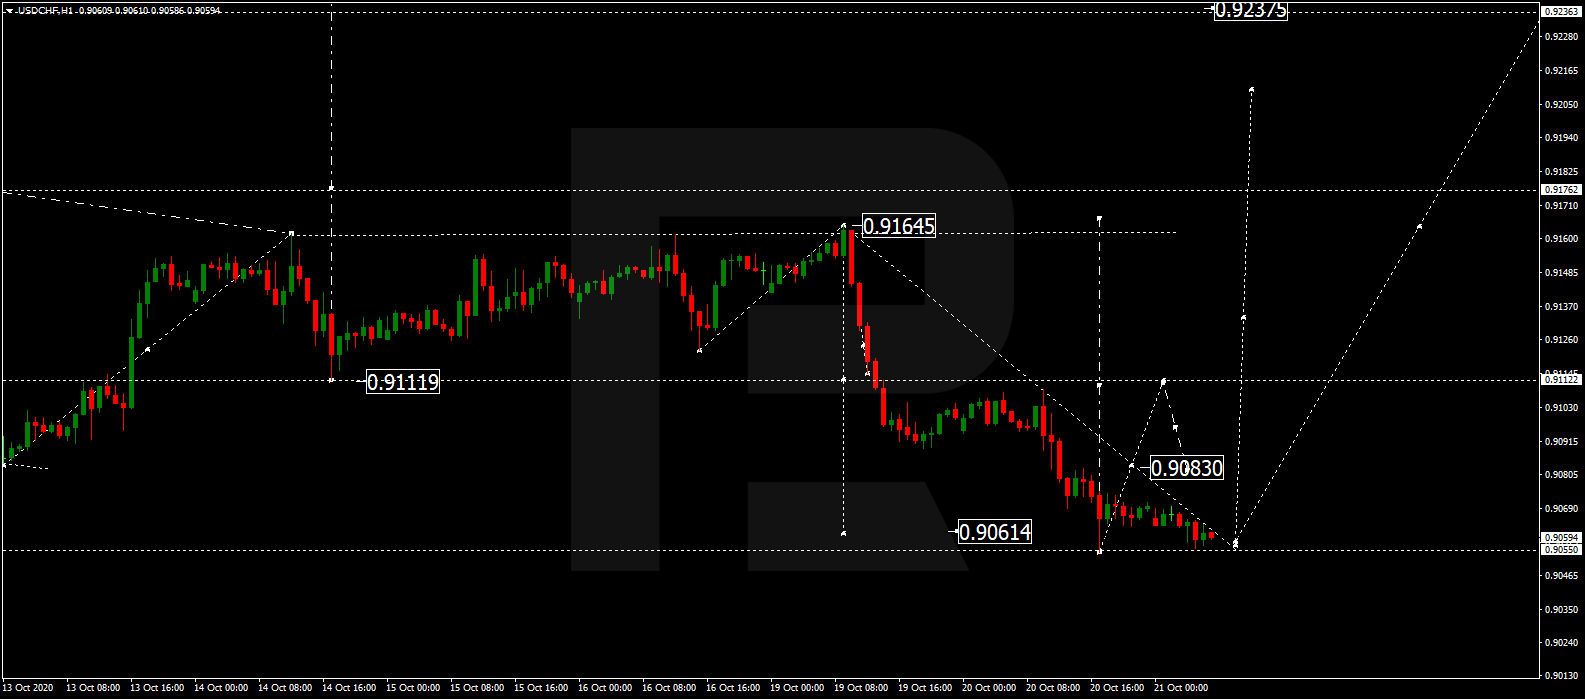
After completing another descending structure at 0.9105, USDCHF is still consolidating around this level. Today, the pair may break the range to the upside and start a new correction towards 0.9175. Later, the market may resume falling with the target at 0.9055.

USDCHF
Risk Warning: the result of previous trading operations do not guarantee the same results in the future

AUDUSD, “Australian Dollar vs US Dollar”

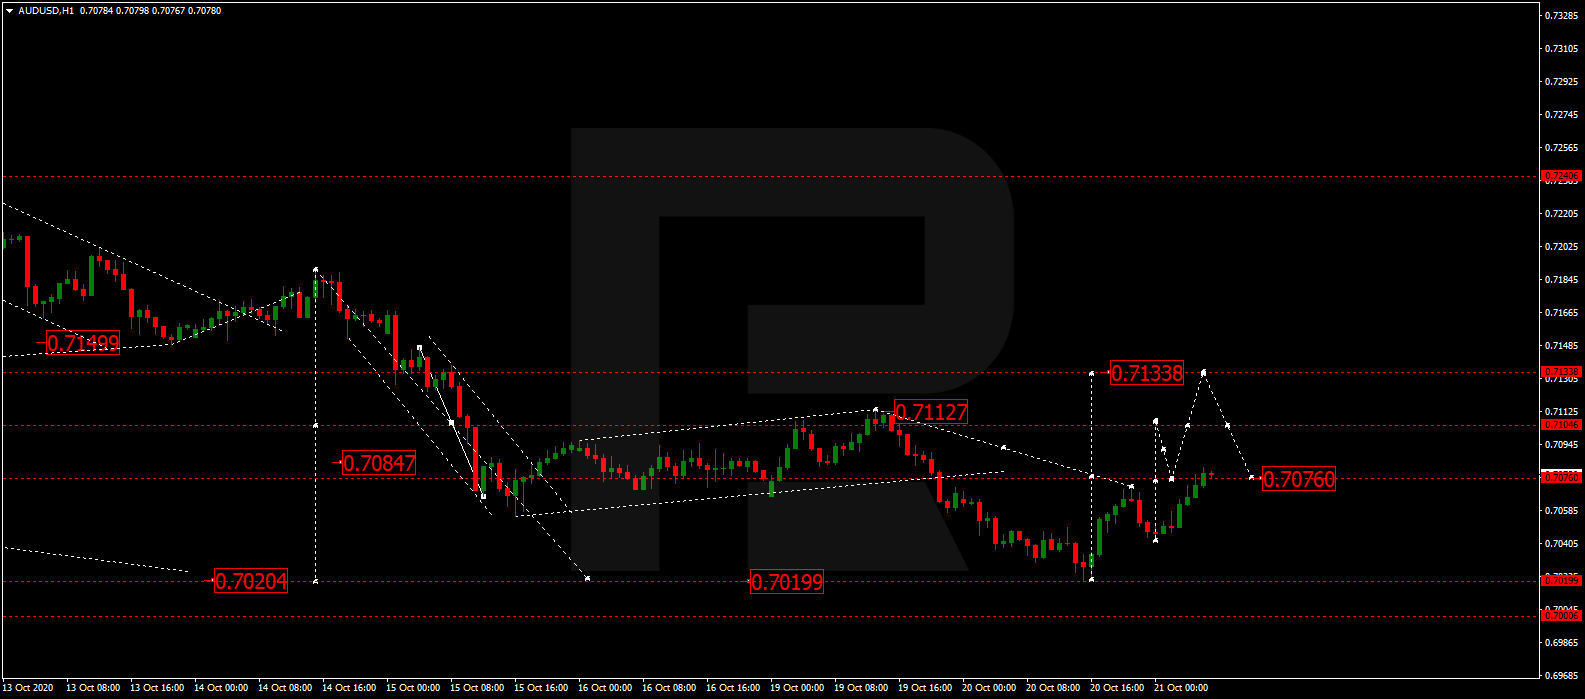
After finishing another ascending structure, at 0.7240, AUDUSD is consolidating below this level. Possibly, today the pair may expand the range up to 0.7255. After that, the instrument may correct towards 0.7155 and then resume trading upwards with the target at 0.7306.

AUDUSD
Risk Warning: the result of previous trading operations do not guarantee the same results in the future

BRENT

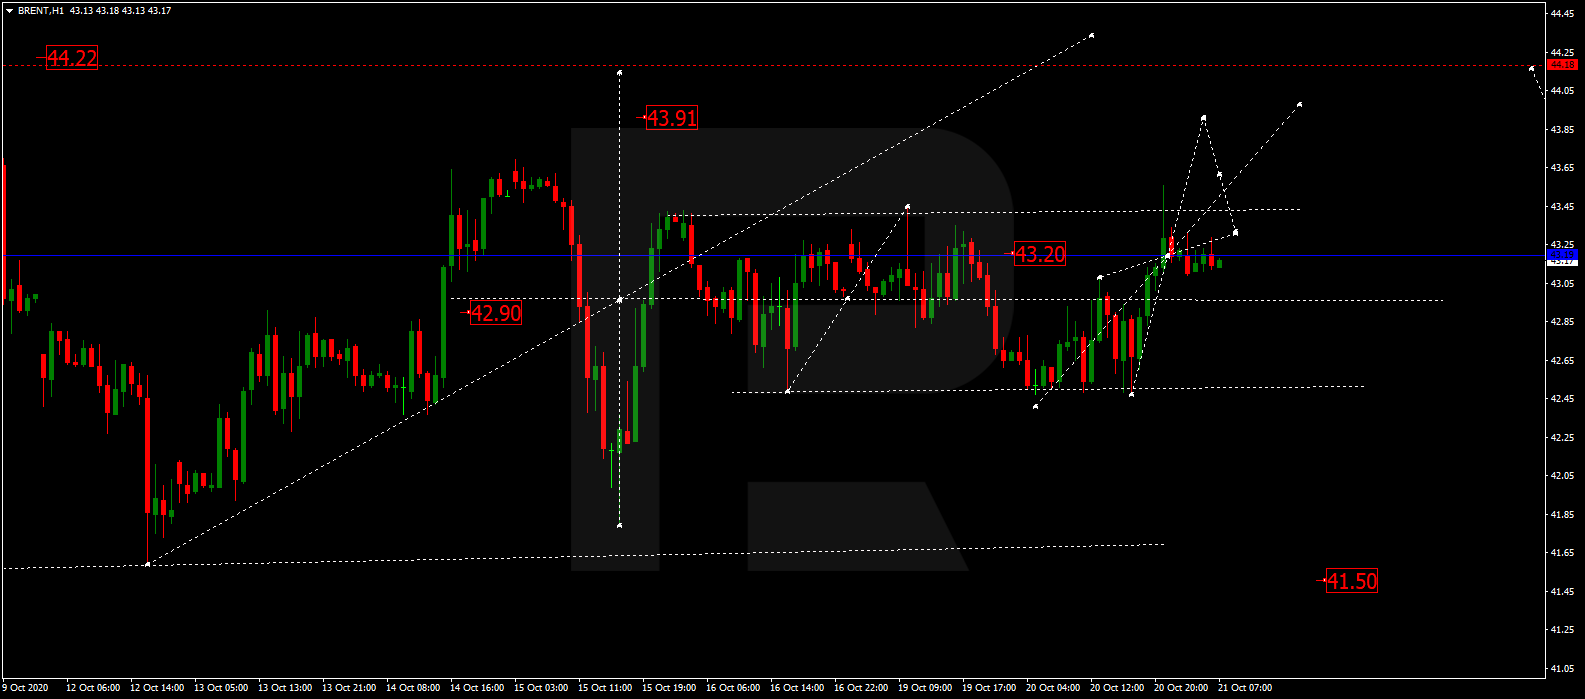
After forming another consolidation range around 43.50 and then breaking it to the downside, Brent is expected to correct towards 41.50. Later, the market may resume growing with the first target at 44.22.

BRENT
Risk Warning: the result of previous trading operations do not guarantee the same results in the future

XAUUSD, “Gold vs US Dollar”

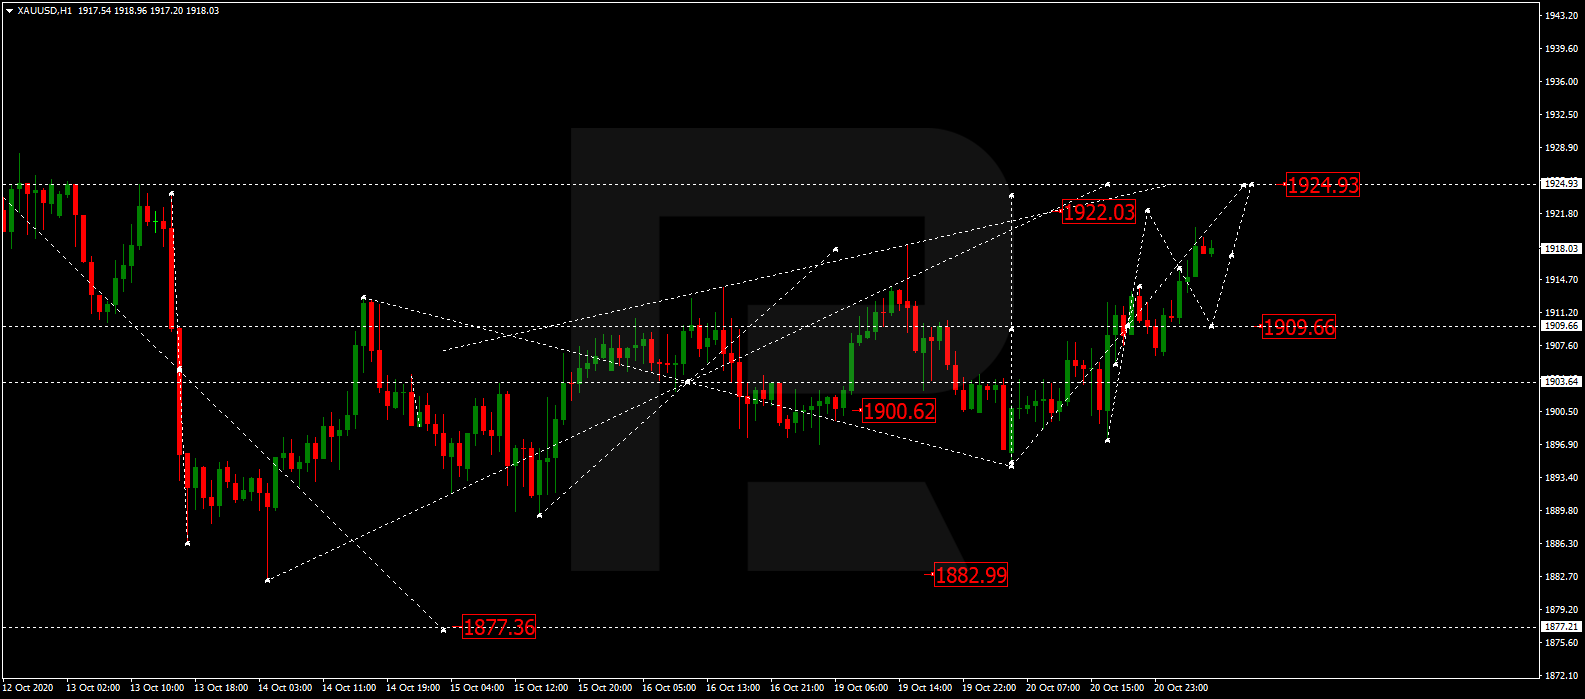
Gold is growing according to an alternative scenario to reach 1933.00. Today, the pair may consolidate around this level and expand the range up to 1935.00. After that, the instrument may correct to reach 1907.50 and then form one more ascending structure with the target at 1942.04.

GOLD
Risk Warning: the result of previous trading operations do not guarantee the same results in the future

BTCUSD, “Bitcoin vs US Dollar”

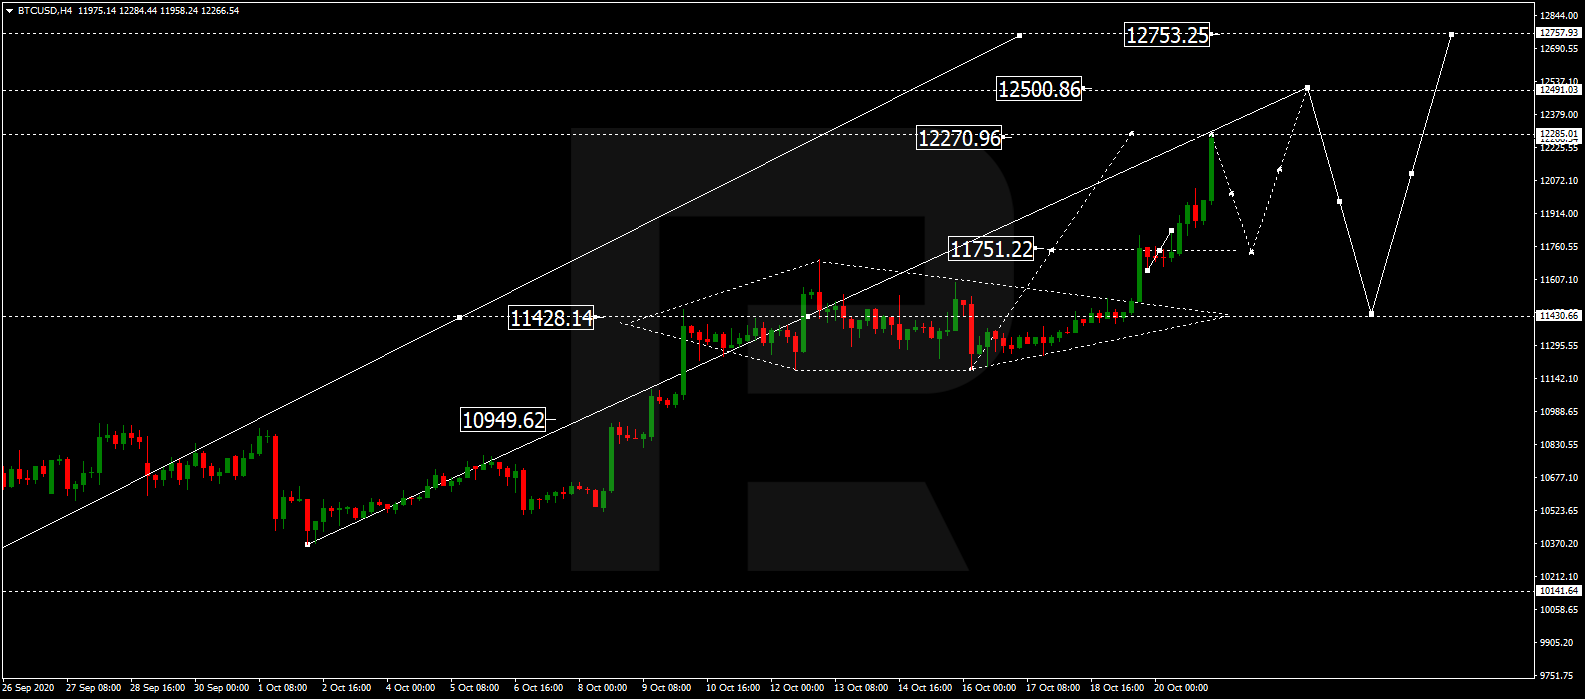
After completing the ascending structure at 10900.00 and forming the consolidation range below this level, BTCUSD has broken it to the upside. Possibly, today the asset may choose an alternative scenario and grow towards 11500.00. Later, the market may form a new descending structure to correct towards 10950.00 and then start another growth with the target at 11800.00.

BITCOIN
Risk Warning: the result of previous trading operations do not guarantee the same results in the future

S&P 500

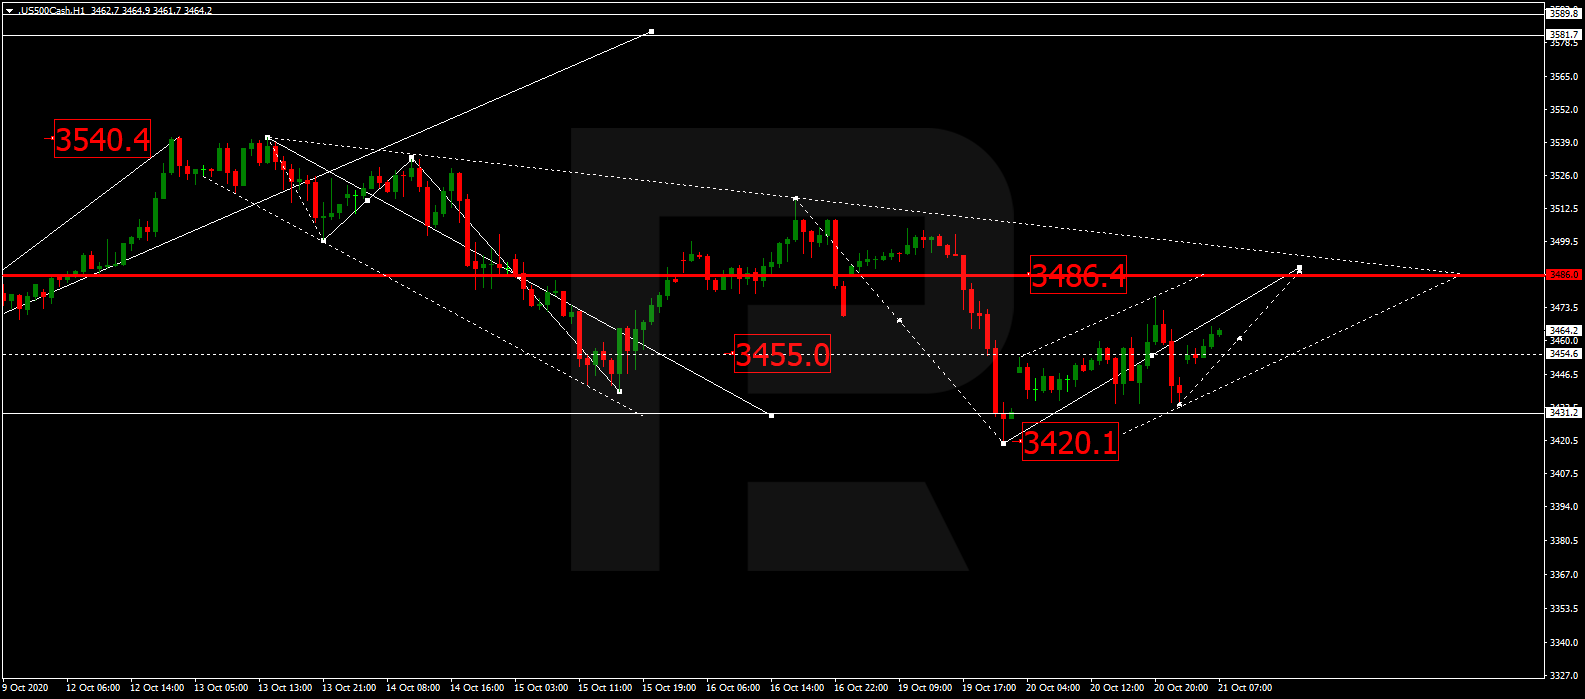
The S&P index is still consolidating around 3470.1. Today, the pair may test this level from above. If later the price breaks this range to the upside, the market may choose an alternative scenario and extend this wave up to 3520.3; if to the downside – start a new correction with the target at 3434.3.

S&P 500

Article By RoboForex.com

Attention!
Forecasts presented in this section only reflect the author’s private opinion and should not be considered as guidance for trading. RoboForex LP bears no responsibility for trading results based on trading recommendations described in these analytical reviews.
The Analytical Overview of the Main Currency Pairs on 2020.10.12

by JustForex

The EUR/USD currency pair

Technical indicators of the currency pair:
  • Prev Open: 1.17572
  • Open: 1.18101
  • % chg. over the last day: +0.56
  • Day’s range: 1.18058 – 1.18267
  • 52 wk range: 1.0637 – 1.2012

The bullish sentiment still prevails on the EUR/USD currency pair. The trading instrument has set new local highs. The euro found resistance at 1.1830. The round level of 1.1800 is already a “mirror” support. Further growth of EUR/USD quotes is possible. Investors continue to monitor the campaigns of Donald Trump and Joe Biden, as well as the adoption of a new stimulus package for the US economy. We recommend opening positions from key levels.

Today, we recommend paying attention to the speech by the ECB President.

EUR/USD

Indicators signal the power of buyers: the price has fixed above 50 MA and 200 MA.

The MACD histogram is in the positive zone, but below the signal line, which gives a weak signal to buy EUR/USD.

Stochastic Oscillator is in the neutral zone, the %K line has started crossing the %D line. There are no signals at the moment.

Trading recommendations
  • Support levels: 1.1800, 1.1780, 1.1755
  • Resistance levels: 1.1830, 1.1860, 1.1900

If the price fixes above 1.1830, further growth of EUR/USD quotes is expected. The movement is tending to 1.1850-1.1880.

An alternative could be a decline in the EUR/USD currency pair to 1.1780-1.1750.

The GBP/USD currency pair

Technical indicators of the currency pair:
  • Prev Open: 1.29113
  • Open: 1.30228
  • % chg. over the last day: -0.12
  • Day’s range: 1.30200 – 1.30595
  • 52 wk range: 1.1409 – 1.3516

GBP/USD quotes show a positive trend. The British pound has overcome the $1.30 mark. At the moment, the trading instrument is consolidating in the range of 1.3000-1.3060. The demand for greenback is still quite low. At the same time, the correction of the GBP/USD currency pair is possible. Financial market participants continue to follow the Brexit negotiations. Positions should be opened from key levels.

We recommend paying attention to the speech by the Bank of England Governor.

GBP/USD

Indicators signal the power of buyers: the price has fixed above 50 MA and 100 MA.

The MACD histogram is in the positive zone, which indicates the bullish sentiment.

Stochastic Oscillator is in the neutral zone, the %K line is below the %D line, which indicates a possible correction of the GBP/USD currency pair.

Trading recommendations
  • Support levels: 1.3020, 1.2990, 1.2965
  • Resistance levels: 1.3060, 1.3100

If the price fixes above 1.3060, further growth of the GBP/USD currency pair is expected. The movement is tending to 1.3100-1.3120.

An alternative could be a drop in the GBP/USD quotes to 1.2990-1.2970.

The USD/CAD currency pair

Technical indicators of the currency pair:
  • Prev Open: 1.31949
  • Open: 1.31286
  • % chg. over the last day: -0.58
  • Day’s range: 1.31166 – 1.31431
  • 52 wk range: 1.2949 – 1.4669

The USD/CAD currency pair continues to show a pronounced downtrend. The trading instrument has updated its local lows again. At the moment, the loonie is consolidating in the range of 1.3110-1.3150. In the near future, a technical correction is possible. We recommend paying attention to the dynamics of “black gold” prices. Positions should be opened from key levels.

The news feed on Canada’s economy is calm.

USD/CAD

Indicators signal the power of sellers: the price has fixed below 50 MA and 100 MA.

The MACD histogram is in the negative zone, but above the signal line, which gives a weak signal to sell USD/CAD.

Stochastic Oscillator is in the neutral zone, the %K line has crossed the %D line. There are no signals at the moment.

Trading recommendations
  • Support levels: 1.3110, 1.3050
  • Resistance levels: 1.3150, 1.3185, 1.3225

If the price fixes below 1.3110, a further fall in USD/CAD quotes is expected. The movement is tending to 1.3070-1.3050.

An alternative could be the growth of the USD/CAD currency pair to 1.3185-1.3220.

The USD/JPY currency pair

Technical indicators of the currency pair:
  • Prev Open: 106.021
  • Open: 105.754
  • % chg. over the last day: -0.40
  • Day’s range: 105.433 – 105.774
  • 52 wk range: 101.19 – 112.41

The USD/JPY currency pair has been declining. The trading instrument has updated local lows. At the moment, USD/JPY quotes are consolidating in the range of 105.45-105.65. The demand for greenback remains at a fairly low level. Further strengthening of the yen against the US currency is possible. We recommend paying attention to the dynamics of US government bonds yield. Positions should be opened from key levels.

The news feed for Japan’s economy is calm.

USD/JPY

Indicators signal the power of sellers: the price has fixed below 100 MA.

The MACD histogram is in the negative zone, which indicates the bearish sentiment.

Stochastic Oscillator is in the neutral zone, the %K line is above the %D line, which gives a signal to buy USD/JPY.

Trading recommendations
  • Support levels: 105.45, 105.25, 105.00
  • Resistance levels: 105.65, 105.80, 105.95

If the price fixes above 105.45, a further fall in USD/JPY quotes is expected. The movement is tending to the round level of 105.00.

An alternative could be the growth of the USD/JPY currency pair to 105.80-106.00.

by JustForex


This article reflects a personal opinion and should not be interpreted as an investment advice, and/or offer, and/or a persistent request for carrying out financial transactions, and/or a guarantee, and/or a forecast of future events.

UK-EU Play Chicken as Brexit Deadline looms

By Han Tan, Market Analyst,ForexTime

“Brexit talks are going down to the wire” – it’s a line that’s been employed far too often in market commentary over recent years. And investors are being hit with such a narrative yet again this week, as UK Prime Minister Boris Johnson’s self-imposed deadline of October 15 looms.

The UK has been trying since March to seal a post-Brexit trade deal with the EU, with little progress to show for it. Over the weekend, PM Johnson reached out to German Chancellor Angela Merkel, and French President Emmanuel Macron, to try and break the deadlock, just days before EU leaders are due to gather for a two-day summit beginning October 15th, where Brexit would surely rank high on the agenda. French government officials are already pushing back, saying they are willing to take a hard Brexit over a bad deal.

When PM Johnson announced his latest deadline back on September 7th, the Pound went on to weaken by some four percent against the Euro, before paring its losses. EURGBP is now testing its 50-day simple moving average (MA) as a key support level.


GBPUSD on the other hand its testing its 50-day MA as a key resistance level, having weakened by as much as 4.5 percent since the looming deadline was unveiled, only for the currency pair to climb some 2.9 percent since its September-bottom.


Although markets are pricing in an uptick in volatility in both EURGBP and GBPUSD over the week, the price swings are expected to be relatively tame compared to extremes over recent years, judging by the 1-week implied volatility for both currency pairs. The keen and seasoned observer would note that delayed deadlines have become somewhat of a norm amid the Brexit saga, and previous displays of brinkmanship have yet to see either side walk away from talks, despite multiple threats of doing so.

Still, that isn’t a line that Sterling can necessarily afford to cross.

Should the UK indeed leave the EU without a trade deal in place by December 31, the repercussions on the Pound would be seismic, potentially sending EURGBP much closer to parity! Still, the FXTM Trader’s Sentiments are overwhelmingly short for EURGBP.

As for GBPUSD, with traders having grown accustomed to Brexit-related blusters, perhaps the November 3 US Presidential elections would have more of an impact on cable. The FXTM Trader’s Sentiments are currently net long on cable.


Disclaimer: The content in this article comprises personal opinions and should not be construed as containing personal and/or other investment advice and/or an offer of and/or solicitation for any transactions in financial instruments and/or a guarantee and/or prediction of future performance. ForexTime (FXTM), its affiliates, agents, directors, officers or employees do not guarantee the accuracy, validity, timeliness or completeness, of any information or data made available and assume no liability as to any loss arising from any investment based on the same.


Forex-Time-LogoArticle by ForexTime

ForexTime Ltd (FXTM) is an award winning international online forex broker regulated by CySEC 185/12 www.forextime.com

Pound Primed for Consolidation

Author: Dmitriy Gurkovskiy, Chief Analyst at RoboForex

On Monday, October 12th, 2020, the British Pound remains “in the black” and is primed for consolidation. The instrument is mostly trading at 1.3038.

The Pound had a positive reaction to the GDP report published by the United Kingdom last Friday. The indicator showed +2.1% m/m in August after adding 6.4% m/m the month before. Of course, the previous reading was better but it didn’t upset market layers due to the fact that the GDP had been improving for the fourth consecutive time – it’s very positive.

The GDP 3-Month Average expanded by 8.0% 3m/y and that’s good news: the country’s economy was falling for two quarters in a row.

According to the statistics, in August, the GDP corrected by 21.7% if compared with the decline this April. Of course, this reading is rather relative but it provides insight into what is happening in the British economy, which is recovery nut not as fast as wished it to be.

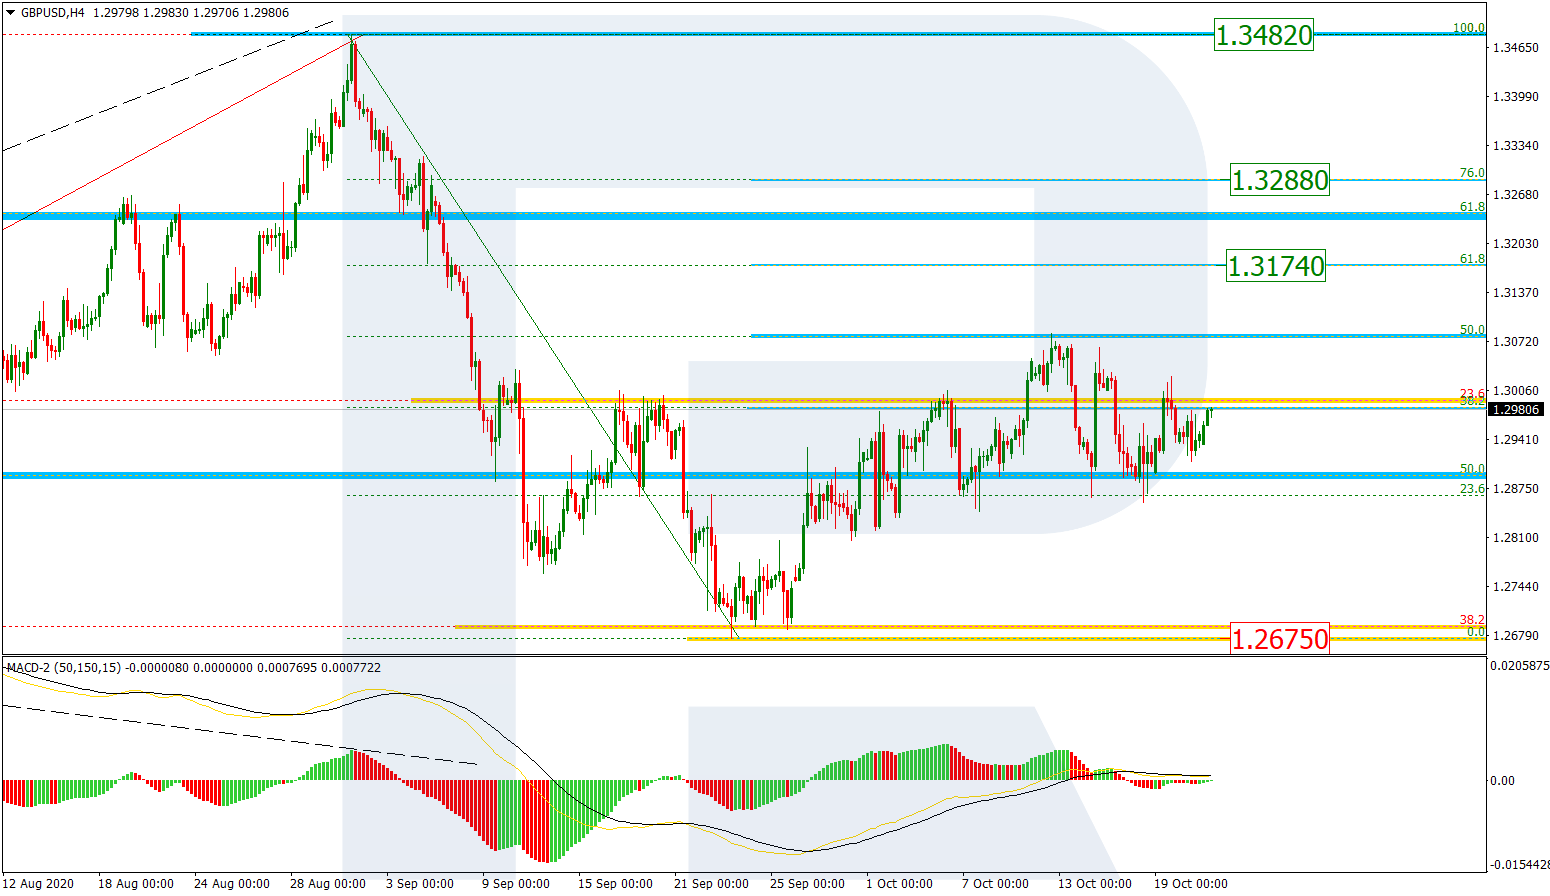
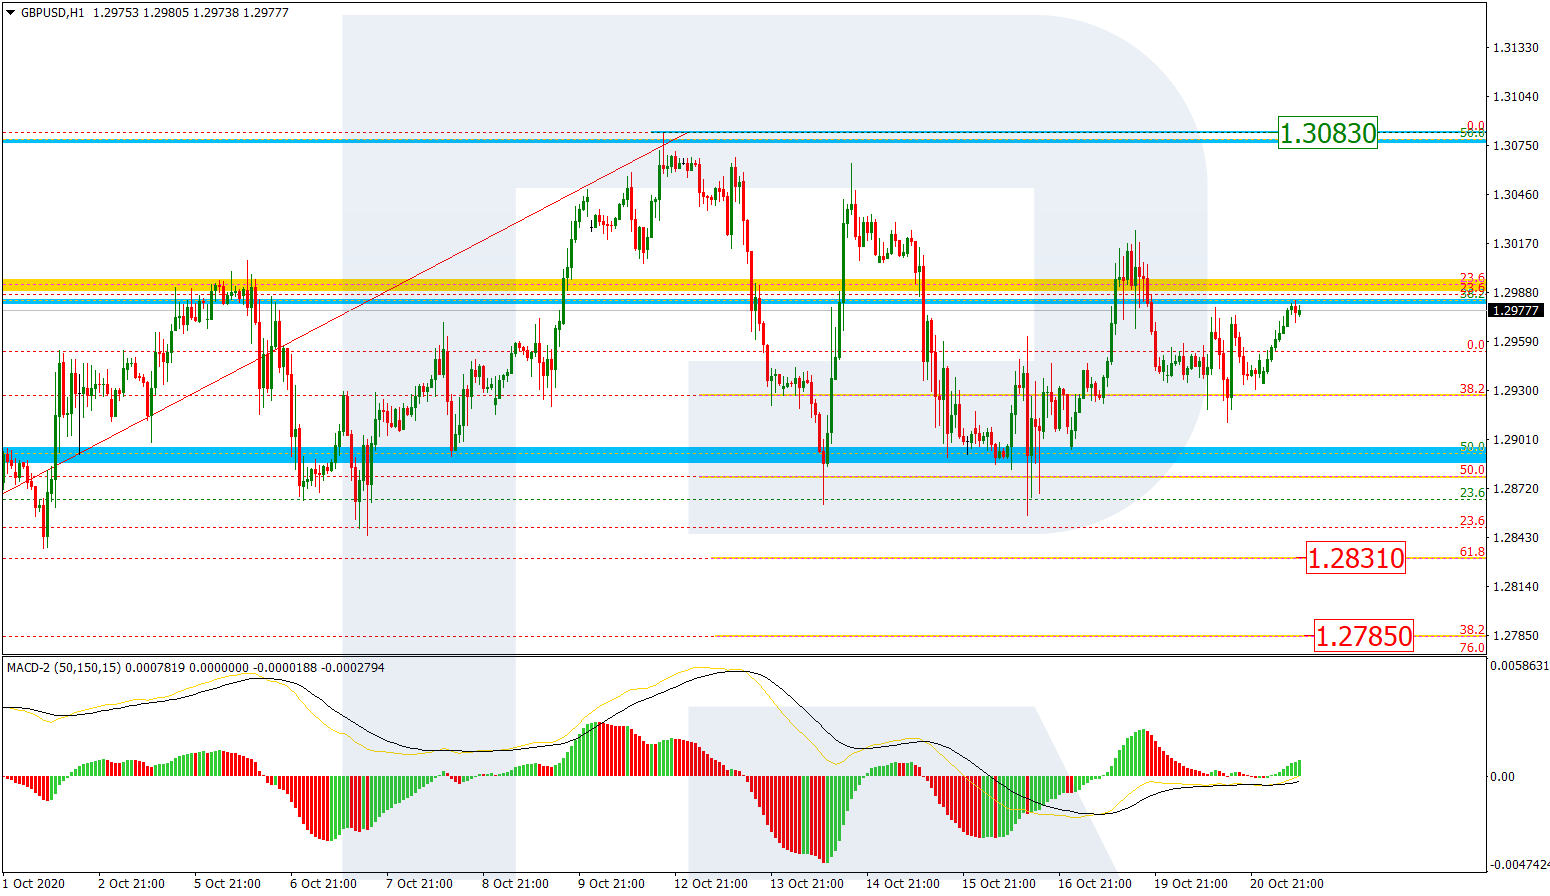
As we can see in the H4 chart, GBP/USD has broken 1.2920 to the upside. The entire structure formed around this level may be considered as a wide consolidation range, which, in its turn, may be considered as an upside continuation pattern. Possibly, the pair may continue the correction. After growing and reaching the short-term at 1.3030, the asset is expected for a narrow consolidation range close to the highs. If later the price breaks this range to the downside, the market may correct towards 1.2922 and then form one more ascending wave with the target at 1.3155. From the technical point of view, this scenario is confirmed by MACD Oscillator: its signal line is moving not far from the highs. Later, the line is expected to leave the histogram area and start falling towards 0. A breakout of this level to the downside may boost the descending correction on the price chart.

In the H1 chart, after reaching the target of the third ascending wave at 1.3030, GBP/USD is consolidating around this level. Possibly, the pair may break the range to the downside and correct in the form of a wide Flag pattern with the target at 1.2922. From the technical point of view, this scenario is confirmed by Stochastic Oscillator: its signal line has rebounded from 80 to the downside, which suggests that the market is moving within the “overbought area” and the line may start a new decline towards 50. If later the line breaks this level, it will continue moving to reach 20.

Disclaimer

Any forecasts contained herein are based on the author’s particular opinion. This analysis may not be treated as trading advice. RoboForex bears no responsibility for trading results based on trading recommendations and reviews contained herein.

The Analytical Overview of the Main Currency Pairs on 2020.10.09

by JustForex

The EUR/USD currency pair

Technical indicators of the currency pair:
  • Prev Open: 1.17600
  • Open: 1.17572
  • % chg. over the last day: -0.02
  • Day’s range: 1.17554 – 1.17809
  • 52 wk range: 1.0637 – 1.2012

The US dollar shows ambiguous results against currency majors. EUR/USD quotes are consolidating in the range of 1.1750-1.1780. Investors continue to monitor the progress of the new stimulus package for the US economy. ECB officials are concerned about the prospects for economic recovery in the Eurozone. The regulator is ready to expand financial incentives if necessary. We recommend opening positions from key levels.

Today, the publication of important economic reports is not planned.

EUR/USD

Indicators do not give accurate signals: 50 MA has crossed 200 MA.

The MACD histogram has started growing, which indicates the bullish sentiment.

Stochastic Oscillator is in the neutral zone, the %K line is below the %D line, which gives a signal to sell EUR/USD.

Trading recommendations
  • Support levels: 1.1750, 1.1725, 1.1700
  • Resistance levels: 1.1780, 1.1800, 1.1850

If the price fixes below 1.1750, EUR/USD quotes are expected to fall. The movement is tending to 1.1725-1.1700.

An alternative could be the growth of the EUR/USD currency pair to 1.1800-1.1840.

The GBP/USD currency pair

Technical indicators of the currency pair:
  • Prev Open: 1.29107
  • Open: 1.29113
  • % chg. over the last day: +0.01
  • Day’s range: 1.29133 – 1.29688
  • 52 wk range: 1.1409 – 1.3516

GBP/USD quotes are in a sideways trend. The technical pattern is ambiguous. At the moment, the local support and resistance levels are 1.2930 and 1.2975, respectively. The trading instrument is tending to recover. Financial market participants expect additional drivers. The Brexit talks and a new stimulus package in the US Congress are still in the spotlight. Positions should be opened from key levels.

The UK has published a series of weak economic releases.

GBP/USD

Indicators signal the power of buyers: the price has fixed above 100 MA.

The MACD histogram is in the positive zone, which indicates the bullish sentiment.

Stochastic Oscillator is located near the overbought zone, the %K line has crossed the %D line. There are no signals at the moment.

Trading recommendations
  • Support levels: 1.2930, 1.2900, 1.2865
  • Resistance levels: 1.2975, 1.3000, 1.3050

If the price fixes above 1.2975, further growth of the GBP/USD currency pair is expected. The movement is tending to 1.3000-1.3030.

An alternative could be a drop in GBP/USD quotes to 1.2900-1.2870.

The USD/CAD currency pair

Technical indicators of the currency pair:
  • Prev Open: 1.32596
  • Open: 1.31949
  • % chg. over the last day: -0.45
  • Day’s range: 1.31703 – 1.31976
  • 52 wk range: 1.2949 – 1.4669

The USD/CAD currency pair shows a steady downtrend. The trading instrument has updated its two-week lows. The loonie is currently testing 1.3170. The 1.3210 level is the nearest resistance. USD/CAD quotes have the potential for further decline. We recommend paying attention to the dynamics of “black gold” prices. Positions should be opened from key levels.

At 15:30 (GMT+3:00), the report on Canada’s labor market will be published.

USD/CAD

Indicators signal the power of sellers: the price has fixed below 50 MA and 100 MA.

The MACD histogram is in the negative zone, which indicates the bearish sentiment.

Stochastic Oscillator is in the neutral zone, the %K line has crossed the %D line. There are no signals at the moment.

Trading recommendations
  • Support levels: 1.3170, 1.3130, 1.3100
  • Resistance levels: 1.3210, 1.3235, 1.3250

If the price fixes below 1.3170, a further fall in USD/CAD quotes is expected. The movement is tending to 1.3140-1.3120.

An alternative could be the growth of the USD/CAD currency pair to 1.3240-1.3260.

The USD/JPY currency pair

Technical indicators of the currency pair:
  • Prev Open: 105.967
  • Open: 106.021
  • % chg. over the last day: +0.05
  • Day’s range: 105.808 – 106.034
  • 52 wk range: 101.19 – 112.41

The USD/JPY currency pair continues to consolidate. There is no defined trend. Investors expect additional drivers. At the moment, the key support and resistance levels are 105.80 and 106.10, respectively. We recommend paying attention to the dynamics of US government bonds yield. Positions should be opened from key levels.

The news feed on Japan’s economy is calm.

USD/JPY

Indicators do not give accurate signals: the price has fixed between 50 MA and 100 MA.

The MACD histogram has started declining, which indicates the bearish sentiment.

Stochastic Oscillator is in the neutral zone, the %K line has started crossing the %D line. There are no signals at the moment.

Trading recommendations
  • Support levels: 105.80, 105.55, 105.40
  • Resistance levels: 106.10, 106.50

If the price fixes above 106.10, further growth of USD/JPY quotes is expected. The movement is tending to 106.40-106.60.

An alternative could be a decline in the USD/JPY currency pair to 105.60-105.40.

by JustForex


This article reflects a personal opinion and should not be interpreted as an investment advice, and/or offer, and/or a persistent request for carrying out financial transactions, and/or a guarantee, and/or a forecast of future events.