Archive for Forex and Currency News – Page 352

The Analytical Overview of the Main Currency Pairs on 2020.10.15

by JustForex

The EUR/USD currency pair

Technical indicators of the currency pair:
  • Prev Open: 1.17446
  • Open: 1.17453
  • % chg. over the last day: +0.01
  • Day’s range: 1.17315 – 1.17579
  • 52 wk range: 1.0637 – 1.2012

There is an ambiguous technical pattern on the EUR/USD currency pair. The trading instrument is in a sideways trend. The euro is testing local supply and demand zones: 1.1720-1.1735 and 1.1765-1.1780, respectively. Investors expect up-to-date information concerning negotiations in the US Congress on a new stimulus package. The situation with the COVID-19 pandemic in Europe continues to deteriorate rapidly. Today, investors will assess US economic releases. We recommend opening positions from key levels.

The news feed on 2020.10.15:
  • – Initial jobless claims in the US at 15:30 (GMT+3:00);
  • – Philadelphia Fed manufacturing index at 15:30 (GMT+3:00).
EUR/USD

Indicators do not give accurate signals: the price has crossed the 50 MA.

The MACD histogram is near the 0 mark. There are no signals at the moment.

Stochastic Oscillator is in the neutral zone, the %K line has crossed the %D line. There are no signals at the moment.

Trading recommendations
  • Support levels: 1.1735, 1.1720, 1.1700
  • Resistance levels: 1.1765, 1.1780, 1.1800

If the price fixes below 1.1735, further correction of EUR/USD quotes is expected. The movement is tending to 1.1700-1.1680.

An alternative could be the growth of the EUR/USD currency pair to 1.1800-1.1820.

The GBP/USD currency pair

Technical indicators of the currency pair:
  • Prev Open: 1.29312
  • Open: 1.30069
  • % chg. over the last day: +0.60
  • Day’s range: 1.29861 – 1.30299
  • 52 wk range: 1.1409 – 1.3516

In the last sessions, trades on the GBP/USD currency pair are very active. At the same time, there is no defined trend. Yesterday, demand for the British pound rose significantly following reports that a Brexit agreement is still possible in the upcoming weeks. At the moment, GBP/USD quotes are consolidating in the range of 1.2990-1.3035. The British pound has the potential for further growth. Positions should be opened from key levels.

We recommend paying attention to economic releases from the US.

GBP/USD

Indicators do not give accurate signals: the price has crossed the 50 MA and 100 MA.

The MACD histogram is in the positive zone, but below the signal line, which gives a weak signal to buy GBP/USD.

Stochastic Oscillator is in the neutral zone, the %K line is above the %D line, which indicates the bullish sentiment.

Trading recommendations
  • Support levels: 1.2990, 1.2960, 1.2925
  • Resistance levels: 1.3035, 1.3080, 1.3100

If the price fixes above 1.3035, further growth of the GBP/USD currency pair is expected. The movement is tending to 1.3070-1.3100.

An alternative could be a decline in GBP/USD quotes to 1.2960-1.2925.

The USD/CAD currency pair

Technical indicators of the currency pair:
  • Prev Open: 1.31341
  • Open: 1.31421
  • % chg. over the last day: +0.06
  • Day’s range: 1.31388 – 1.31694
  • 52 wk range: 1.2949 – 1.4669

The USD/CAD currency pair continues to consolidate after a prolonged fall. There is no defined trend. Currently, the loonie is testing 1.3170. The 1.3125 level is the nearest support. The trading instrument is tending to correct. We recommend paying attention to the dynamics of “black gold” prices. Positions should be opened from key levels.

The news feed on Canada’s economy is calm.

USD/CAD

Indicators do not give accurate signals: 50 MA has crossed 100 MA.

The MACD histogram has started rising, which indicates the bullish sentiment.

Stochastic Oscillator is in the neutral zone, the %K line is above the %D line, which gives a signal to buy USD/CAD.

Trading recommendations
  • Support levels: 1.3125, 1.3100
  • Resistance levels: 1.3170, 1.3200, 1.3225

If the price fixes above 1.3170, USD/CAD quotes are expected to correct. The movement is tending to 1.3200-1.3225.

An alternative could be a decline in the USD/CAD currency pair to 1.3100-1.3080.

The USD/JPY currency pair

Technical indicators of the currency pair:
  • Prev Open: 105.457
  • Open: 105.121
  • % chg. over the last day: -0.30
  • Day’s range: 105.061 – 105.332
  • 52 wk range: 101.19 – 112.41

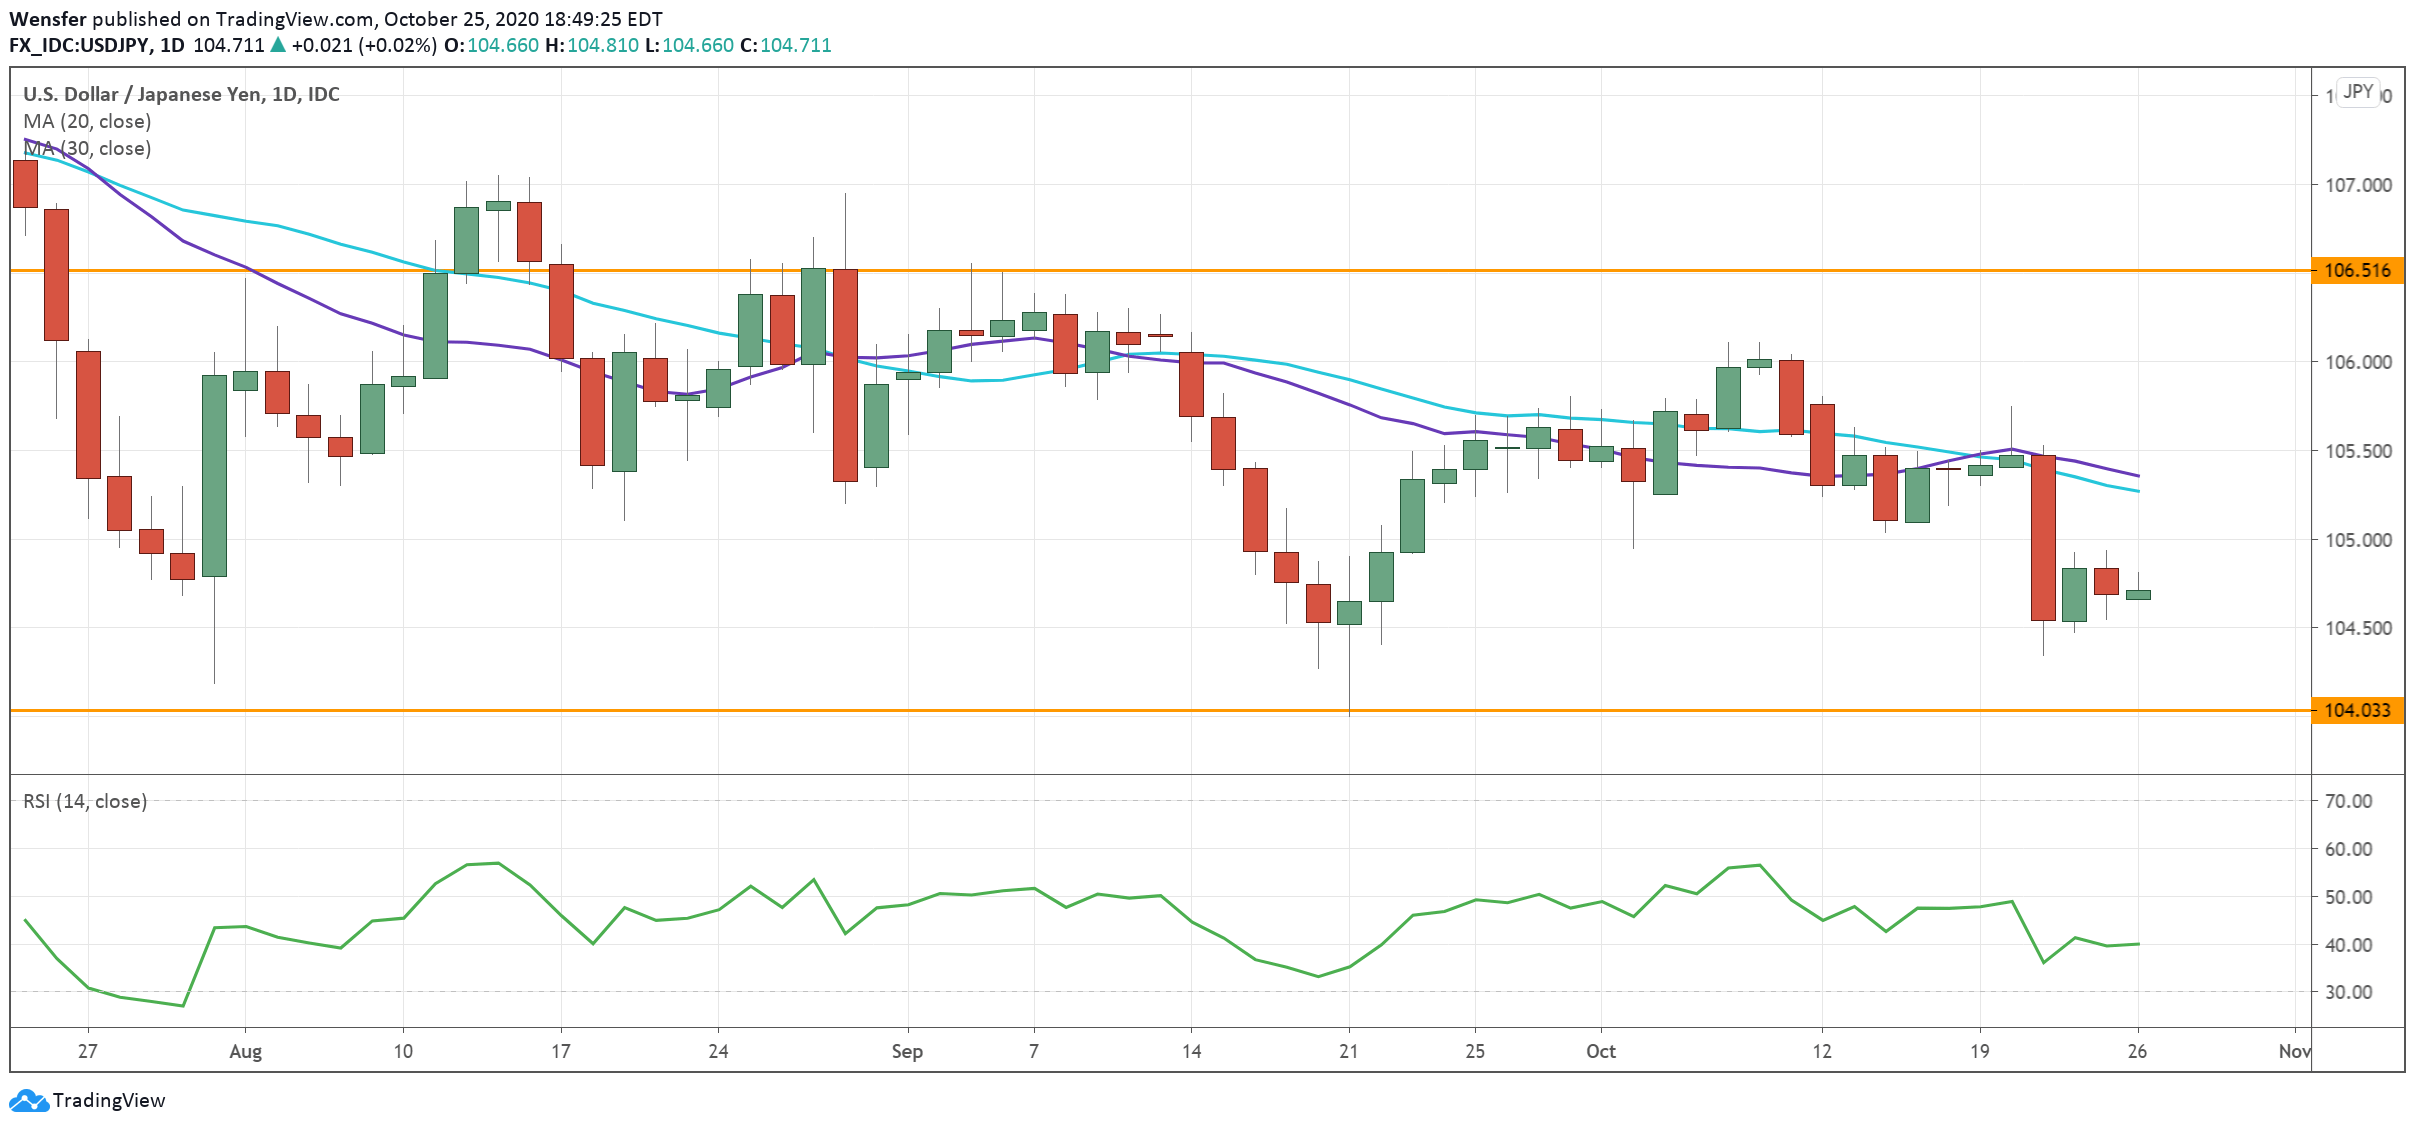
Sales prevail on the USD/JPY currency pair. The trading instrument has updated its local lows again. At the moment, USD/JPY quotes are consolidating in the range of 105.05-105.30. The trading instrument has the potential for further decline. We recommend paying attention to the dynamics of US government bonds yield. Positions should be opened from key levels.

The news feed on Japan’s economy is calm.

USD/JPY

Indicators signal the power of sellers: the price has fixed below 50 MA and 100 MA.

The MACD histogram is in the negative zone, but above the signal line, which gives a weak signal to sell USD/JPY.

Stochastic Oscillator is in the neutral zone, the %K line is below the %D line, which also indicates the bearish sentiment.

Trading recommendations
  • Support levels: 105.05, 104.70, 104.50
  • Resistance levels: 105.30, 105.50, 105.65

If the price fixes below 105.05, a further fall in USD/JPY quotes is expected. The movement is tending to 104.80-104.60.

An alternative could be the growth of the USD/JPY currency pair to 105.50-105.70.

by JustForex


This article reflects a personal opinion and should not be interpreted as an investment advice, and/or offer, and/or a persistent request for carrying out financial transactions, and/or a guarantee, and/or a forecast of future events.

The Greenback Is Consolidating. Investors Expect Additional Drivers

by JustForex

The US dollar shows ambiguous results against major competitors. Yesterday, the dollar index (#DX) closed the trading day with a slight decline (-0.18%). Financial market participants continue to follow the negotiations in the US Congress on a new stimulus package for the country’s economy. Demand for the British pound has grown following reports that Brussels and London may extend Brexit negotiations after the mid-October deadline.

European stocks have collapsed amid the rapid spread of the COVID-19 epidemic, which causes significant damage to the EU economy. Some countries have introduced new restrictive measures. At the moment, the number of infected in the world has exceeded 38.5 million. Today, we recommend paying attention to economic releases from the US.

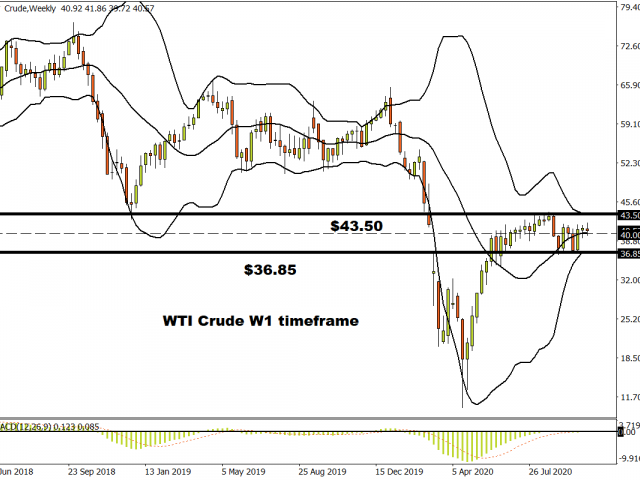
The “black gold” prices show a negative trend. At the moment, futures for the WTI crude oil are testing the $40.20 mark per barrel. We recommend paying attention to the data on EIA crude oil inventories at 18:00 (GMT+3:00).

Market indicators

Yesterday, there was the bearish sentiment in the US stock market: #SPY (-0.63%), #DIA (-0.56%), #QQQ (-0.84%).

The 10-year US government bonds yield has been declining. The indicator has reached 0.70-0.71%.

The news feed for 2020.10.15:
  • – Initial jobless claims in the US at 15:30 (GMT+3:00);
  • – Philadelphia Fed manufacturing index at 15:30 (GMT+3:00).

by JustForex


This article reflects a personal opinion and should not be interpreted as an investment advice, and/or offer, and/or a persistent request for carrying out financial transactions, and/or a guarantee, and/or a forecast of future events.

Sterling boosted by suspected Brexit delay

By Lukman Otunuga, Research Analyst, ForexTime

GBP is the strongest performer on the day and now flat on the week versus the mighty Dollar following reports that the UK is ready to extend EU trade negotiations past PM Johnson’s self-imposed deadline of tomorrow. Boris will make a final decision on whether to continue talks after the EU Summit concludes on Friday and after his high-level call today with the EU Commission President.

There appears to still be notable disagreements between both sides, with an element of brinkmanship in the Brussels air as each side seeks to squeeze as many concessions out of the other. But given the prior threat from the UK government to walk away by 15 October if no progress was made, GBP downside against the Euro should remain limited.

Elsewhere, US stocks have opened up in the green with the risk mood a little more constructive this afternoon. DXY has turned back from 93.60 after grinding out a base around 93 yesterday with news that two major drug companies have halted trials of a vaccine within the last couple of days, because of safety concerns.

Canadian dollar steadies near five-week high

CAD has appreciated over 1% against the Dollar this month, but the recent improvement has stalled this week. The broader commodity complex – a big driver for the loonie – is mixed on the day with oil prices modestly lower.

1.31 is the level to beat for the bears and offers decent support after two lows made around there this week. If USD/CAD does break lower, then sub 1.30 and the 1 September low comes into play. Resistance lies above at 1.3175 ahead of the 55-day Moving Average at 1.3225.

Disclaimer: The content in this article comprises personal opinions and should not be construed as containing personal and/or other investment advice and/or an offer of and/or solicitation for any transactions in financial instruments and/or a guarantee and/or prediction of future performance. ForexTime (FXTM), its affiliates, agents, directors, officers or employees do not guarantee the accuracy, validity, timeliness or completeness, of any information or data made available and assume no liability as to any loss arising from any investment based on the same.


Forex-Time-LogoArticle by ForexTime

ForexTime Ltd (FXTM) is an award winning international online forex broker regulated by CySEC 185/12 www.forextime.com

Fibonacci Retracements Analysis 14.10.2020 (GBPUSD, EURJPY)

Article By RoboForex.com

GBPUSD, “Great Britain Pound vs US Dollar”

As we can see in the H4 chart, a local divergence on MACD made GBPUSD finish the correctional uptrend, which has corrected the previous descending wave by 50.0%. there is a possibility of another rising impulse towards 61.8% fibo at 1.3174 but this scenario is rather unlikely. The key resistance is the high at 1.3482. The main scenario implies further decline to break the low at 1.2675 and then reach the long-term 50.0% fibo at 1.2445.

GBPUSD_H4
Risk Warning: the result of previous trading operations do not guarantee the same results in the future

In the H1 chart, the asset has reached 38.2% fibo after a local divergence on MACD and right now it is heading towards 50.0% fibo at 1.2879. Later, the market may continue falling to reach 61.8% and 76.0% fibo at 1.2831 and 1.2773 respectively but the key downside target is the low at 1.2675. The resistance is the local high at 1.3083.

GBPUSD_H1
Risk Warning: the result of previous trading operations do not guarantee the same results in the future

EURJPY, “Euro vs. Japanese Yen”

As we can see in the H4 chart, after breaking 50.0%, the correctional uptrend has failed to reach 61.8% fibo at 125.28. At the moment, after a local divergence on MACD, EURJPY is starting another mid-term descending wave towards the low at 122.38. If later the price breaks this level, the asset may continue falling to reach 50.0% and 61.8% fibo at 121.21 and 119.83 respectively.

EURJPY_H4
Risk Warning: the result of previous trading operations do not guarantee the same results in the future

The H1 chart shows a new decline after a divergence on MACD. After falling and reaching 50.0% fibo, the asset is about to rebound. After completing the pullback, the instrument may continue falling towards 61.8% and 76.0% fibo at 123.41 and 123.03 respectively, and then the low at 122.38. The local resistance is the high at 125.08.

EURJPY_H1

Article By RoboForex.com

Attention!
Forecasts presented in this section only reflect the author’s private opinion and should not be considered as guidance for trading. RoboForex LP bears no responsibility for trading results based on trading recommendations described in these analytical reviews.

Commodity Bull Market Cycle Starts with Euro and Dollar Trend Changes

By TheTechnicalTraders 

– In this report, I would like to show you how currency values play an important role in the price of commodities like gold and silver. The analysis here is all about the EUR/USD currency pair to give you an idea of how they can help time and predict future price movement in metals. This is just one commodity pair out of several which provide similar insight and the more pairs that confirm, the stronger our signal and market timing will be.

Commodity bull eras do not need a strong Euro… but it definitely helps if the US Dollar weakens, as anything denominated in it like gold, silver, and oil will have a higher nominal value.

There are a few interesting points to look at in the EUR/USD chart presented below. You will have keep scrolling down to look at the chart to see a visual of each technical analysis point I am sharing with you. The first thing you may notice is that the 16-year cycles for this forex currency pair are pretty harmonious. Usually, a single cycle like the one shown on this chart does not fit or overlay on an instrument this well because there are almost always more than one cycle at work skewing things, however, the cycle in this chart just happen to be very clean.

When you know which cycle is the strongest of them all, it adds value to the probability of where and when the next major turning point will be for that asset. In this currency pair, the 16-year cycle is the strongest. In fact, I spoke with Rick Rule a few weeks ago and we touched on these longer-term commodity cycles and what we both feel is unfolding now in the markets. He had some very interesting analysis and he blew my mind when he explained how Sprott gold miners ETFs are constructed. If you don’t know what I am talking about this is a MUST WATCH!

Ok, back to the chart below! Currently, the EUR/USD is breaking out to the upside on the quarterly linear chart, but not yet on the logarithmic chart. This is giving us signals that a paradigm shift is in progress. A new cycle where the US Dollar will weaken vs Euro. Those looking at DXY for the US Dollar proxy will notice Euro is a big part of that index.

When looking at a resistance trend line based on quarterly closes, we understand that any points on that line will offer substantial resistance when hit. When price reaches the level, we call it a ‘measured move’, and price could reverse lower once hit.

Another good indicator to get more clues on the strength or weakness of actual price action is the CCI (Commodity Channel Index). This is the indicator located at the bottom of the chart. You can chart this indicator as you would the actual price action with trendlines. A major, multi-decade, paradigm shift pivot line can be drawn. Since we are below it, that is now our “pivot line defined target”.

Further, the high-water marks for the CCI where the EURUSD pair put in a significant top (red horizontal line). That is another target where we can estimate probabilities of setting in an important top.

One more piece of the puzzle is the current supporting white trend line which has already been tested 3 times. We now have a trend angle of ascent defined by this indicator and its analysis.

All three of those elements converge to an “energy point”. We now have a target in price AND in time, Win-Win!  Target is 1.86 (which can overshoot on smaller time-frames) for early 2027.

When you add this to other currency cycle charts and the gold chart, as an example, the evidence keeps piling up. We are in an embryonic commodity bull era unfolding before our eyes. There will be noise on smaller time frames, but the higher time frames (monthly and higher) bear the most weight for the determination of a trend.

If you want to see what is about to happen that will be a life-changing opportunity for you, join me on Oct 14th at 6pm ET for my 55-minute seminar on the most active supercycles for the US stock market, including Gold, Silver, and Miners. You can also catch great political speakers at this event discussing the presidential election, which ties into my election year cycle analysis as well. Signup and attend for this Wealth365 event for FREE here.

Concluding Thoughts:

In short, you can see how one chart, provides a plethora of evidence just waiting to be observed, giving you confidence to make smart trading and investing decisions and helping you “sleep well at night” knowing about new upcoming multi-year trends.

If you would like to learn more about cycles, investing, or trading signals for the major asset classes visit my research and trading newsletter.

Chris Vermeulen
Chief Market Strategist
www.TheTechnicalTraders.com

NOTICE AND DISCLAIMER: Our free research does not constitute a trade recommendation or solicitation for our readers to take any action regarding this research.  It is provided for educational purposes only to our subscribers and not intended to be acted upon.  Read our FULL DISCLAIMER here.


Forex Technical Analysis & Forecast 14.10.2020

Article By RoboForex.com

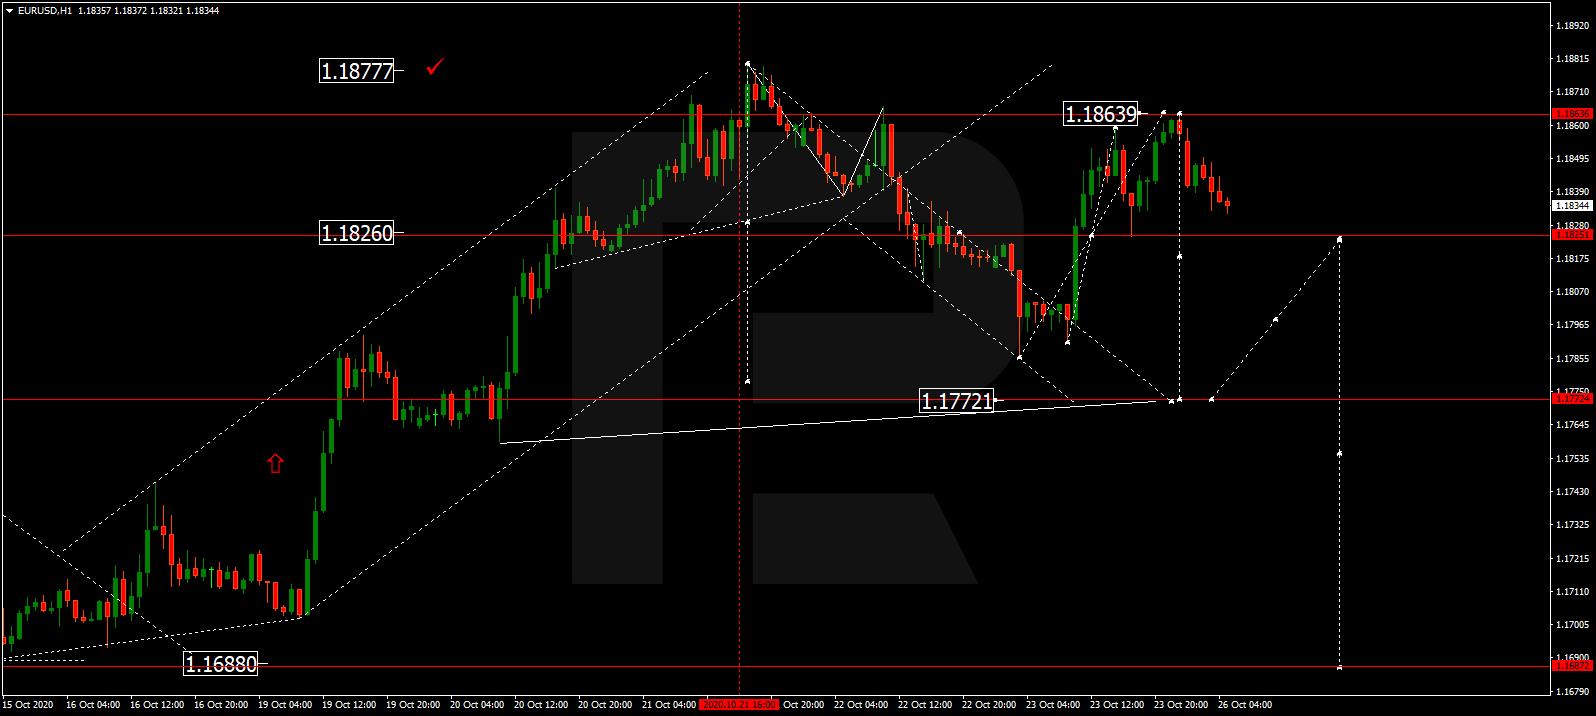
EURUSD, “Euro vs US Dollar”

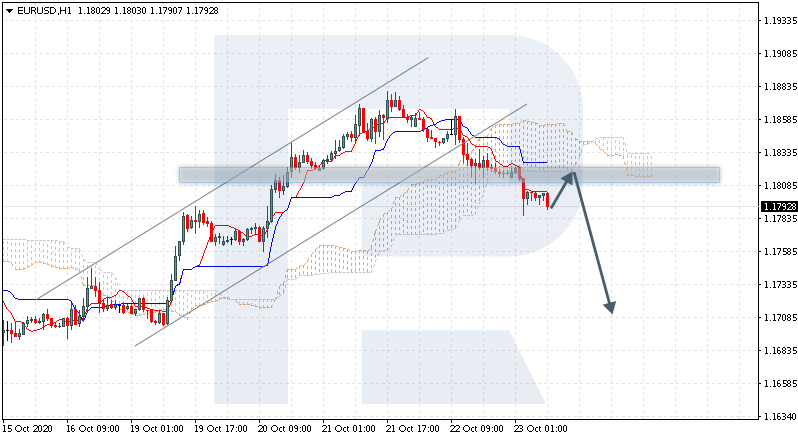
After completing the descending wave at 1.1750 and then breaking this level to the downside, EURUSD has extended this structure down to 1.1730; right now, it is still consolidating below the latter level. Possibly, the pair may correct to test 1.1760 from below and then start a new decline to reach 1.1698. Later, the market may form one more ascending structure with the target at 1.1750.

EURUSD
Risk Warning: the result of previous trading operations do not guarantee the same results in the future

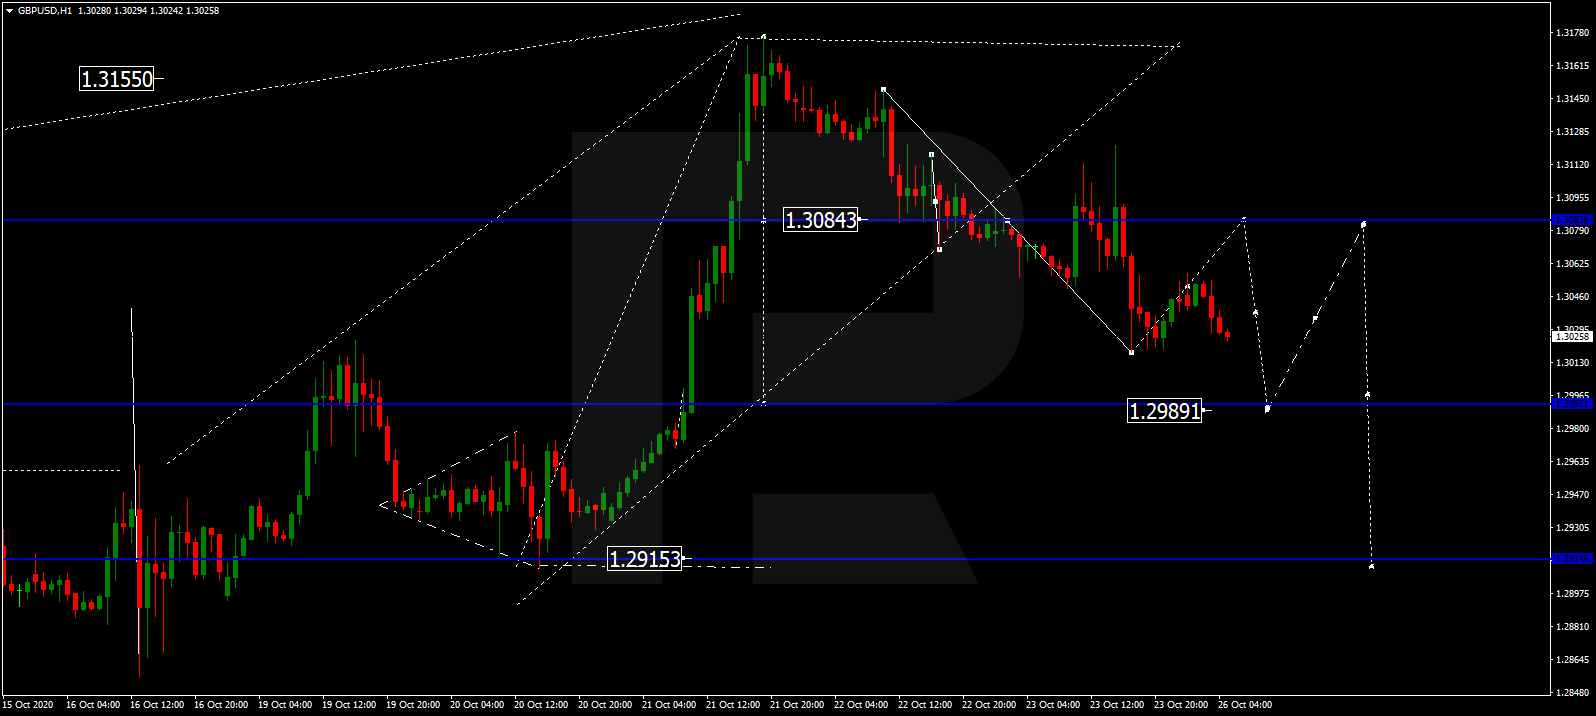
GBPUSD, “Great Britain Pound vs US Dollar”

After finishing the descending wave at 1.2982 and breaking this level to the downside, GBPUSD has reached 1.2922; right now, it is consolidating above the latter level. Today, the pair may correct to test 1.2982 from below and then form a new descending structure to reach 1.2900. After that, the instrument may correct to the upside with the target at 1.2980.

GBPUSD
Risk Warning: the result of previous trading operations do not guarantee the same results in the future

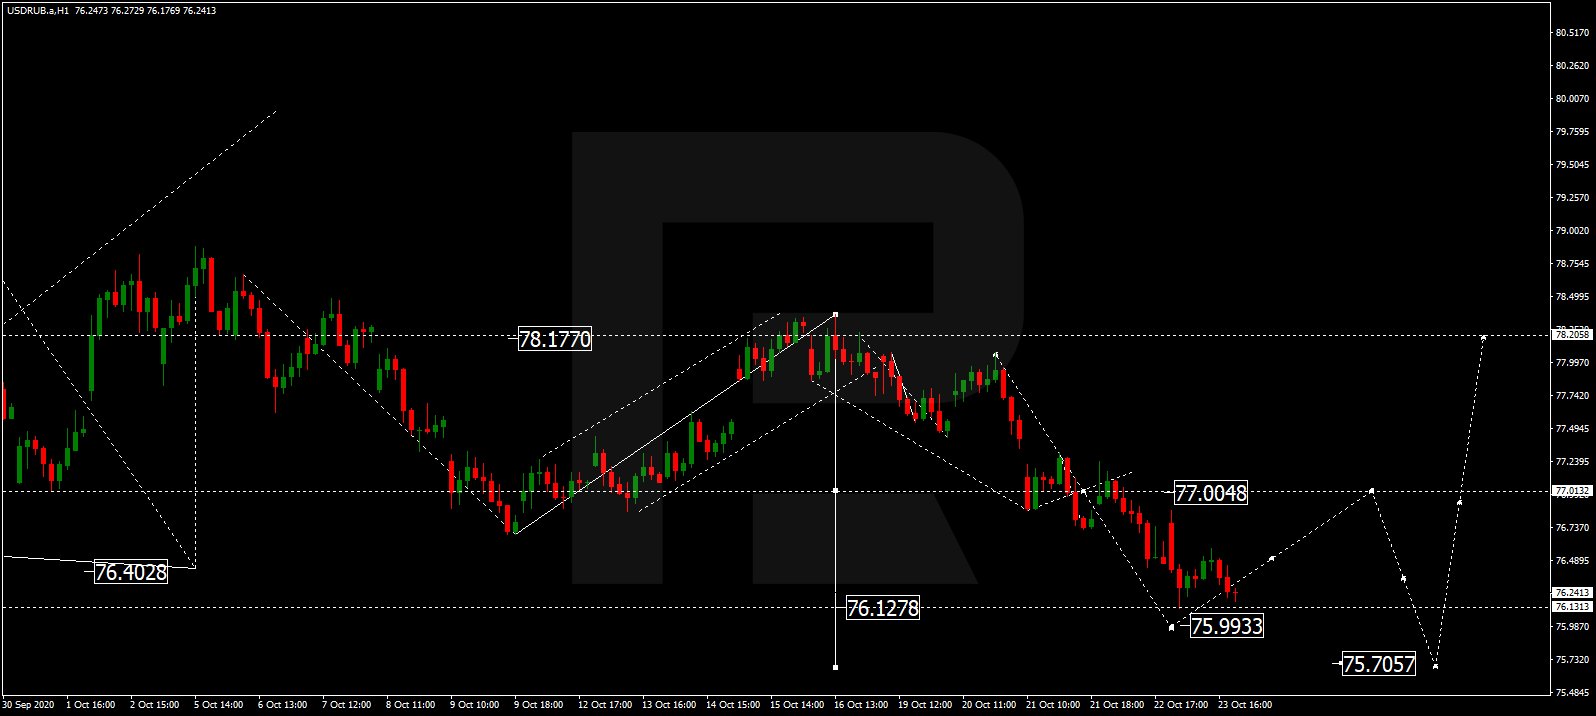
USDRUB, “US Dollar vs Russian Ruble”

USDRUB continues consolidating around 76.90. Possibly, today the pair may grow towards 77.60 and then resume falling with the first target at 76.40. Later, the market may start another correction to reach 78.20.

USDRUB
Risk Warning: the result of previous trading operations do not guarantee the same results in the future

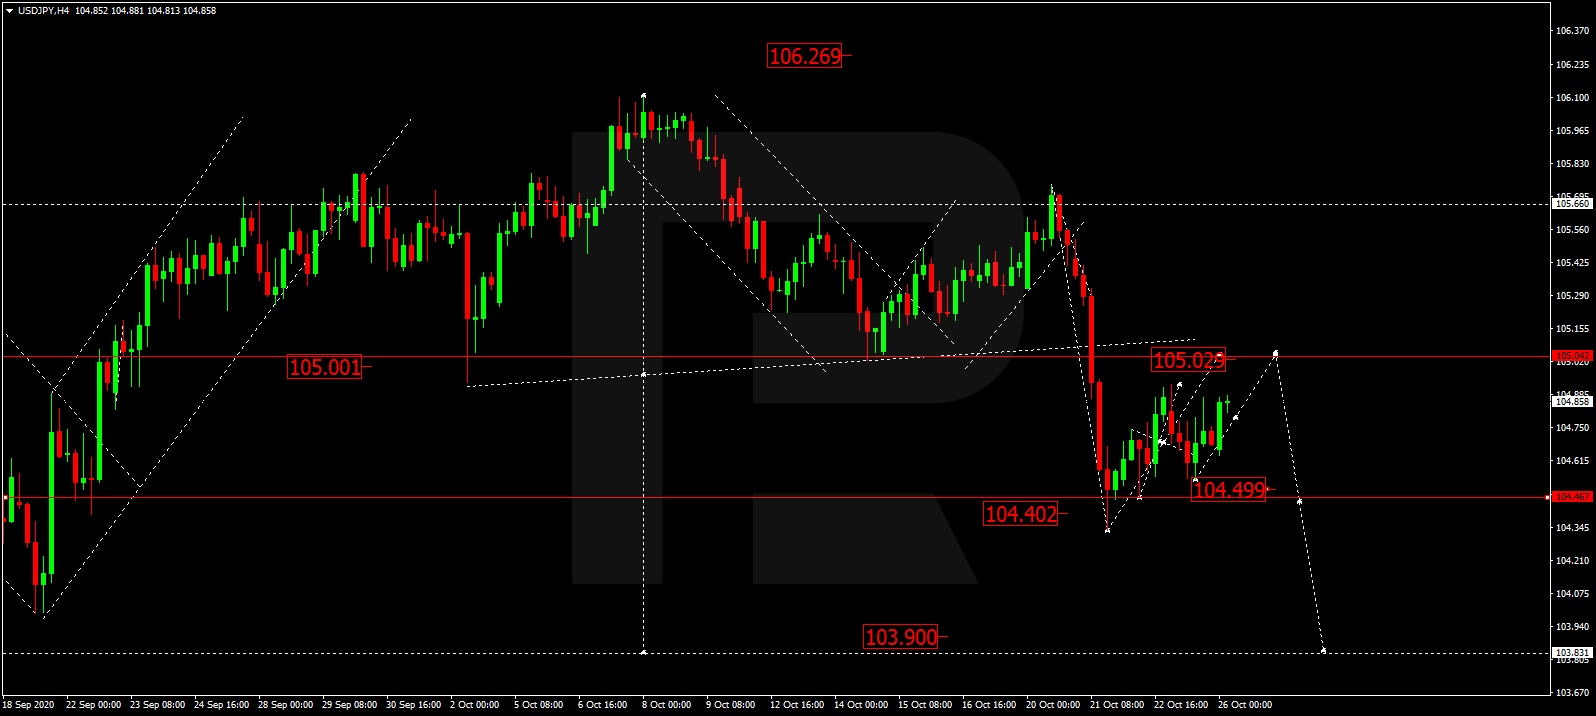
USDJPY, “US Dollar vs Japanese Yen”

After completing the ascending structure at 105.55 and then rebounding from this level to the downside, USDJPY is falling with the first target at 105.00. After that, the instrument may correct towards 105.50 and then start another decline to break 105.00. Later, the market may continue moving downwards with the short-term target at 104.40.

USDJPY
Risk Warning: the result of previous trading operations do not guarantee the same results in the future

USDCHF, “US Dollar vs Swiss Franc”

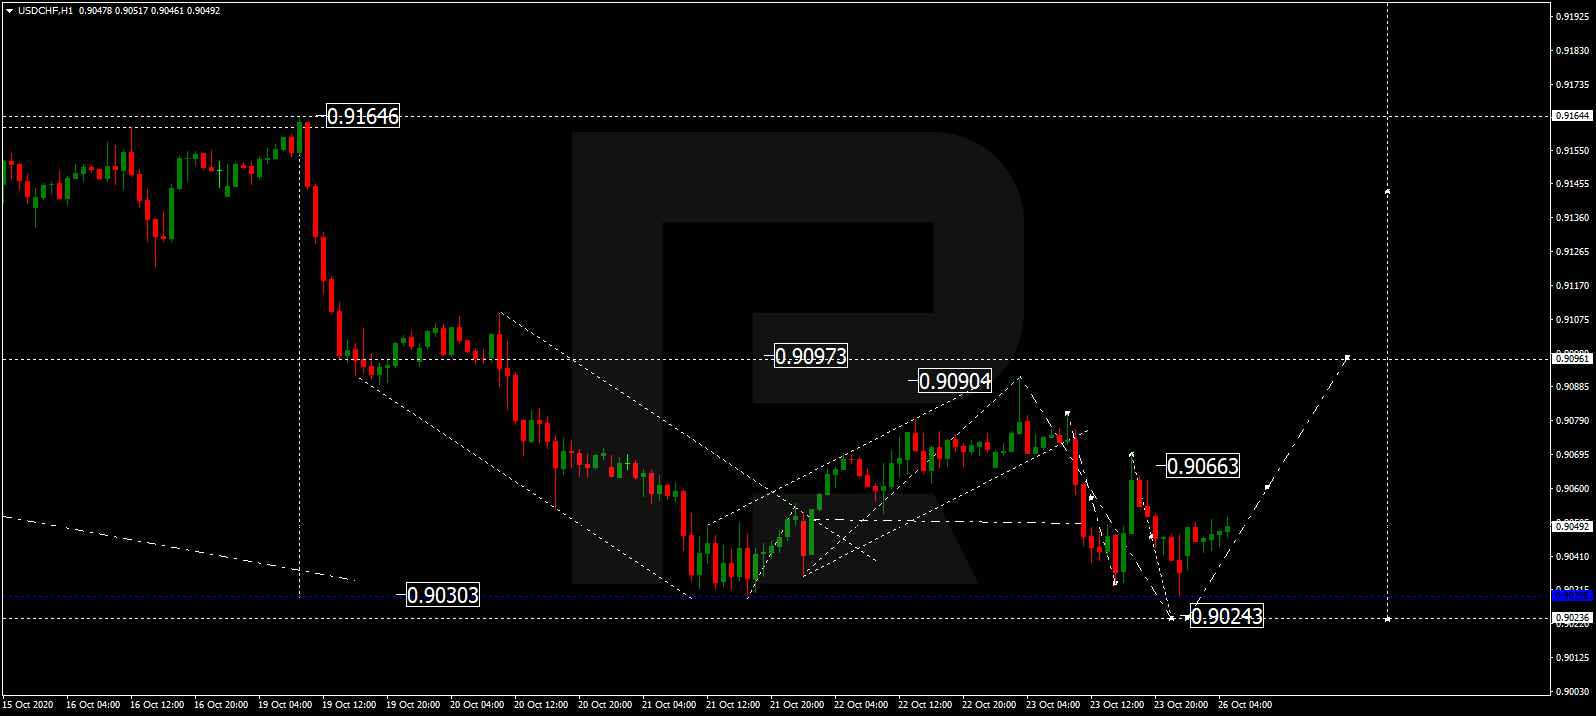
After finishing the ascending structure at 0.9124 and then breaking it to the upside, USDCHF has reached 0.9155; right now, it is consolidating below the latter level. Possibly, the pair may break the range to the downside and start a new correction to test 09124 from below. Later, the market may resume growing with the first target at 0.9166.

USDCHF
Risk Warning: the result of previous trading operations do not guarantee the same results in the future

AUDUSD, “Australian Dollar vs US Dollar”

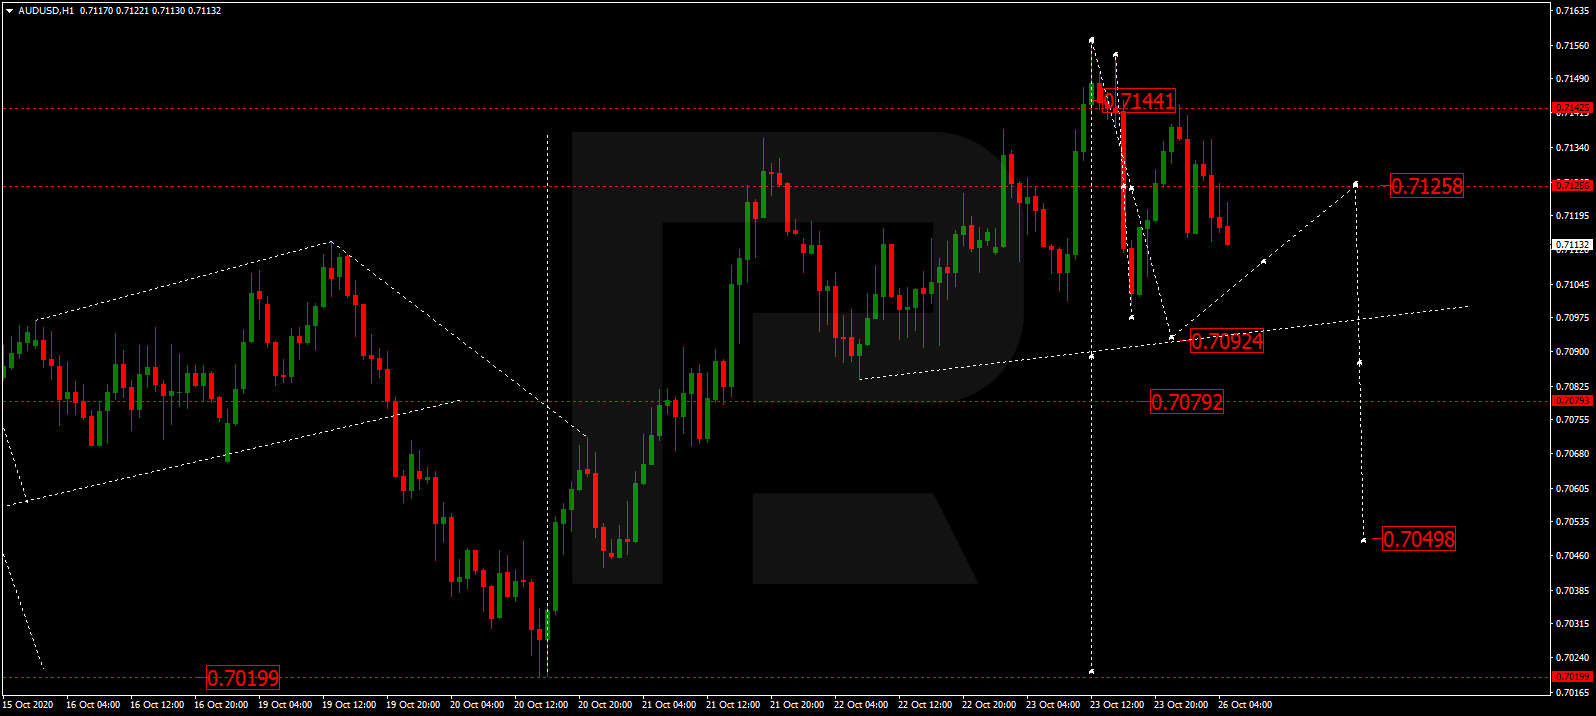
AUDUSD is still consolidating around 0.7177. Today, the pair may fall to break 0.7147 and then continue trading downwards with the first target at 0.7111.

AUDUSD
Risk Warning: the result of previous trading operations do not guarantee the same results in the future

BRENT

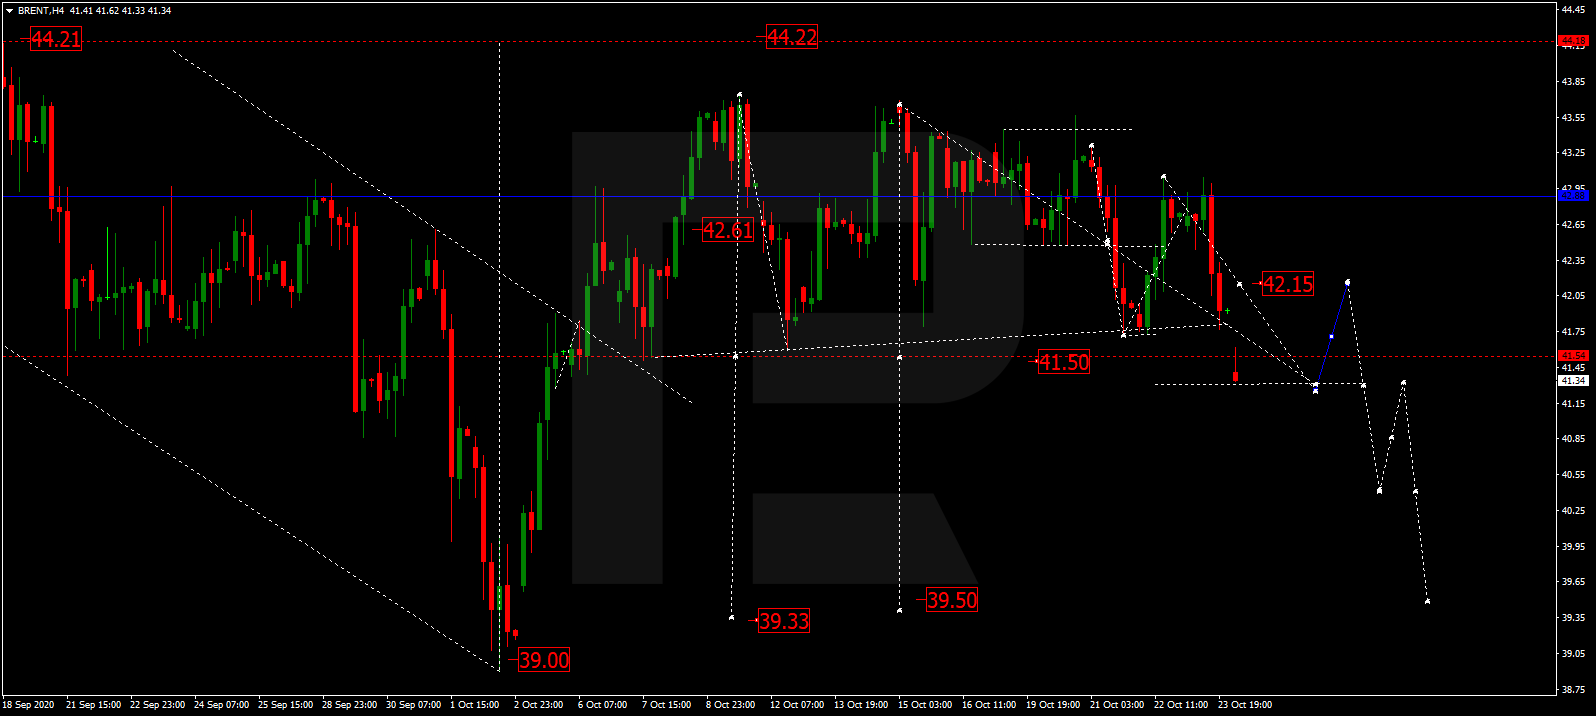
After completing the ascending structure at 42.60, Brent is consolidating below this level. Possibly, the asset may form a new descending structure to finish the correction at 41.50. Later, the market may start another growth with the first target at 44.22.

BRENT
Risk Warning: the result of previous trading operations do not guarantee the same results in the future

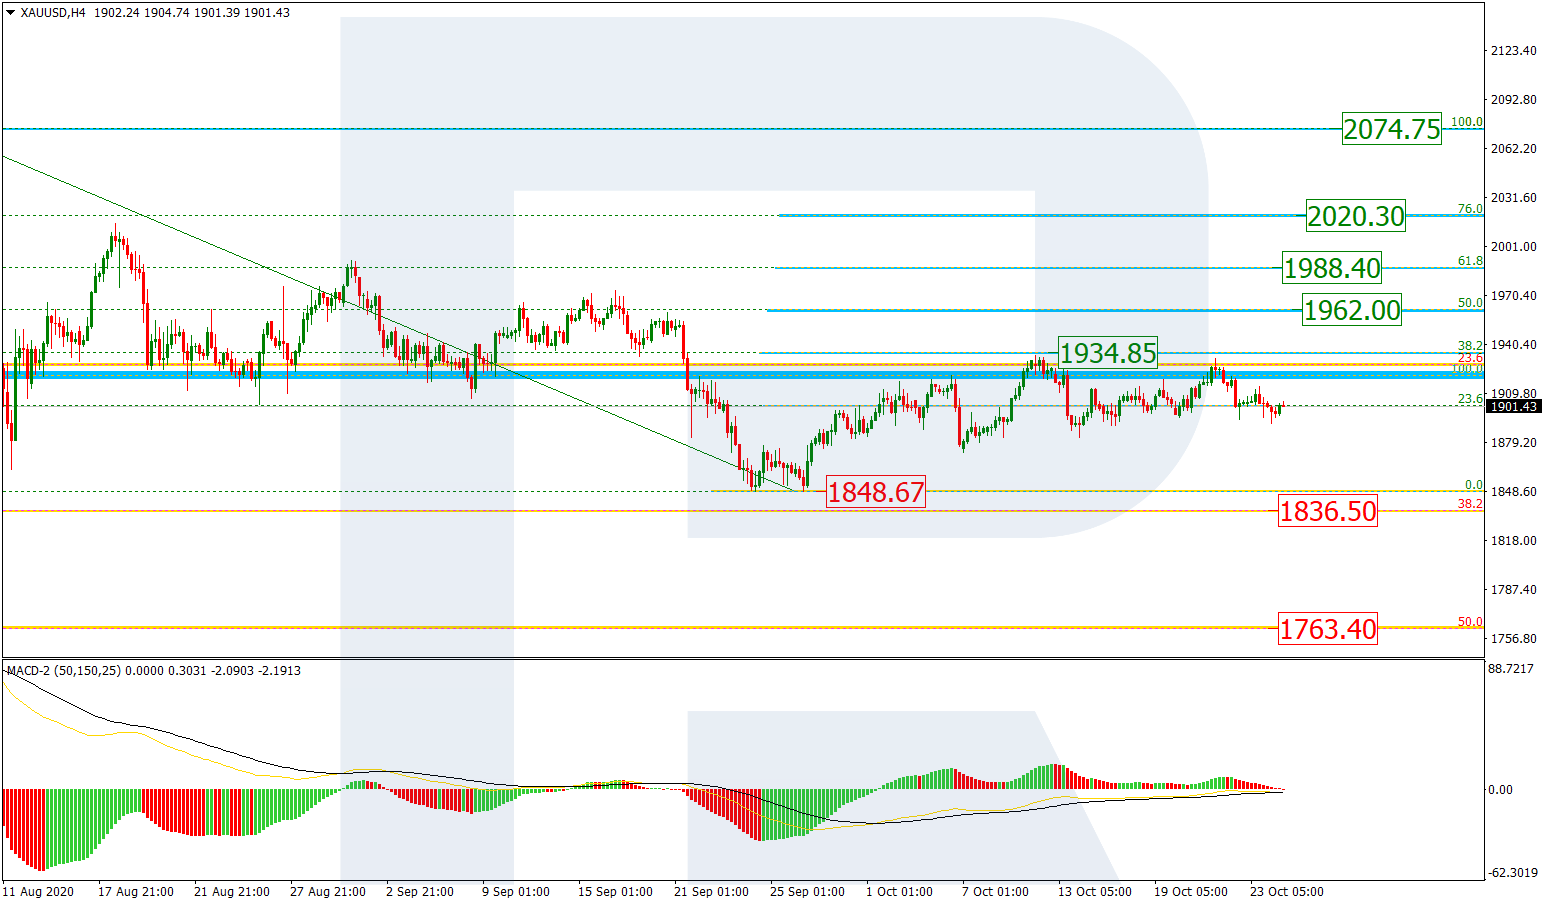
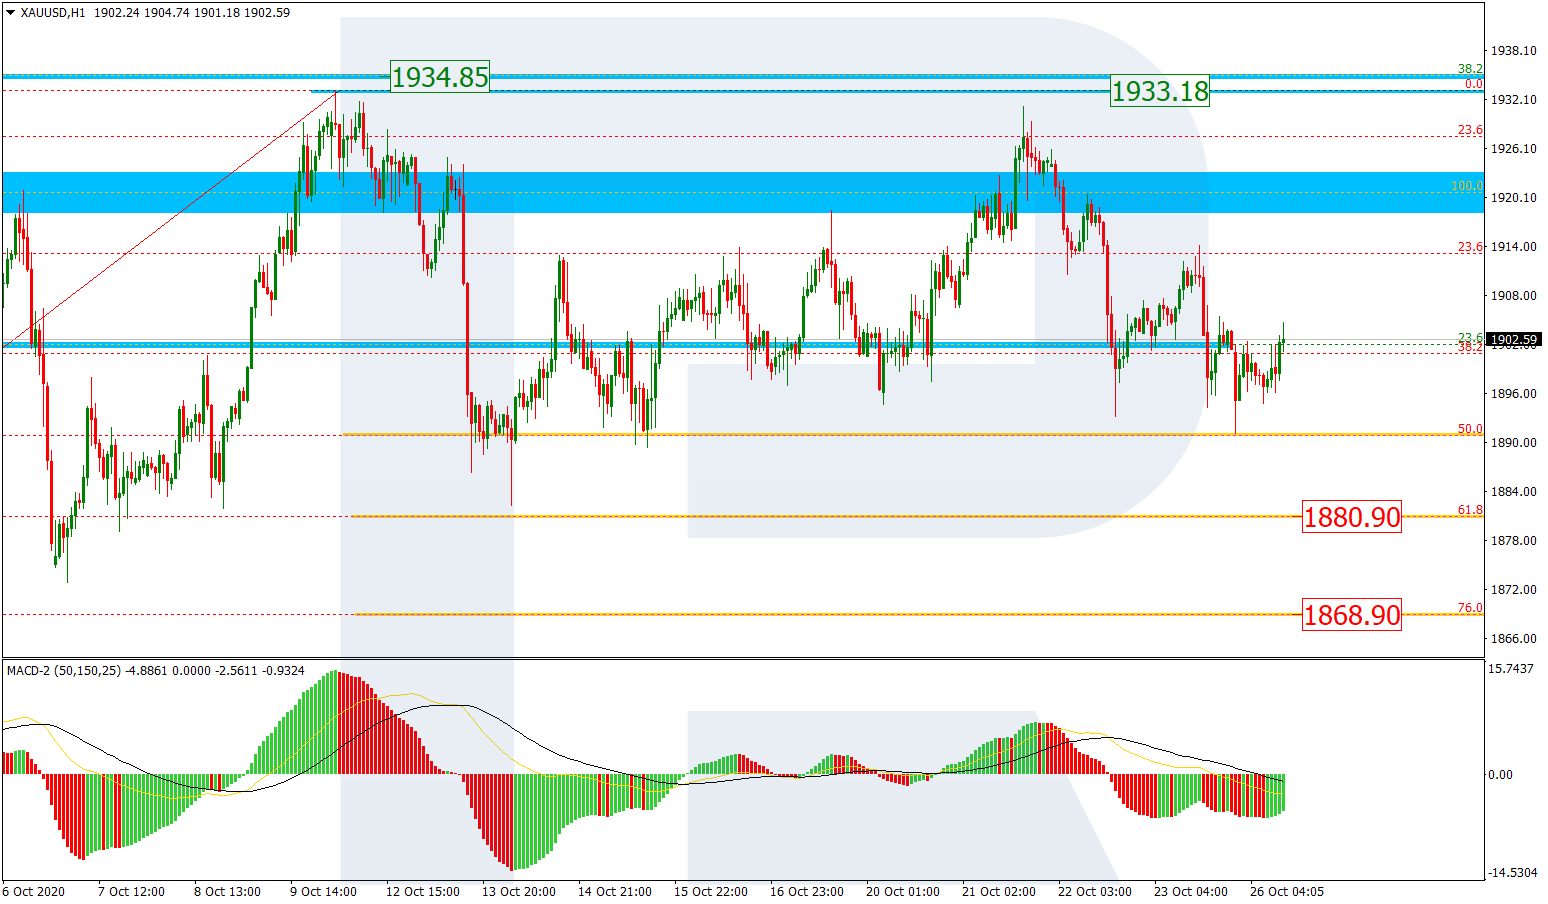
XAUUSD, “Gold vs US Dollar”

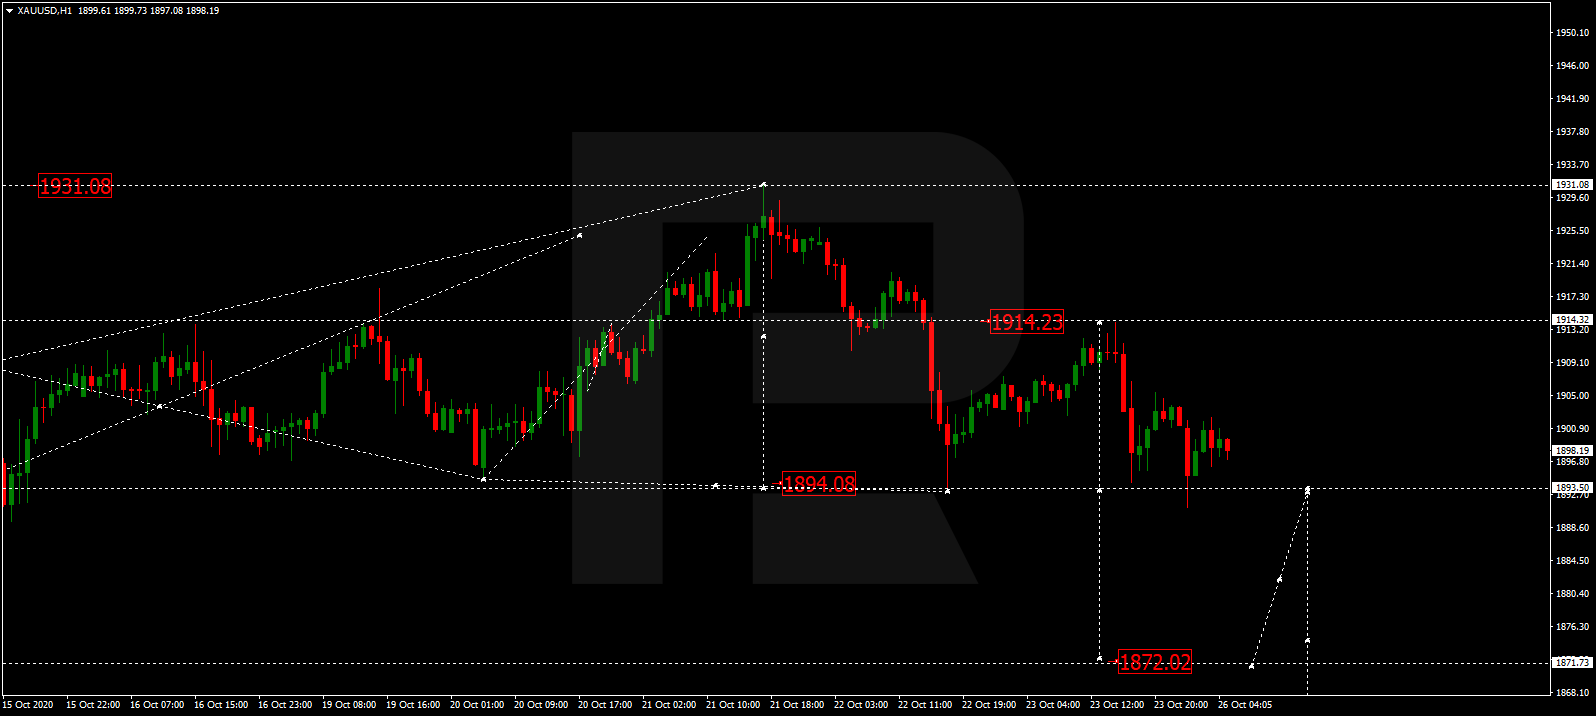
After finishing the descending wave at 1905.00 and then breaking this level to the downside, Gold has reached 1891.00; right now, it is consolidating around the latter level. Possibly, the pair may break the range to the downside and correct to test 1905.00 from below. Later, the market may resume trading within the downtrend with the target at 1877.35.

GOLD
Risk Warning: the result of previous trading operations do not guarantee the same results in the future

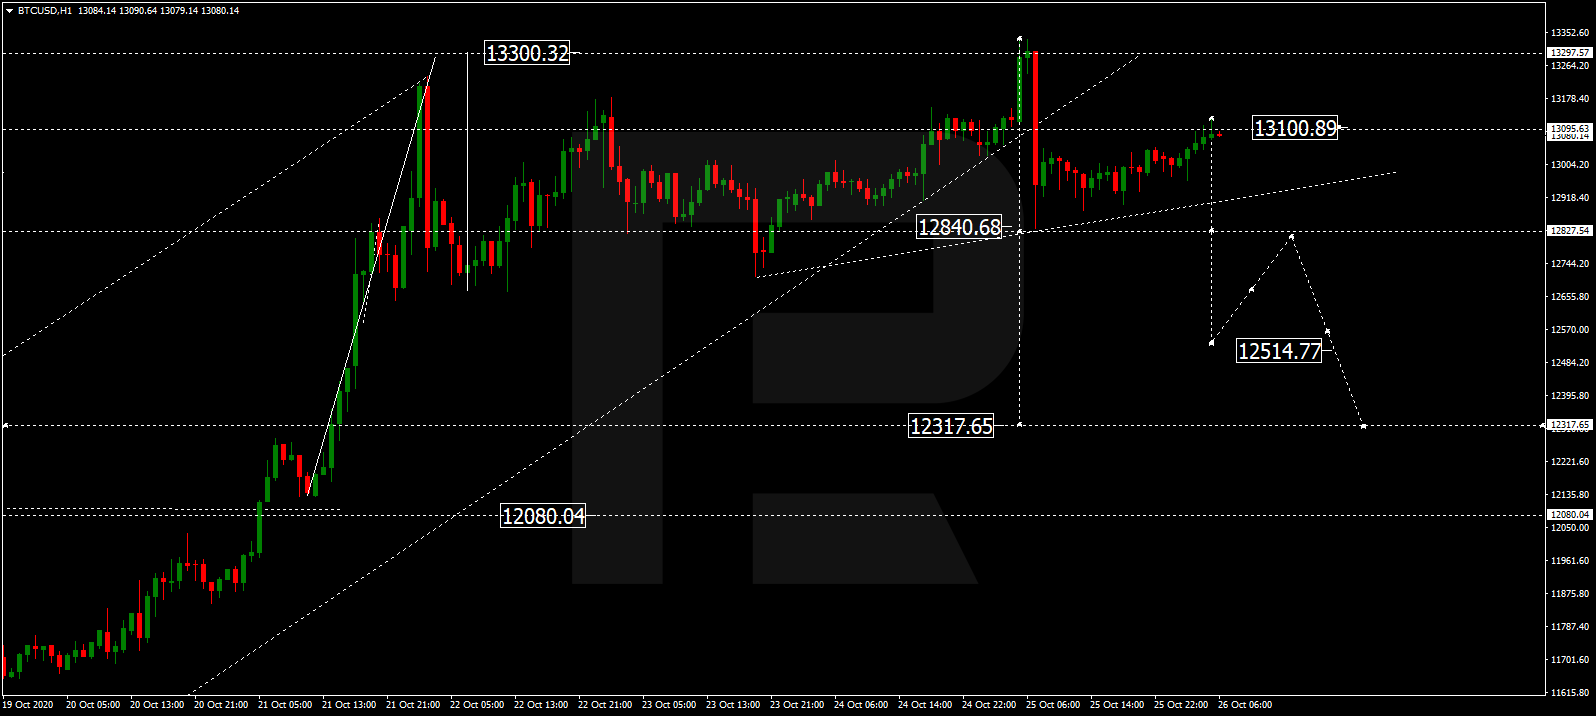
BTCUSD, “Bitcoin vs US Dollar”

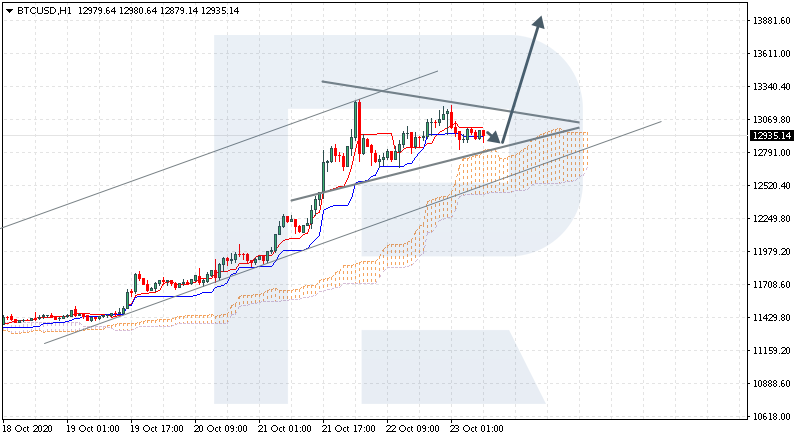
BTCUSD is still consolidating around 11400.00. Possibly, today the asset may fall to reach 11111.00. Later, the market may correct to test 11400.00 from below and then resume falling with the target at 10900.00.

BITCOIN
Risk Warning: the result of previous trading operations do not guarantee the same results in the future

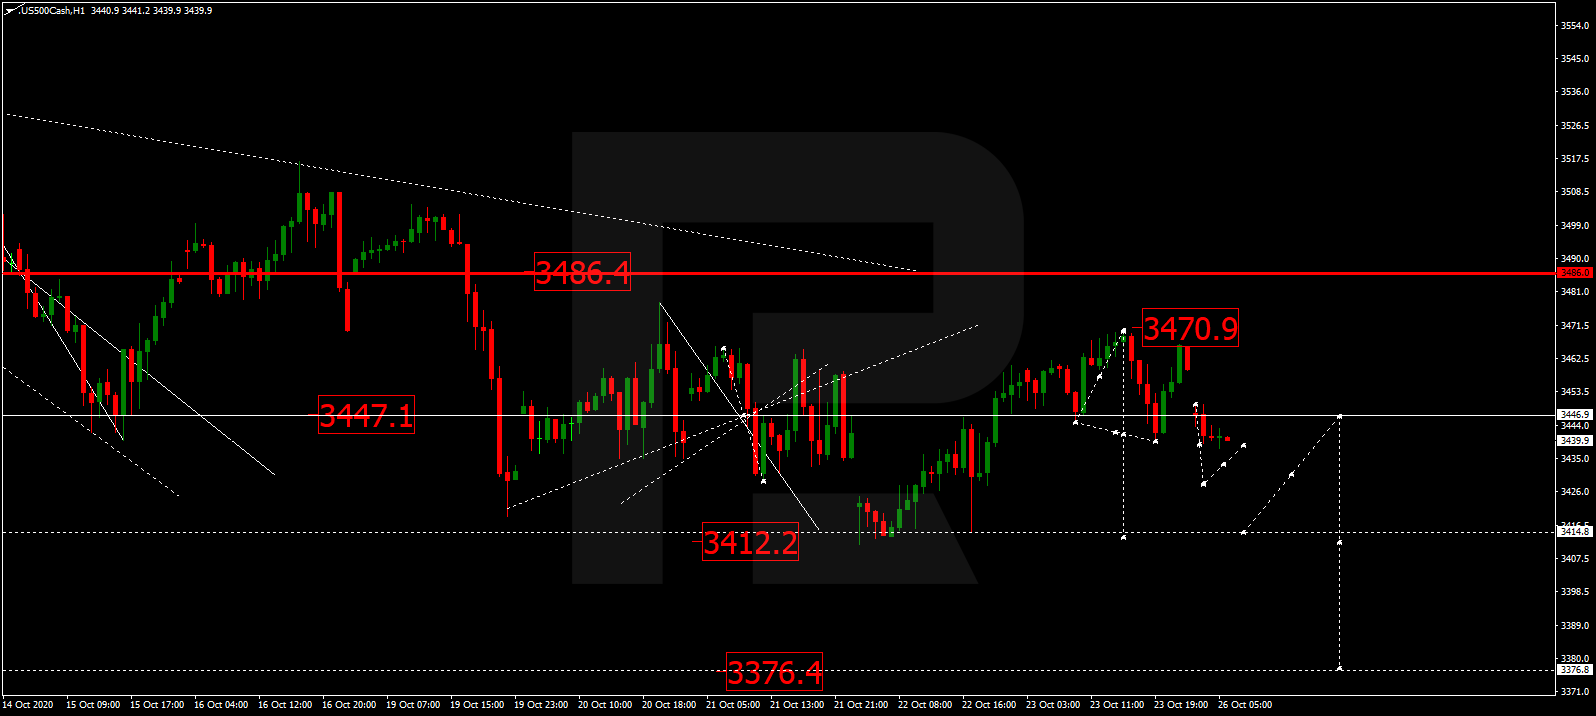
S&P 500

After completing the correction at 3500.2, the S&P index is moving upwards. Possibly, the asset may expand the range up to 3551.1 and then correct towards 3455.3. After that, the instrument may form one more ascending structure with the target at 3590.0.

S&P 500

Article By RoboForex.com

Attention!
Forecasts presented in this section only reflect the author’s private opinion and should not be considered as guidance for trading. RoboForex LP bears no responsibility for trading results based on trading recommendations described in these analytical reviews.

Mid-week technical outlook: Are Dollar bulls back in town?

By Lukman Otunuga, Research Analyst ForexTime

It looks like everyone wants a juicy piece of the world’s most liquid currency thanks to the International Monetary Fund’s (IMF) bleak forecast and fading US stimulus hopes.

Dollar bulls were injected with a fresh dosage of inspiration yesterday after the IMF warned that COVID-19 would cause “lasting damage” to the global economy. Appetite towards the Greenback was sweetened further by dimming hopes for more fiscal stimulus before the U.S election after House Speaker Nancy Pelosi a $1.8 trillion relief proposal from the White House. With rising coronavirus cases across the globe draining investor confidence and fostering a sense of unease, king Dollar could make a return in Q4.

What are the technicals saying?

Well, the Dollar Index (DXY) is under pressure on the monthly timeframe. It is still nursing deep wounds inflicted during Q3 as vaccine optimism and stimulus hopes turbocharged risk sentiment. There is something about the 94.00 resistance which has acted a dynamic level over the past few years. A solid monthly close above this point could open a path back towards 97.50 in the medium term. Alternatively, if 94.00 proves to be reliable resistance, then prices may slip back towards 92.00.

Weekly timeframe paints similar picture

Prices remain in a downtrend on the weekly charts as there have been consistently lower lows and lower highs. Prices are trading below the 20 Simple Moving Average while the MACD trades to the downside. If Dollar bulls are unable to break above the 94.80 lower high, the next key point of interest may be found around 92.00. Although technicals are in favour of bears, the fundamentals could throw the Dollar a much-needed lifeline.

A quick peek into the fundamentals

Speaking of fundamentals, US inflation rose in September at the slowest pace in four months, signalling little threat of rising inflation as the US economy heals. Consumer prices 0.2% from the prior month after 0.4% gain in August. So much for the Feds policy shift to let inflation rip higher….

Investors will direct their attention towards the latest unemployment claims data on Thursday and retail sales report on Friday. After increasing by a tepid 0.6% month-over-month in August, retail sales are forecast to rise by 0.7% in September.

Back to the technicals….

It’s all about the 94.00 resistance level on the daily charts. Bulls need to secure a solid daily close above this point to encourage a move towards 94.65 and 96.00. Prices are trading below the 20 and 50 SMA but the MACD trades to the upside. If the risk-off mood drags on amid fading stimulus hopes, election jitters and rising coronavirus cases, king Dollar may defy technicals by exploding higher.

Commodity spotlight – Gold

Just can’t help but feel that it has been the same old story with Gold.

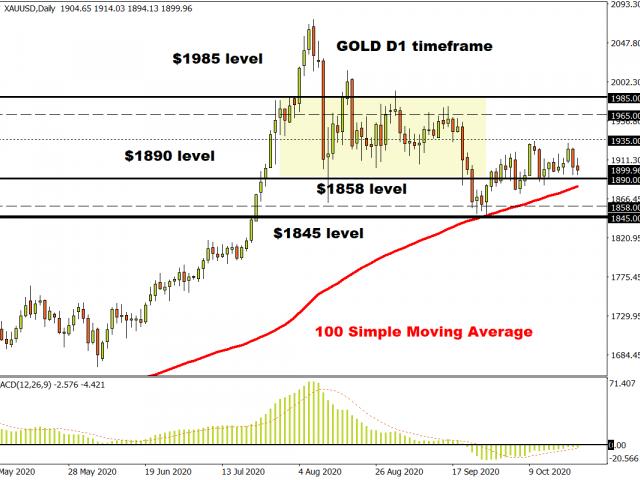
Prices remain rangebound despite the stimulus developments and rising coronavirus cases across the globe. If the Dollar continues to weaken on dimming stimulus hopes, this could drag Gold prices lower despite the risk-off mood. Looking at the technical picture, the metal is down almost 2% this week with a breakout/down setup in play. If $1890 proves to be unreliable support, prices could decline back towards $1858 and $1845. Alternatively, an intraday breakout above $1935 could open the doors towards $1965.

Disclaimer: The content in this article comprises personal opinions and should not be construed as containing personal and/or other investment advice and/or an offer of and/or solicitation for any transactions in financial instruments and/or a guarantee and/or prediction of future performance. ForexTime (FXTM), its affiliates, agents, directors, officers or employees do not guarantee the accuracy, validity, timeliness or completeness, of any information or data made available and assume no liability as to any loss arising from any investment based on the same.


Forex-Time-LogoArticle by ForexTime

ForexTime Ltd (FXTM) is an award winning international online forex broker regulated by CySEC 185/12 www.forextime.com

EURUSD Trades Flat, But Steady Above 1.1800

By Orbex

The euro currency is trading rather muted on Monday. Price action did not make many gains as the US markets are closed on account of Columbus Day bank holiday.

On an intraday basis, the euro briefly tested the 1.1800 level. The euro was pushed back higher after prices were rejected below this level.

Looking at the Stochastics oscillator, we could see another bout of strength in the common currency.

Therefore, it is quite possible for the 1.1900 level to become the next key resistance level to be tested.

By Orbex

Japanese Candlesticks Analysis 13.10.2020 (EURUSD, USDJPY, EURGBP)

Article By RoboForex.com

EURUSD, “Euro vs. US Dollar”

As we can see in the H4 chart, the asset is finishing the correction within the downtrend. By now, EURUSD has formed several reversal patterns, such as Hanging Man, close to the channel’s upside border. Possibly, the pair may reverse and resume its decline. In this case, the downside target may be the next support level at 1.1705. At the same time, an alternative scenario says that the instrument may grow to reach 1.1875 before resuming the downtrend.

EURUSD
Risk Warning: the result of previous trading operations do not guarantee the same results in the future

USDJPY, “US Dollar vs. Japanese Yen”

As we can see in the H4 chart, the asset is finishing the correction within the uptrend. After forming several reversal patterns, such as Hammer, not far from the support level, USDJPY may rebound from this level, and resume the ascending tendency. In this case, the upside target is the resistance level at 106.45. Still, there is an opposite scenario, which says that the instrument may correct towards 105.00 before resuming the uptrend.

USDJPY
Risk Warning: the result of previous trading operations do not guarantee the same results in the future

EURGBP

As we can see in the H4 chart, the descending tendency continues. After forming several reversal patterns, including Hammer, close to the support level, EURGBP is still reversing. The correctional target is the resistance level at 0.9110. However, there might be another scenario, according to which the asset may continue falling without reversing. In this case, the downside target will be the next support level at 0.8990.

EURGBP

Article By RoboForex.com

Attention!
Forecasts presented in this section only reflect the author’s private opinion and should not be considered as guidance for trading. RoboForex LP bears no responsibility for trading results based on trading recommendations described in these analytical reviews.

Ichimoku Cloud Analysis 13.10.2020 (GBPUSD, USDZAR, EURUSD)

Article By RoboForex.com

GBPUSD, “Great Britain Pound vs US Dollar”

GBPUSD is trading at 1.3050; the instrument is moving above Ichimoku Cloud, thus indicating an ascending tendency. The markets could indicate that the price may test the cloud’s upside border at 1.3005 and then resume moving upwards to reach 1.3140. Another signal in favor of further uptrend will be a rebound from the rising channel’s downside border. However, the bullish scenario may no longer be valid if the price breaks the cloud’s downside border and fixes below 1.2965. In this case, the pair may continue falling towards 1.2675.

GBPUSD
Risk Warning: the result of previous trading operations do not guarantee the same results in the future

USDZAR, “US Dollar vs South African Rand”

USDZAR is trading at 16.51; the instrument is moving below Ichimoku Cloud, thus indicating a descending tendency. The markets could indicate that the price may test the cloud’s downside border at 16.55 and then resume moving downwards to reach 15.95. Another signal in favor of further downtrend will be a rebound from the upside border of the Triangle pattern. However, the bearish scenario may no longer be valid if the price breaks the cloud’s upside border and fixes above 16.95. In this case, the pair may continue growing towards 17.75. To confirm further decline, the asset must break the pattern’s downside border and fix below 16.30.

USDZAR
Risk Warning: the result of previous trading operations do not guarantee the same results in the future

EURUSD, “Euro vs US Dollar”


EURUSD

Article By RoboForex.com

Attention!
Forecasts presented in this section only reflect the author’s private opinion and should not be considered as guidance for trading. RoboForex LP bears no responsibility for trading results based on trading recommendations described in these analytical reviews.