Archive for Forex and Currency News – Page 349

Technical outlook: G10 currencies on standby

By Lukman Otunuga, Research Analyst, ForexTime

Anyone else feeling a strong sense of anticipation mounting across FX markets as the US Presidential election looms?

Over the past few weeks, most major currencies (excluding the Pound) have struggled for direction as investors remained on the side-lines ahead of the massive risk event on November 3rd.

According to Polls, Democrat challenger Joe Biden is currently leading Donald Trump. Whatever the outcome, the US election result will certainly have a lasting impact on currency markets.

Since most major currencies have found comfort within tight ranges, this may present some technical breakout/down opportunities in November.

Today, we will be focusing on the weekly charts for our technical setups are the setups discussed are longer term.

EURUSD yearns for freedom

Looking at the EURUSD on the weekly channel, it resembles a caged beast that yearns for freedom.

Minor support can be found around 1.1700 and minor resistance around 1.1190. Significant levels of interest remain around the 1.1610 higher low and 1.2000 psychological resistance. Prices remain bullish on the weekly timeframe as long as the 1.16100 proves to be reliable support. Should the EURUSD break above 1.1900 and attack 1.2000, this may open the doors towards levels not seen since April 2018 around 1.2250.

GBPUSD remains in an uptrend

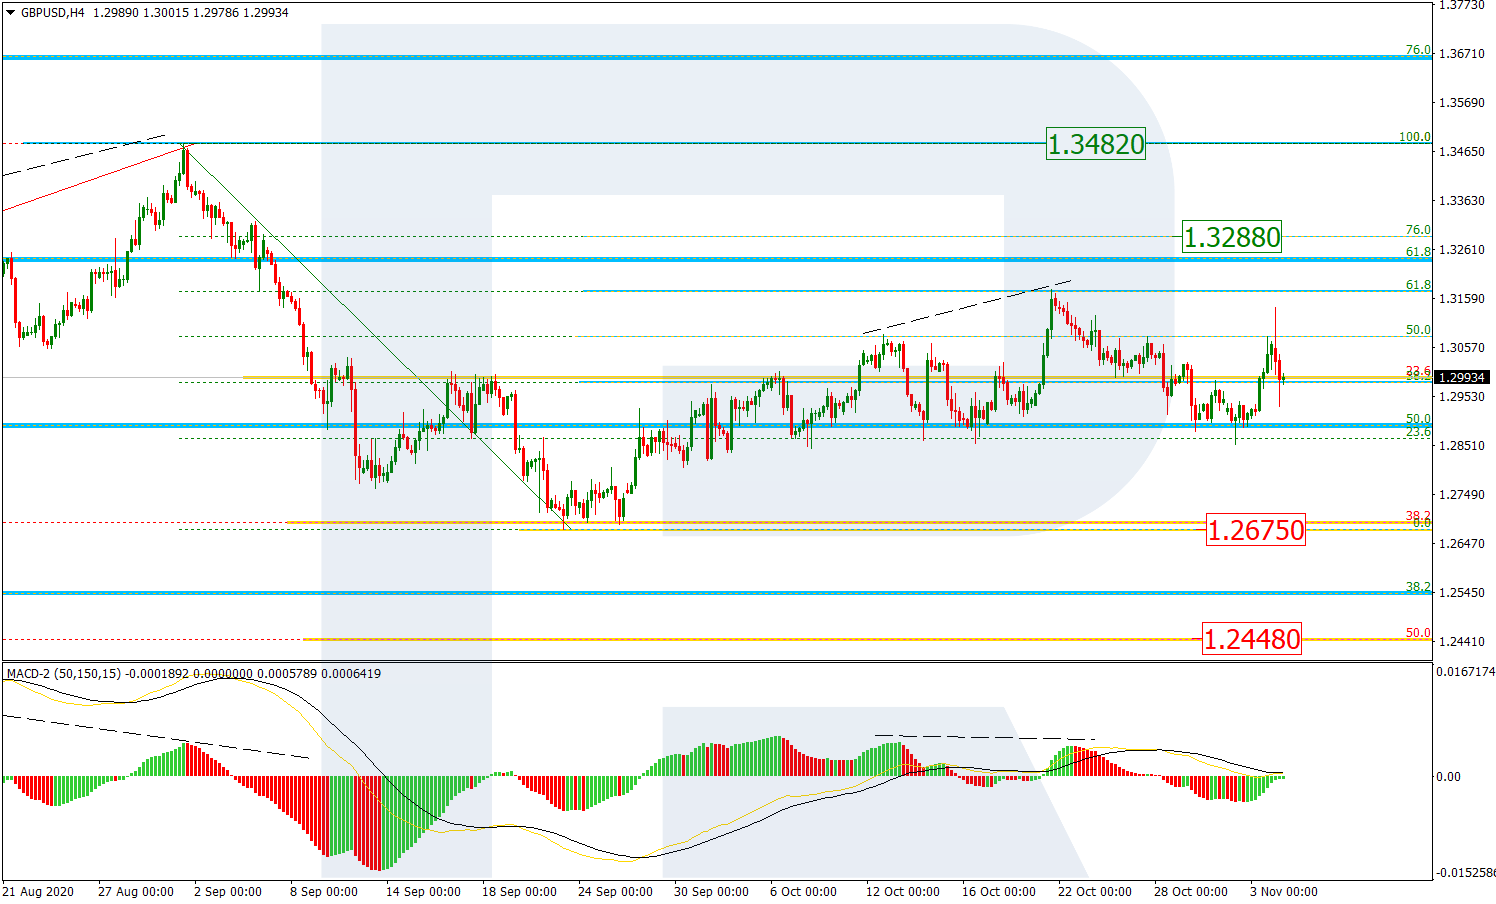
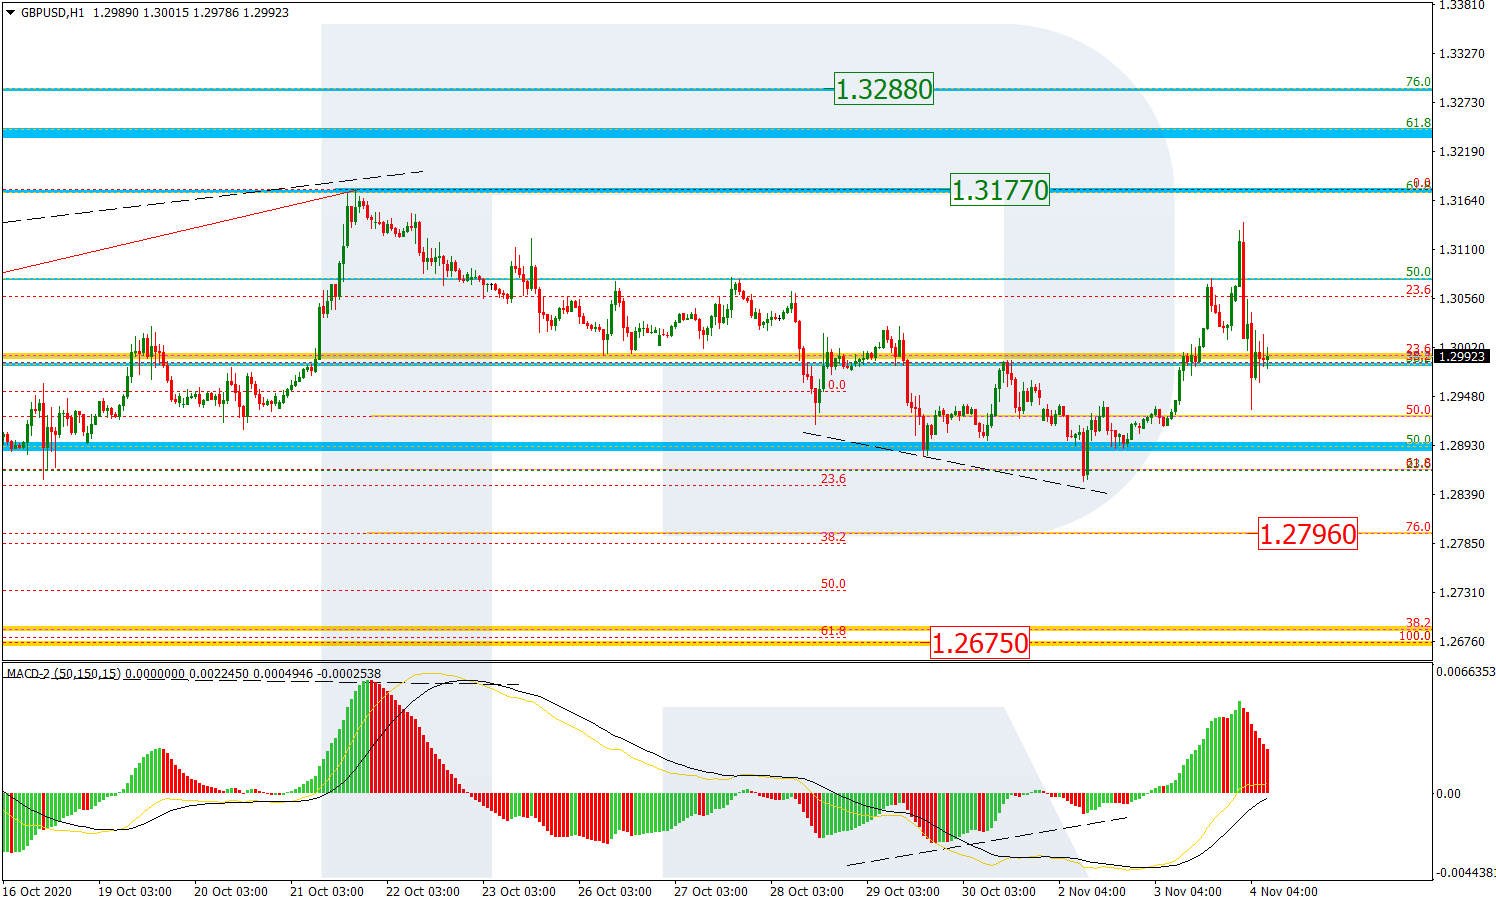
Despite all the gloom, doom and drama around Brexit, the GBPUSD still remains in an uptrend on the weekly charts. There is a suspicion that the positive Pound’s performance could be attributed to Dollar weakness. However, technicals are suggesting that bulls remain in control as long as prices can keep above the 1.2650 support level.

Last week the Pound was injected with a renewed dosage of confidence as fears of a no-deal Brexit slightly eased on encouraging comments from the EU’s chief negotiator. Looking ahead, the GBPUSD could extend its tentacles back towards 1.3200 if 1.3000 proves to be reliable support.

However, a breakdown below 1.3000 may open the doors back towards 1.2850 and 1.2650, respectively.

USDJPY breakdown in the making?

It is safe to say that the USDJPY remains in a downtrend on the weekly charts as there have been consistently lower lows and lower highs. Over the past few weeks, it has been the same old story with the currency pair oscillating within a range. However, prices are slowing approaching a significant support level that could open the doors to further downside.

A solid weekly close below 104.00 could trigger a selloff towards 102.40. However, should prices break back above 105.00, the USDJPY has the potential to rally back towards 106.50.

It must be kept in mind that due to the nature of the Japanese Yen as a safe-haven currency, its outlook may be influenced by the US Presidential election on November 3rd.

AUDUSD descending triangle…

A descending triangle technical formation can be seen on the weekly timeframe.

If the 0.7000 proves to be unreliable support, this could signal a decline towards 0.6780. A breakout above 0.7250 may signal a move towards the 0.7500 level.

Disclaimer: The content in this article comprises personal opinions and should not be construed as containing personal and/or other investment advice and/or an offer of and/or solicitation for any transactions in financial instruments and/or a guarantee and/or prediction of future performance. ForexTime (FXTM), its affiliates, agents, directors, officers or employees do not guarantee the accuracy, validity, timeliness or completeness, of any information or data made available and assume no liability as to any loss arising from any investment based on the same.


Forex-Time-LogoArticle by ForexTime

ForexTime Ltd (FXTM) is an award winning international online forex broker regulated by CySEC 185/12 www.forextime.com

The Week Ahead: The Art Of A Deal

By Orbex

USDJPY Stalls as Massive Stimulus Looms

Markets see the US stimulus package as a done deal, the only question is whether it will be a $1.9 or $2.2 trillion dollar check. Either way, money printing of this magnitude would only make the greenback cheaper. Market’s jitters are more a result of traders’ positioning ahead of the US election, and the latest rebound is a sign of short-covering rather than fresh buying.

On the other side of the Pacific, the Bank of Japan is expected to be dovish and cut its growth projection. This will possibly give the dollar some breathing room.

The pair is testing the support level of 104.00 and a bearish breakout could trigger a sell-off into 102s.

GBPAUD Grinds Higher After Talks Resume

The pound has been holding well across the board despite intraday whipsaws from the Brexit stalemate a week ago. The market seems to be skewed to the upside now that trade negotiations have resumed.

Both sides are seemingly incentivized to clinch a deal and that is what keeps the hope alive. As traders start to price in a deal by the end of November, every bit of positive news could help the cause. In the meantime, the short side is likely to cover and further lift the price action.

After surging above 1.8400 the pair may have cleared the way for an extended rally. 1.7900 is a key support to retain the bullish sentiment.

EURJPY Under Pressure as Restrictions Extended

The euro is struggling to keep its lead after a four-month-long rally against the yen. While Covid-related restrictions have been ramping up across the eurozone, ECB President Christine Lagarde has warned that the recovery could lose momentum.

Nevertheless, the central bank is expected to maintain a wait-and-see approach in the upcoming policy meeting. This may mitigate the downside risk for the single currency.

The follow-up CPI and GDP data are likely to raise short-term volatility in favor of a post-ECB direction.

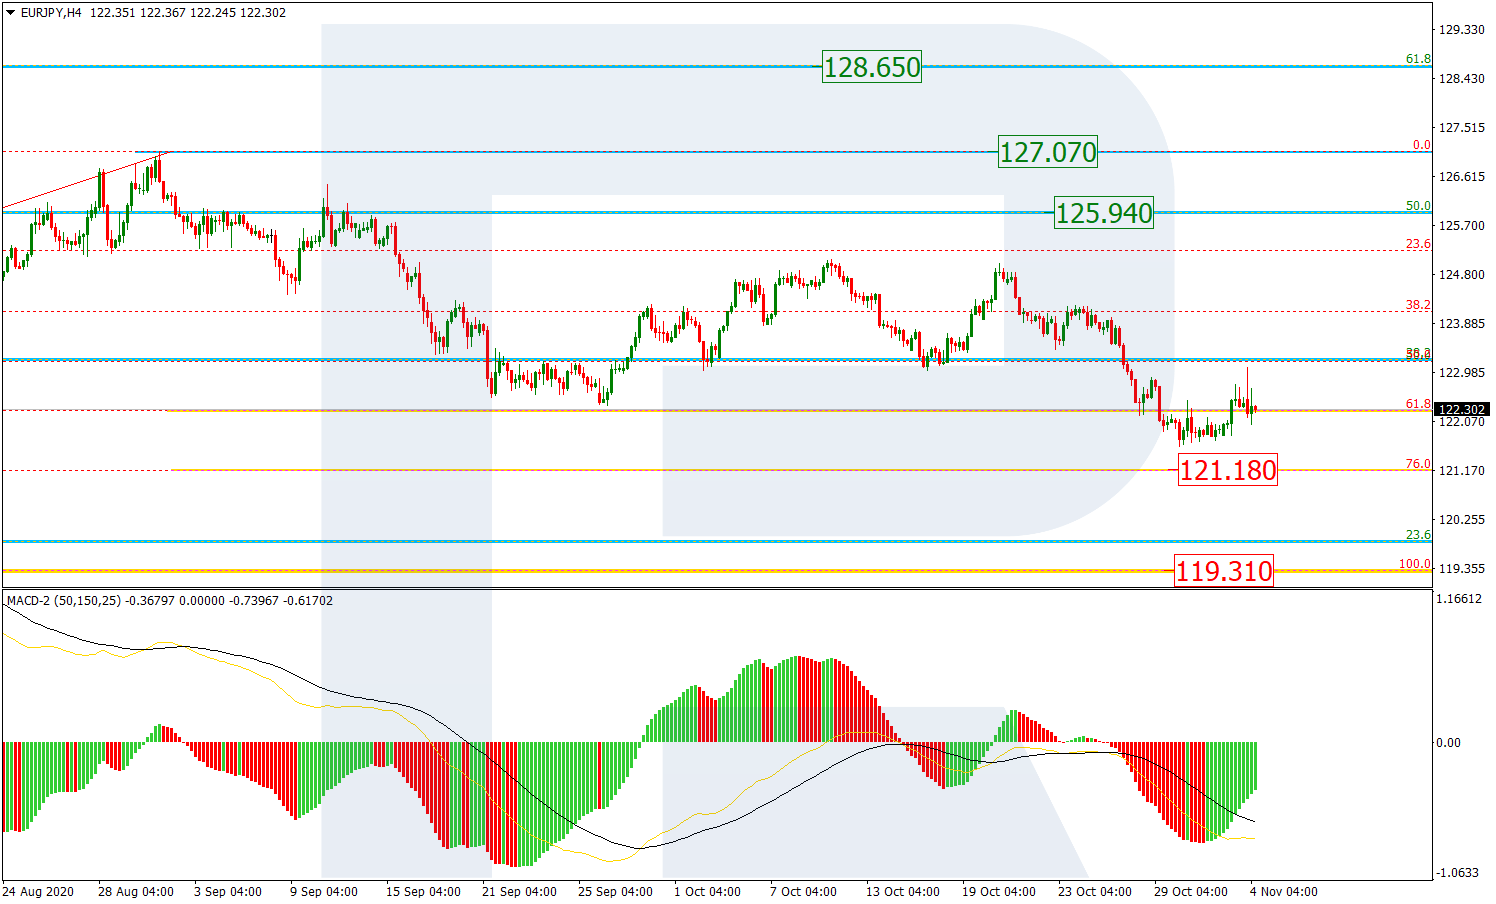
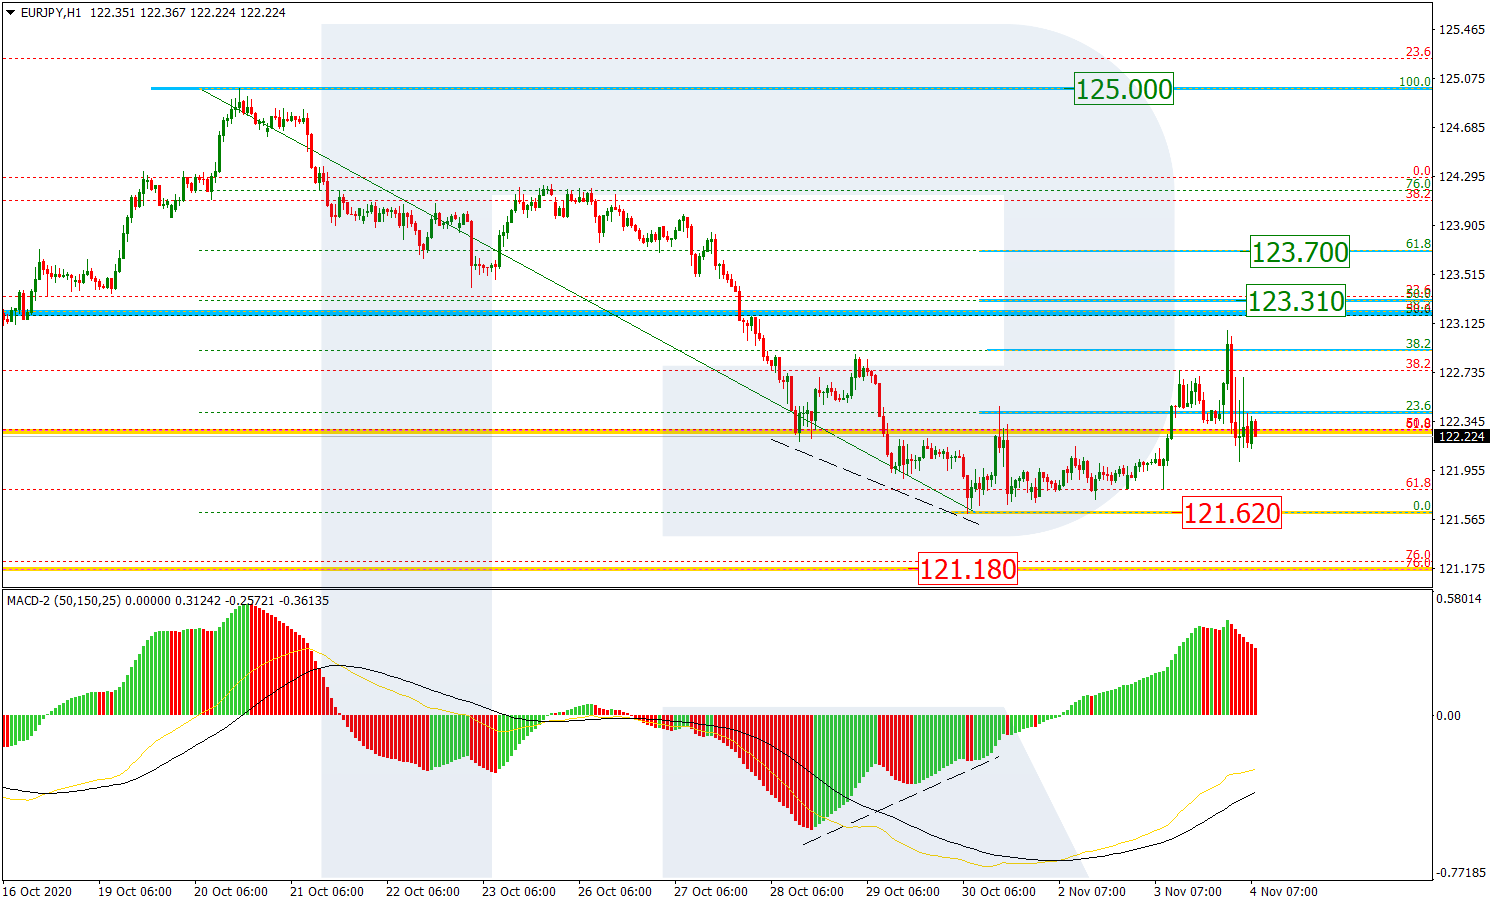
The euro is making an attempt to climb back to September’s high of 126.60 with 122.50 as major support.

CADCHF Eases off Ahead of BoC Decision

The Canadian dollar stays in a tight range against the Swiss franc as markets await guidance from the Bank of Canada this week.

The latest retail sales figure came out below expectations. To address weakness in the economic recovery, the central bank could be forced into further support measures.

The lack of negative rates in their vocabulary, for now, is what has kept a floor under the loonie. This is why markets will pay particular attention to policymakers’ willingness to leave the cash rate at 0.25%.

The pair is testing the immediate support of 0.6840. A rebound could challenge the supply zone between 0.6970 and 0.7000.

By Orbex

The Analytical Overview of the Main Currency Pairs on 2020.10.26

by JustForex

The EUR/USD currency pair

Technical indicators of the currency pair:
  • Prev Open: 1.18168
  • Open: 1.18574
  • % chg. over the last day: +0.36
  • Day’s range: 1.18133 – 1.18574
  • 52 wk range: 1.0637 – 1.2012

The EUR/USD currency pair has become stable. At the moment, quotes are consolidating. Investors are closely following the final stage of the election race between Donald Trump and Joe Biden, as well as new information concerning the stimulus package in the US. Local support and resistance levels are 1.1815 and 1.1845, respectively. Today, financial market participants will assess economic releases from Germany and the US. Positions should be opened from key levels.

The news feed on 2020.10.26:
  • – German IFO business climate index at 11:00 (GMT+2:00);
  • – New home sales in the US at 16:00 (GMT+2:00).
EUR/USD

Indicators do not give accurate signals: 50 MA has crossed 100 MA.

The MACD histogram is near the 0 mark. There are no signals at the moment.

Stochastic Oscillator is in the oversold zone, the %K line has crossed the %D line. There are no signals at the moment.

Trading recommendations
  • Support levels: 1.1815, 1.1790, 1.1760
  • Resistance levels: 1.1845, 1.1865, 1.1880

If the price fixes below 1.1815, EUR/USD quotes are expected to fall. The movement is tending to 1.1790-1.1760.

An alternative could be the growth of the EUR/USD currency pair to 1.1870-1.1900.

The GBP/USD currency pair

Technical indicators of the currency pair:
  • Prev Open: 1.30749
  • Open: 1.30540
  • % chg. over the last day: -0.31
  • Day’s range: 1.29927 – 1.30578
  • 52 wk range: 1.1409 – 1.3516

Sales prevail on the GBP/USD currency pair. Quotes set new local lows. At the moment, the British pound is testing the round level of 1.3000. The 1.3055 mark is the nearest resistance. The trading instrument has the potential for further correction. We recommend paying attention to the news feed from the US. Positions should be opened from key levels.

The publication of important UK economic releases is not planned.

GBP/USD

Indicators do not give accurate signals: the price is consolidating near the 100 MA.

The MACD histogram is in the negative zone, which indicates the bearish sentiment.

Stochastic Oscillator is in the neutral zone, the %K line is above the %D line, which gives a signal to buy GBP/USD.

Trading recommendations
  • Support levels: 1.3000, 1.2970, 1.2920
  • Resistance levels: 1.3055, 1.3100, 1.3145

If the price fixes below the round level of 1.3000, further correction of the GBP/USD currency pair is expected. The movement is tending to 1.2960-1.2940.

An alternative could be the growth of GBP/USD quotes to the round level of 1.3100.

The USD/CAD currency pair

Technical indicators of the currency pair:
  • Prev Open: 1.31319
  • Open: 1.31255
  • % chg. over the last day: -0.09
  • Day’s range: 1.31243 – 1.31843
  • 52 wk range: 1.2949 – 1.4669

USD/CAD quotes have been growing. The trading instrument has updated local highs. The demand for greenback has partially resumed. Currently, the loonie is testing 1.3180. The level of 1.3150 is the nearest support. The USD/CAD currency pair has the potential for further growth. We recommend paying attention to the dynamics of “black gold” prices. Positions should be opened from key levels.

The news feed on Canada’s economy is calm.

USD/CAD

Indicators signal the power of buyers: the price has fixed above 50 MA and 100 MA.

The MACD histogram has started growing, which indicates the bullish sentiment.

Stochastic Oscillator is in the overbought zone, the %K line has crossed the %D line. There are no signals at the moment.

Trading recommendations
  • Support levels: 1.3150, 1.3125, 1.3110
  • Resistance levels: 1.3180, 1.3205, 1.3235

If the price fixes above 1.3180, further growth in USD/CAD quotes is expected. The movement is tending to 1.3200-1.3230.

An alternative could be a decrease in the USD/CAD currency pair to 1.3125-1.3100.

The USD/JPY currency pair

Technical indicators of the currency pair:
  • Prev Open: 104.863
  • Open: 104.656
  • % chg. over the last day: -0.12
  • Day’s range: 104.656 – 104.977
  • 52 wk range: 101.19 – 112.41

There is an ambiguous technical pattern on the USD/JPY currency pair. The trading instrument is in a sideways trend. At the moment, the following local support and resistance levels can be distinguished: 104.65 and 104.95, respectively. Financial market participants expect additional drivers. We recommend paying attention to the dynamics of US government bonds yield. Positions should be opened from key levels.

The news feed for Japan’s economy is calm.

USD/JPY

Indicators do not give accurate signals: the price has crossed the 50 MA and 100 MA.

The MACD histogram has started growing, which indicates the bullish sentiment.

Stochastic Oscillator is in the neutral zone, the %K line is below the %D line, which gives a signal to sell USD/JPY.

Trading recommendations
  • Support levels: 104.65, 104.55, 104.40
  • Resistance levels: 104.95, 105.10, 105.30

If the price fixes below 104.65, USD/JPY quotes are expected to fall. The movement is tending to 104.40-104.10.

An alternative could be the growth of the USD/JPY currency pair to 105.20-105.40.

by JustForex


This article reflects a personal opinion and should not be interpreted as an investment advice, and/or offer, and/or a persistent request for carrying out financial transactions, and/or a guarantee, and/or a forecast of future events.

Forex Technical Analysis & Forecast 26.10.2020

Article By RoboForex.com

EURUSD, “Euro vs US Dollar”

After finishing the correction at 1.1864, EURUSD is falling to reach 1.1818 and may later form one more ascending structure towards 1.1839. After that, the instrument may resume trading downwards to break 1.1772 and then continue falling with the target at 1.1688.

EURUSD
Risk Warning: the result of previous trading operations do not guarantee the same results in the future

GBPUSD, “Great Britain Pound vs US Dollar”

GBPUSD is falling towards 1.2989. Possibly, today the pair may reach this level and then start another growth towards 1.3070. After that, the instrument may resume falling with the short-term target at 1.2900. If later the price breaks this level, the market may continue trading within the downtrend to reach 1.2840.

GBPUSD
Risk Warning: the result of previous trading operations do not guarantee the same results in the future

USDRUB, “US Dollar vs Russian Ruble”

After completing the descending wave at 75.12, USDRUB is consolidating above this level. Possibly, the pair may expand the range up to 76.00 and then start a new correction to reach 77.00. If later the price breaks the latter level, the instrument may continue the correction to test 78.20 from below.

USDRUB
Risk Warning: the result of previous trading operations do not guarantee the same results in the future

USDJPY, “US Dollar vs Japanese Yen”

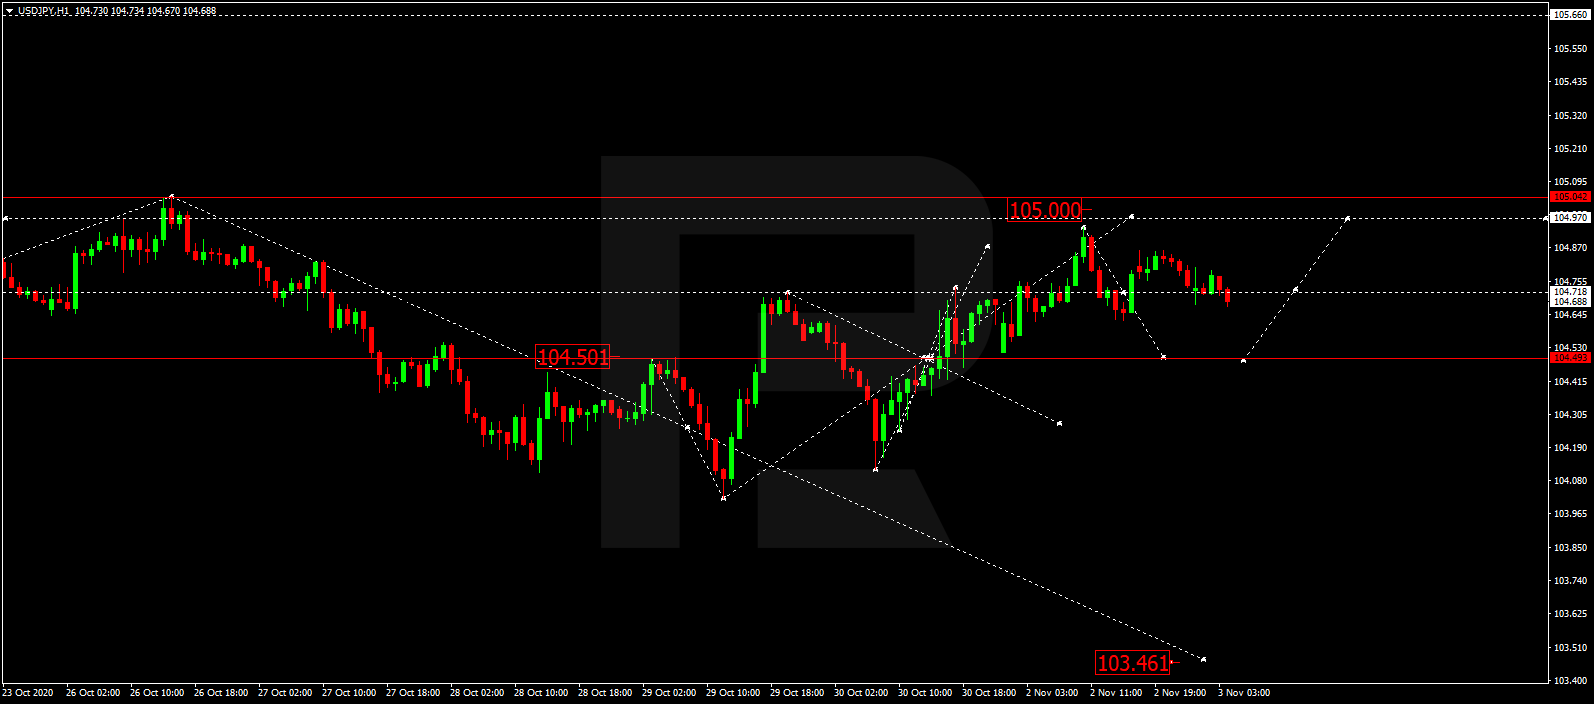
USDJPY is still correcting towards 105.02. Today, the pair may reach this level and then resume moving downwards with the first target at 103.84. The key downside target is at 102.50.

USDJPY
Risk Warning: the result of previous trading operations do not guarantee the same results in the future

USDCHF, “US Dollar vs Swiss Franc”

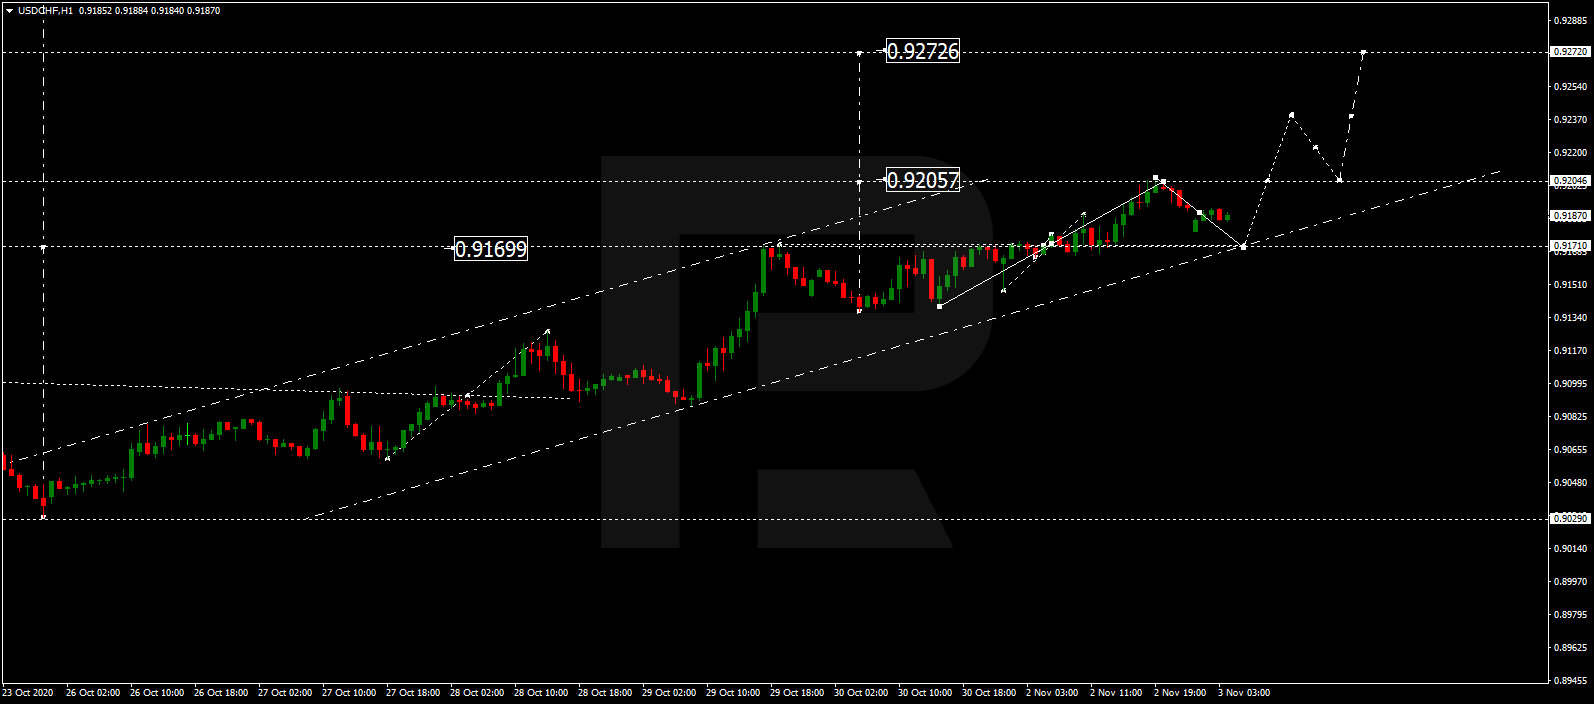
USDCHF is still consolidating above 0.9030. Possibly, the pair may expand the range down to 0.9024 and then form one more ascending structure to break 0.9090. Later, the market may continue trading within the uptrend with the target at 0.9165.

USDCHF
Risk Warning: the result of previous trading operations do not guarantee the same results in the future

AUDUSD, “Australian Dollar vs US Dollar”

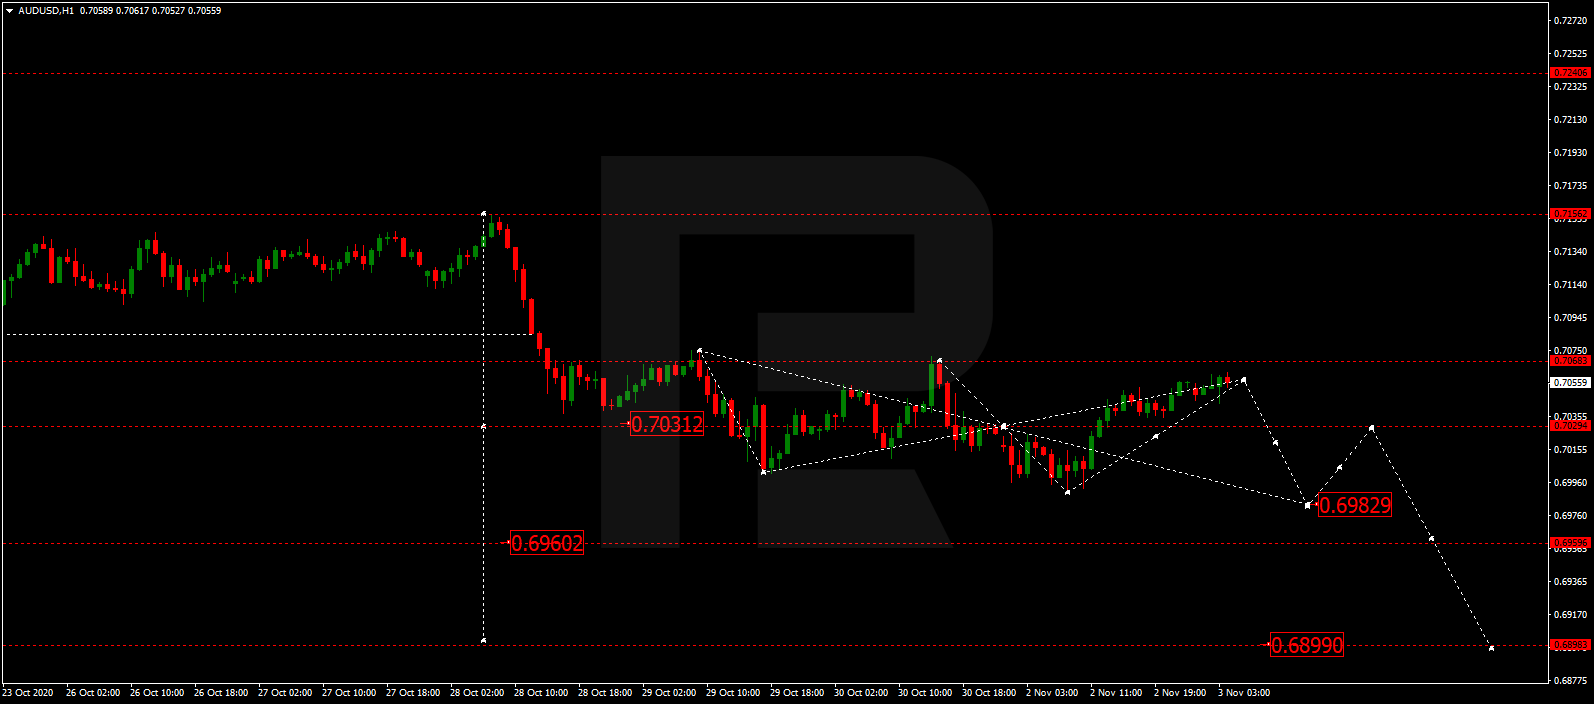
AUDUSD is still falling towards 0.7092 and may later correct to reach 0.7125. After that, the instrument may resume moving within the downtrend with the target at 0.7050 or even 0.7020.

AUDUSD
Risk Warning: the result of previous trading operations do not guarantee the same results in the future

BRENT

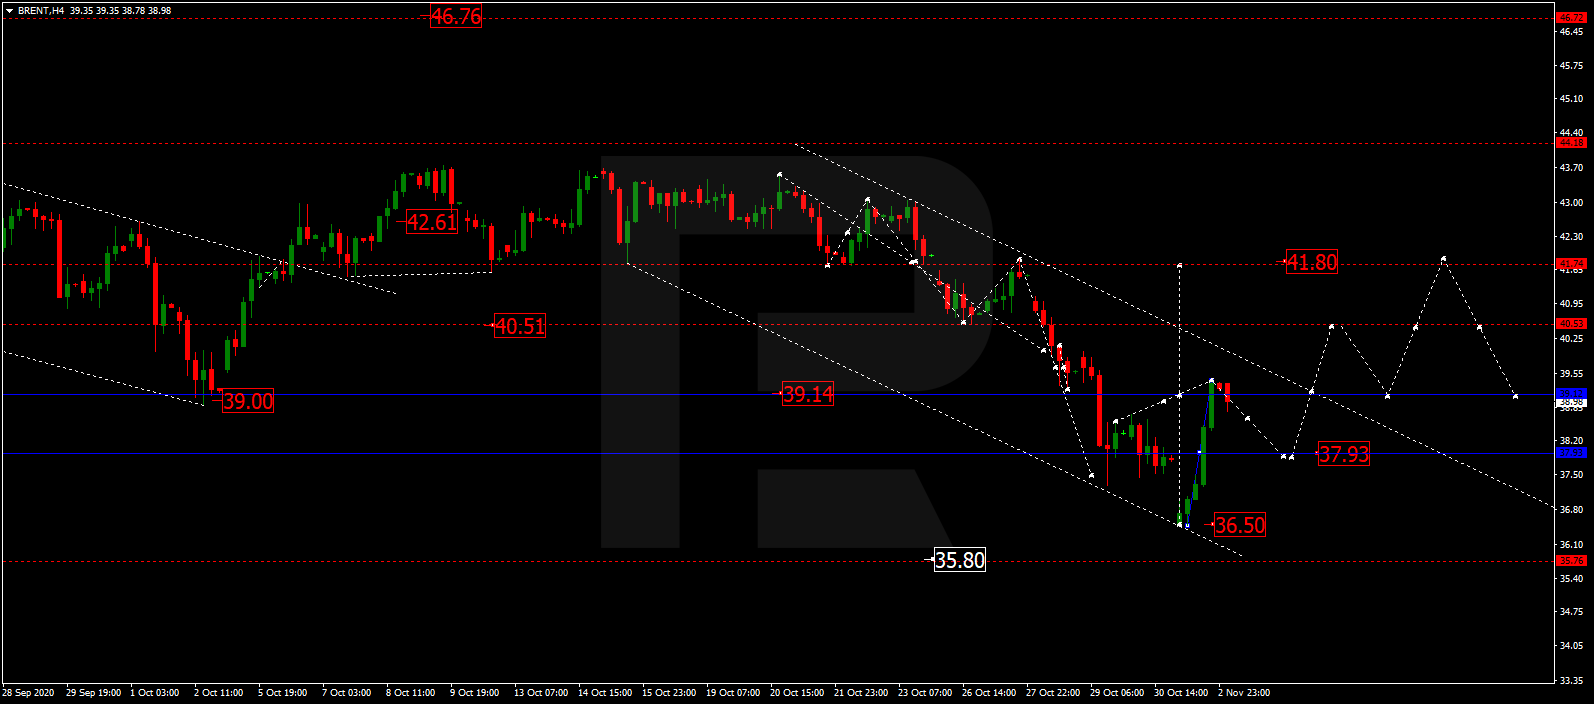
After completing the descending wave at 41.50. Brent is expected to consolidate around this level. If later the price breaks this range to the upside, the market may start another growth towards 42.85; if to the downside – continue the correction with the target at 39.50.

BRENT
Risk Warning: the result of previous trading operations do not guarantee the same results in the future

XAUUSD, “Gold vs US Dollar”

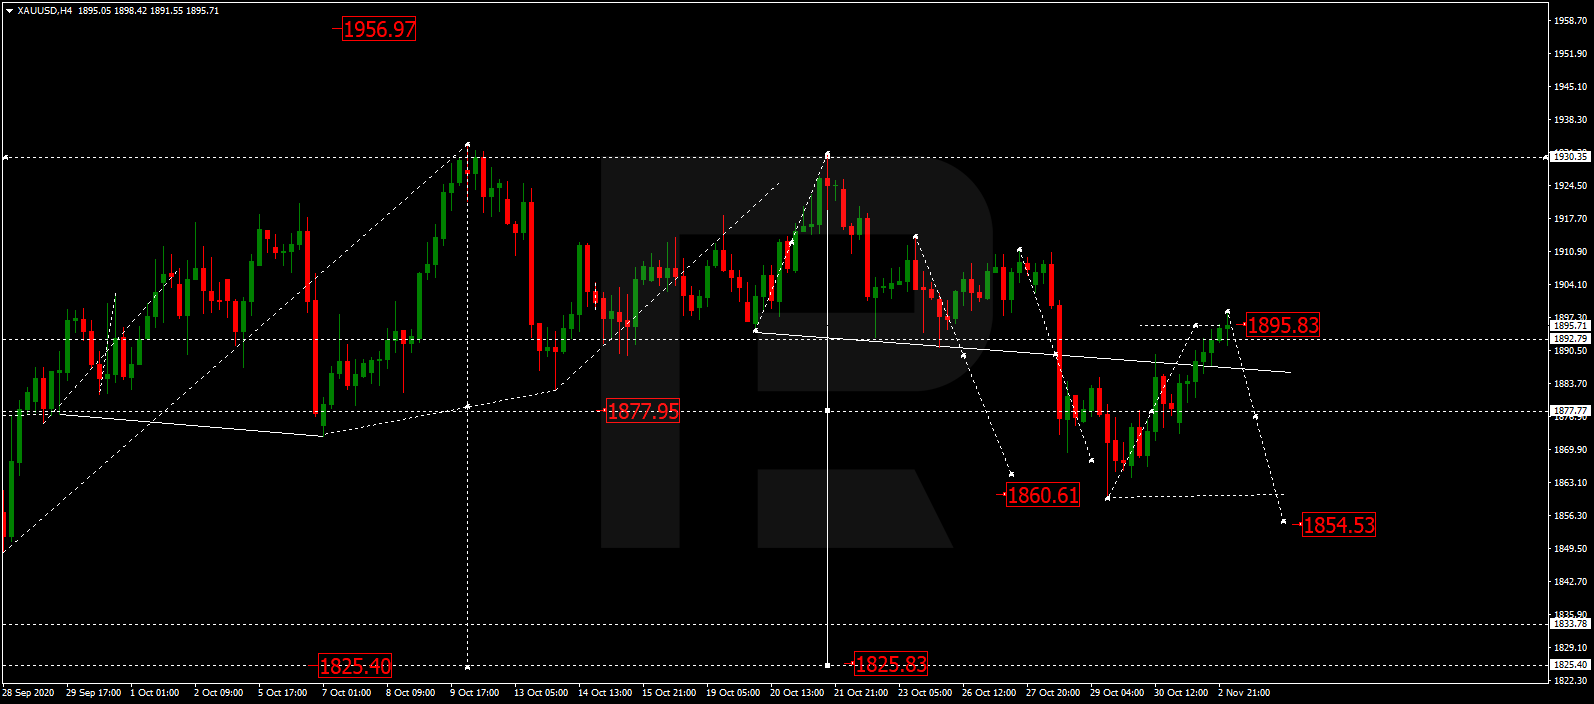
After finishing the descending structure at 1893.10 along with the correction towards 1924.20, Gold is falling to break 1893.50. According to the main scenario, the price is expected to continue trading within the downtrend with the short-term target at 1872.02. After that, the instrument may correct to test 1893.00 from below and then resume moving within the downtrend with the target at 1854.15.

GOLD
Risk Warning: the result of previous trading operations do not guarantee the same results in the future

BTCUSD, “Bitcoin vs US Dollar”

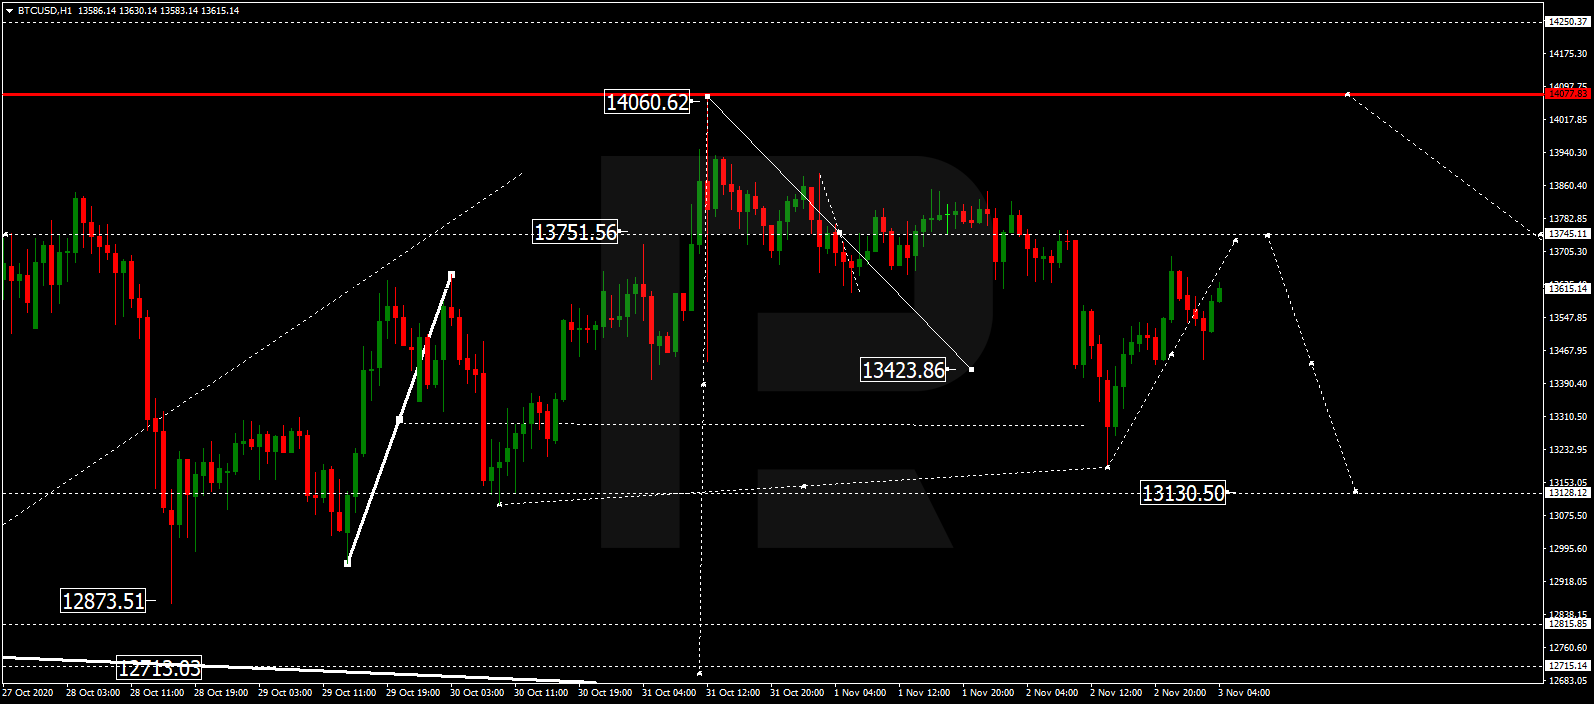
After finishing the ascending structure at 13300.00 along with the descending impulse towards 12840.00, BTCUSD is expected to consolidate between these two levels. If the price breaks the latter level to the downside, the market may continue falling towards 12500.00 or even 12300.00. However, if the pair grows and breaks 13300.00, the instrument may resume trading within the uptrend with the target at 13700.00 and then start a new decline to reach 12500.

BITCOIN
Risk Warning: the result of previous trading operations do not guarantee the same results in the future

S&P 500

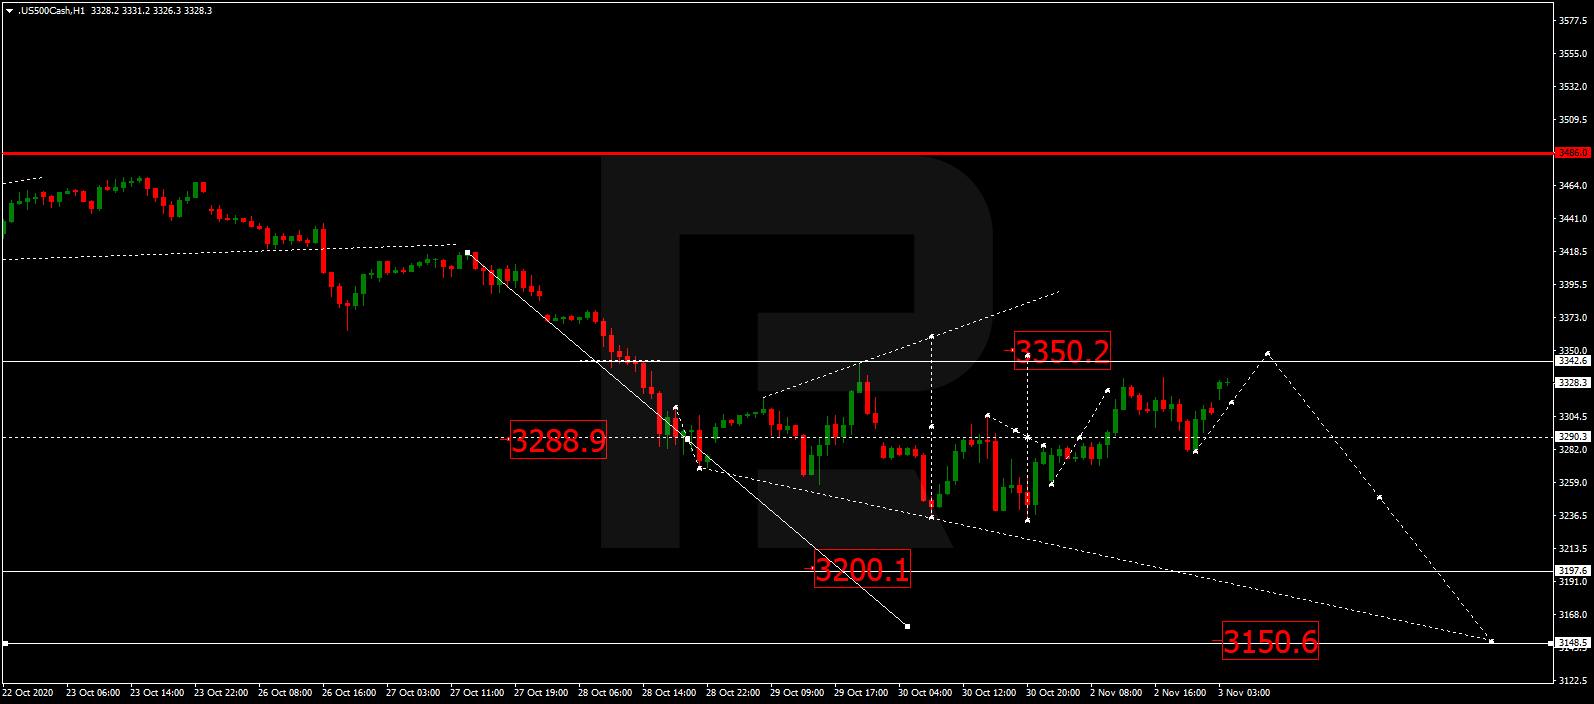
After completing the ascending wave at 3470.9, the S&P index is falling to break 3434.8 and may later continue trading downwards with the target at 3376.4. And that’s just a half of another descending wave. The main scenario implies that the price may continue falling to reach 3214.5.

S&P 500

Article By RoboForex.com

Attention!
Forecasts presented in this section only reflect the author’s private opinion and should not be considered as guidance for trading. RoboForex LP bears no responsibility for trading results based on trading recommendations described in these analytical reviews.


Fibonacci Retracements Analysis 26.10.2020 (GOLD, USDCHF)

Article By RoboForex.com

XAUUSD, “Gold vs US Dollar”

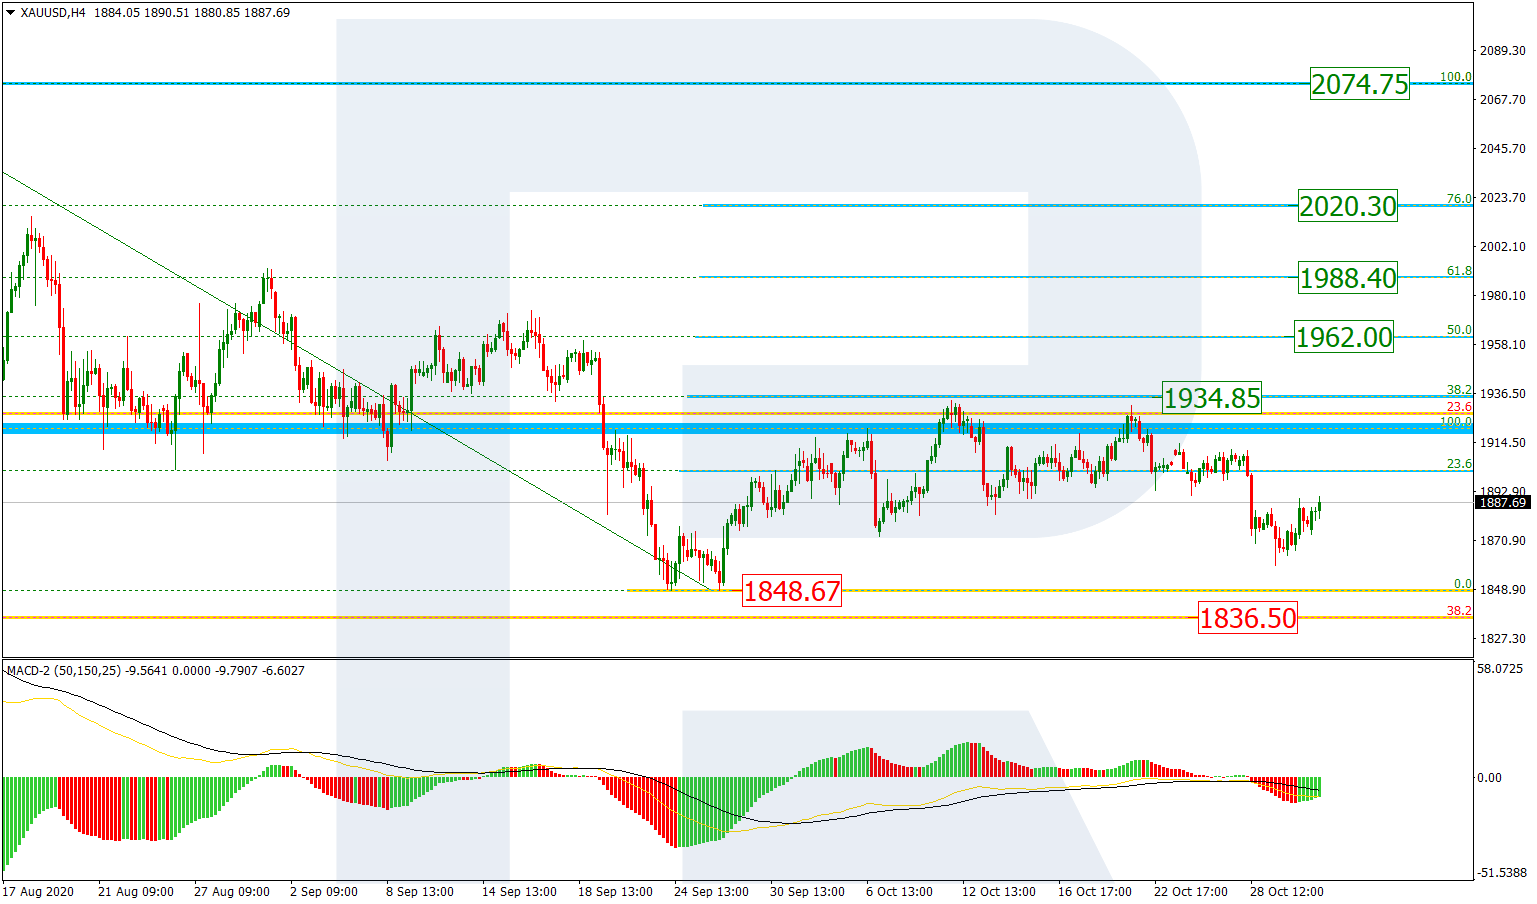
As we can see in the H4 chart, XAUUSD is still correcting below 38.2% fibo. The next upside targets may be 50.0%, 61.8%, and 76.0% fibo at 1962.00, 1988.40, 2020.30 respectively. However, an opposite scenario, which is equally possible, implies that the price may start a new decline to break the low at 1848.67 and then reach the long-term 38.2% and 50.0% fibo at 1836.50 and 1763.40 respectively.

GOLD_H4
Risk Warning: the result of previous trading operations do not guarantee the same results in the future

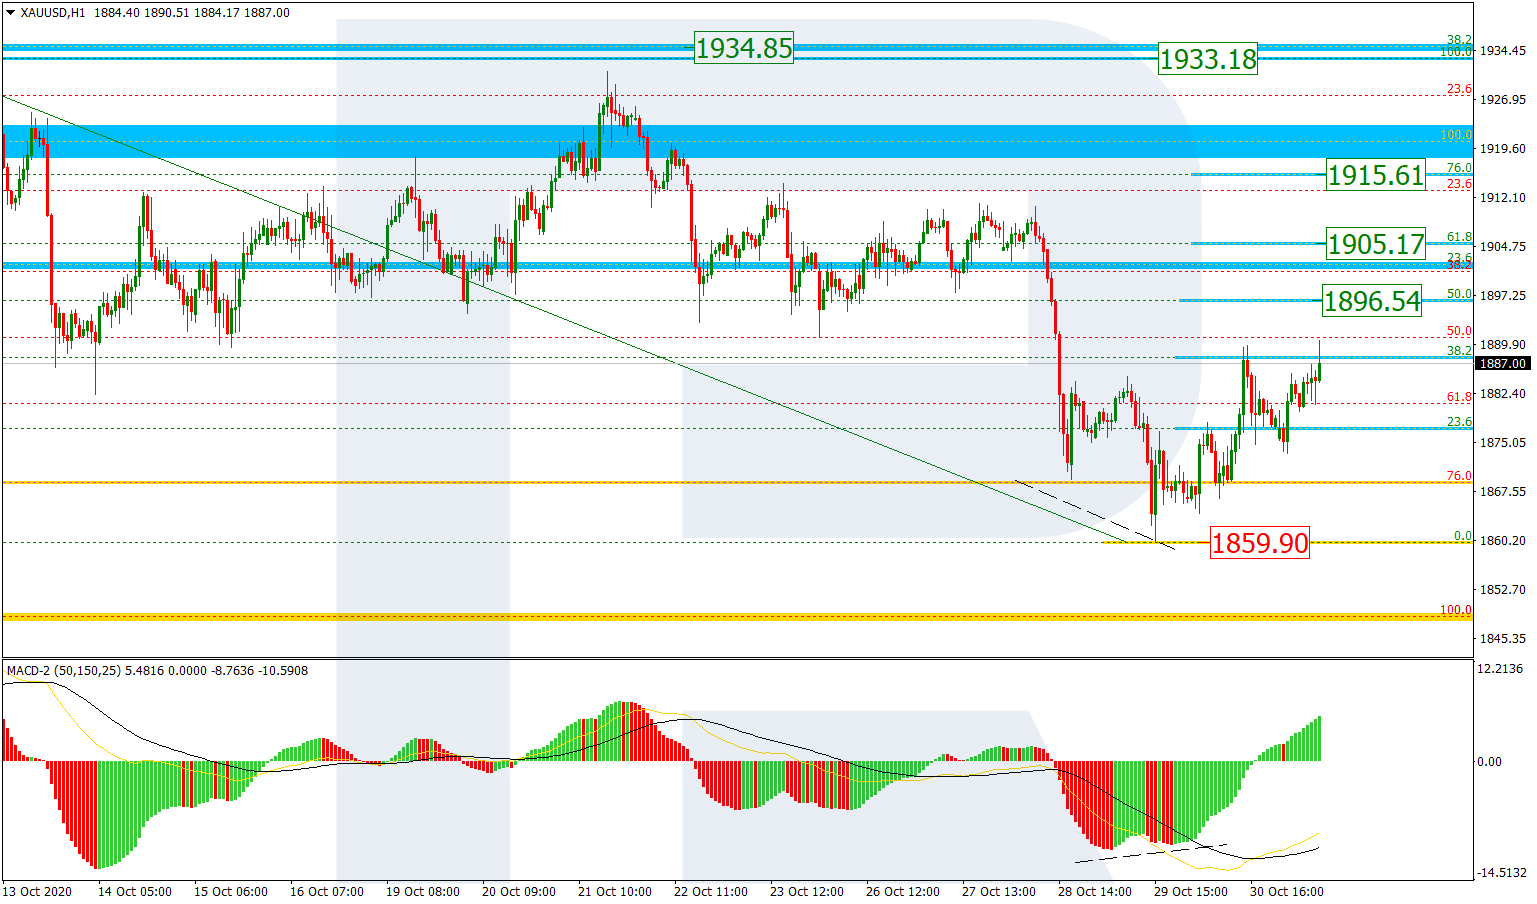
In the H1 chart, after the divergence, the descending wave tried to test 61.8% fibo at 1880.90. After that, the instrument reached the high at 1933.18 but failed to break it. Judging by the current descending wave, the asset is expected to continue falling towards 76.0% fibo at 1868.90.

GOLD_H1
Risk Warning: the result of previous trading operations do not guarantee the same results in the future

USDCHF, “US Dollar vs Swiss Franc”

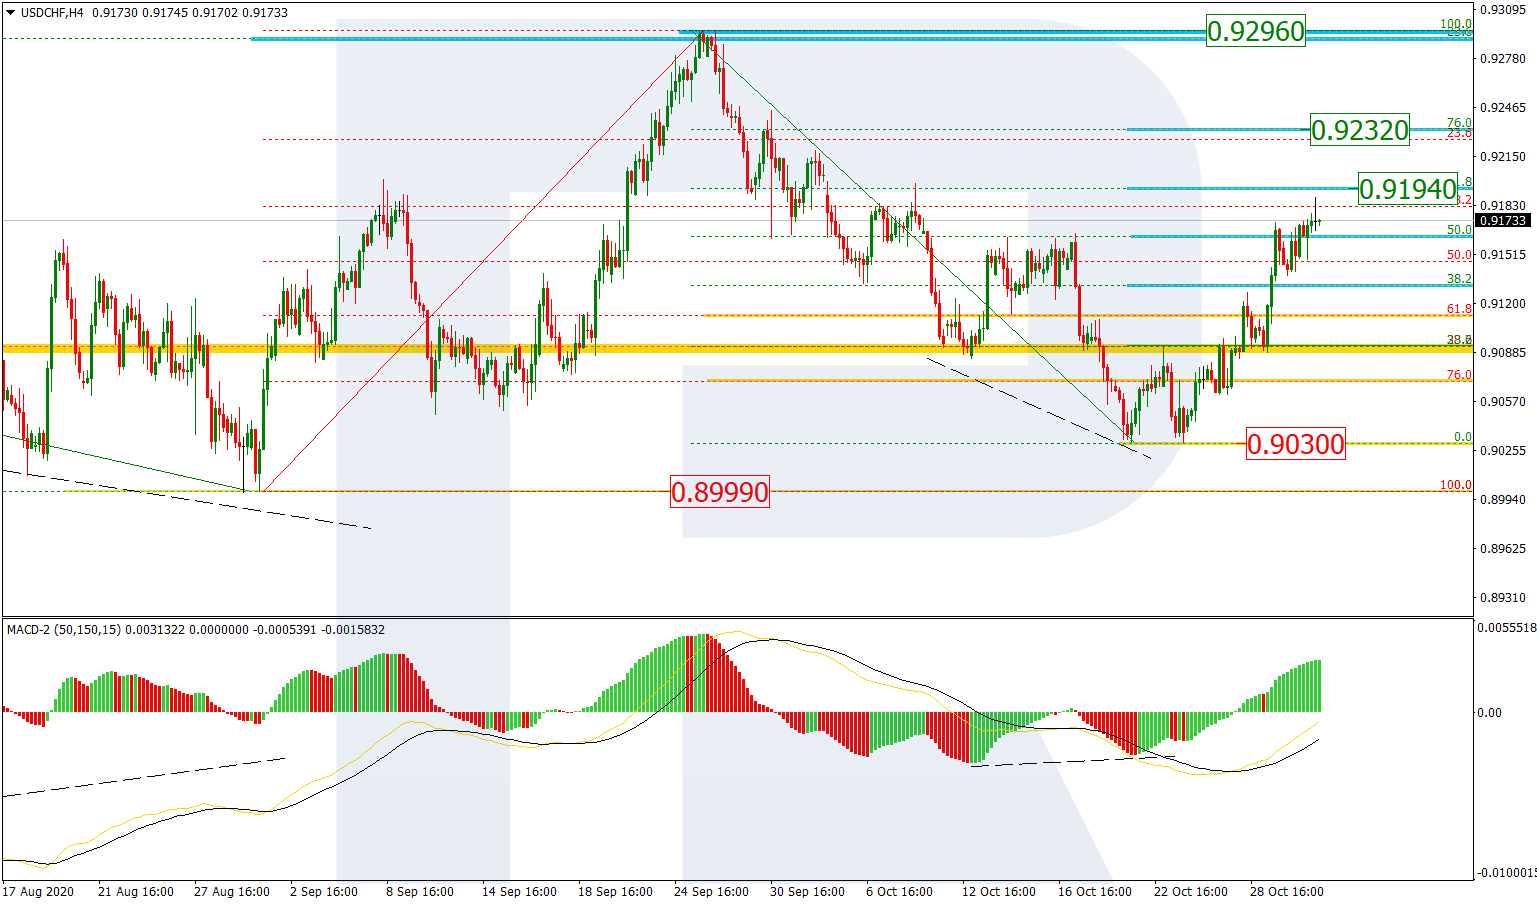
As we can see in the H4 chart, the descending wave has stopped not far from the low at 0.8999, and right now the asset is testing 76.0% fibo at 0.9070. Also, there is a convergence on MACD, which may indicate a reversal of the local tendency and a new mid-term rising wave towards the high at 0.9296 and then 38.2% fibo at 0.9472. At the same time, one shouldn’t forget about a possible breakout of the low at 0.8999. If it happens, USDCHF may continue falling to reach the post-correctional extension area between 138.2% and 161.8% fibo at 0.8885 and 0.8816 respectively.

USDCHF_H4
Risk Warning: the result of previous trading operations do not guarantee the same results in the future

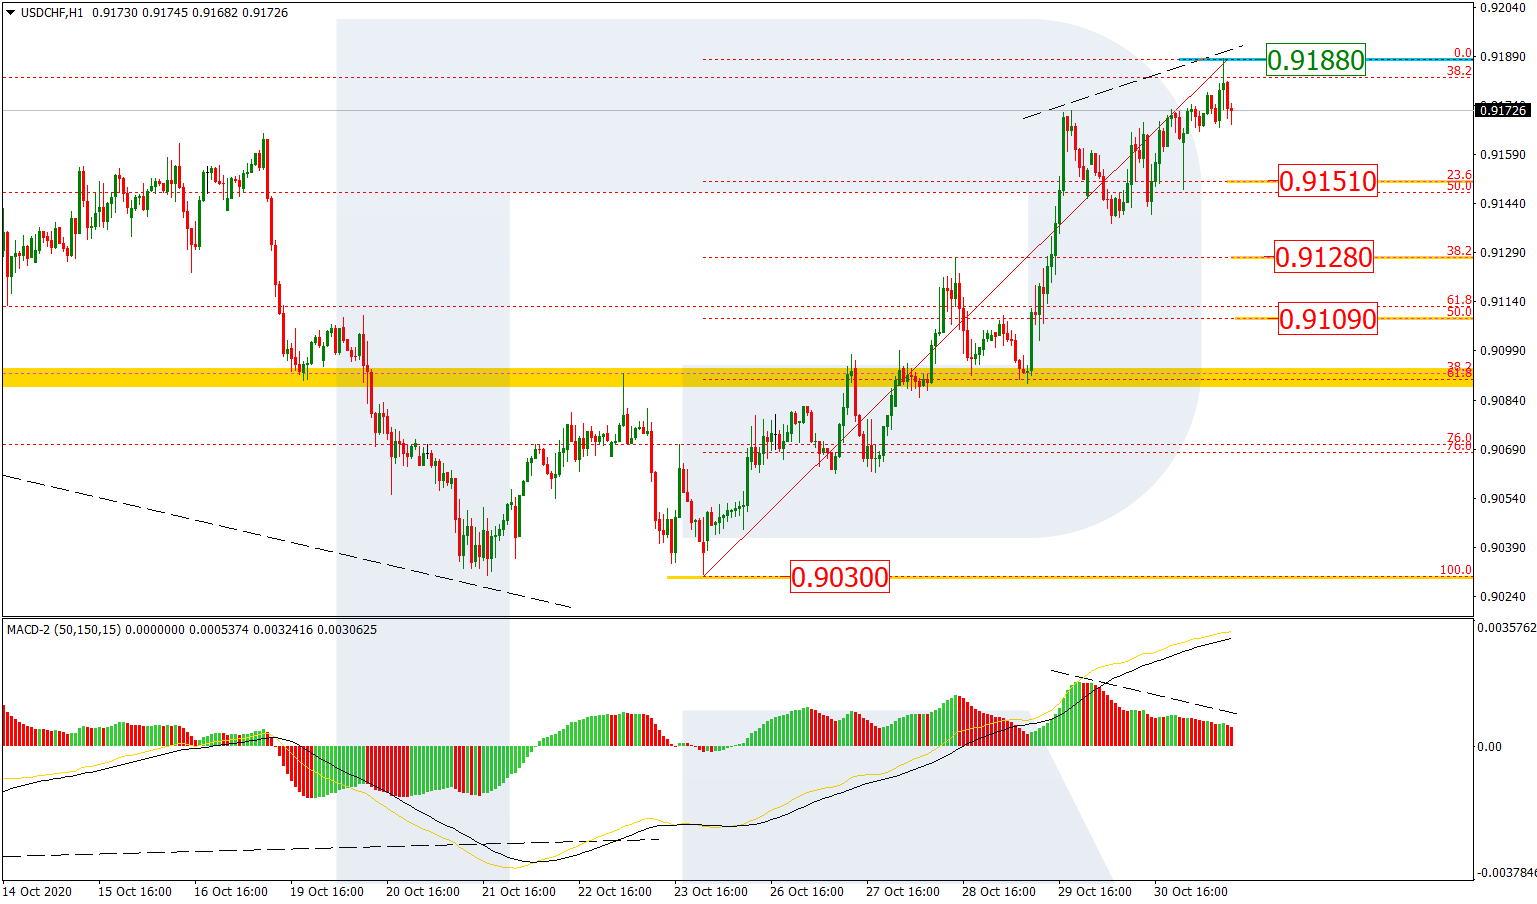
In the H1 chart, a local convergence on MACD made the pair start a new rising impulse, which has already reached 23.6% fibo. In the future, the asset may continue growing towards 38.2%, 50.0%, 61.8%, and 76.0% fibo at 0.9132, 0.9163, 0.9194, and 0.9232 respectively, as well as the high at 0.9296, to confirm further long-term uptrend.

USDCHF_H1

Article By RoboForex.com

Attention!
Forecasts presented in this section only reflect the author’s private opinion and should not be considered as guidance for trading. RoboForex LP bears no responsibility for trading results based on trading recommendations described in these analytical reviews.
Week in review: Here we go again…

By Lukman Otunuga, Research Analyst, ForexTime

The Stimulus drama in Congress is starting to feel like an annoying TV series that nobody really likes but keeps viewers hooked regardless. 

As markets entered the week on a positive note on Monday amid renewed optimism over US policymakers reaching an agreement before Election day, it just felt too good to be true. These suspicions were confirmed later in the week as Democrats and Republicans remained trapped in a stimulus limbo despite all the talk and deadlines! 

Moving away from US politics, the Pound was practically shivering as fears intensified over a no-deal Brexit. However, comments from EU’s chief negotiator Barnier mid-week saying that an agreement with the UK was within reach injected the Pound with a renewed sense of confidence.


Sterling has appreciated against every single G10 currency this week and at one point jumped over 250 pips versus the Dollar. With respect within reach, Sterling may extend gains in the week ahead.


Looking at earnings, Netflix shares fell mid-week after the company’s earnings missed analyst estimates and global net subscriber additions were below forecasts. However, revenues exceeded expectations by hitting $6.44 billion vs $6.38 billion projection. Tesla recorded a fifth quarter in a row of profit, making $8.7 billion in revenue in the three months to September, as deliveries rose 54%!

Taking a quick peek at the commodity space, Gold remains in the same old choppy range on the daily charts as investors remain on the side-lines ahead of the November 3rd U.S election.

Over the past three weeks, the metal has found comfort within a $50 range thanks to a variety of themes ranging from a softer Dollar, rising coronavirus cases across the globe, pre-election jitters and uncertainty over the US stimulus package.


Over the past few months, WTI Oil has been stuck around the sticky $40 level. 

There is growing suspicion that the commodity may be waiting until after the November 3rd U.S election to make a move either up or down. Until then, the commodity is likely to be driven by price action and attracted to technical levels. 


With the November 3rd U.S election around the corner, there could be more action across financial markets as presidential candidates Trump and Biden drive home their message to voters. 

On top of this, the ongoing stimulus drama in Congress may swing the risk pendulum between extremes as investors ponder on the likelihood of a deal before election day!

For a deeper discussion on the week ahead and key market theme, sign up to the upcoming week ahead webinar on Monday 26th October at 1 pm London time!

Disclaimer: The content in this article comprises personal opinions and should not be construed as containing personal and/or other investment advice and/or an offer of and/or solicitation for any transactions in financial instruments and/or a guarantee and/or prediction of future performance. ForexTime (FXTM), its affiliates, agents, directors, officers or employees do not guarantee the accuracy, validity, timeliness or completeness, of any information or data made available and assume no liability as to any loss arising from any investment based on the same.


Forex-Time-LogoArticle by ForexTime

ForexTime Ltd (FXTM) is an award winning international online forex broker regulated by CySEC 185/12 www.forextime.com

Ichimoku Cloud Analysis 23.10.2020 (BTCUSD, EURUSD, USDJPY)

Article By RoboForex.com

BTCUSD, “Bitcoin vs US Dollar”

BTCUSD is trading at 12935.00; the instrument is moving above Ichimoku Cloud, thus indicating an ascending tendency. As one can see, bulls haven’t been to fix above the resistance area at 13000.00 yet. The markets could indicate that the price may test the cloud’s upside border at 12805.00 and then resume moving upwards to reach 13885.00. Another signal in favor of further uptrend will be a rebound from the downside border of the Triangle pattern. However, the bullish scenario may no longer be valid if the price breaks the cloud’s downside border and fixes below 12225.00. In this case, the pair may continue falling towards 11605.00. To confirm further growth, the asset must break the pattern’s upside border and fix above 13340.00.

BTCUSD
Risk Warning: the result of previous trading operations do not guarantee the same results in the future

EURUSD, “Euro vs US Dollar”

EURUSD is trading at 1.1792; the instrument is moving below Ichimoku Cloud, thus indicating a descending tendency. The markets could indicate that the price may test the cloud’s downside border at 1.1810 and then resume moving downwards to reach 1.1705. Another signal in favor of further downtrend will be a rebound from the resistance level. However, the bearish scenario may be canceled if the price breaks the cloud’s upside border and fixes above 1.1865. In this case, the pair may continue growing towards 1.1955.

EURUSD
Risk Warning: the result of previous trading operations do not guarantee the same results in the future

USDJPY, “US Dollar vs Japanese Yen”

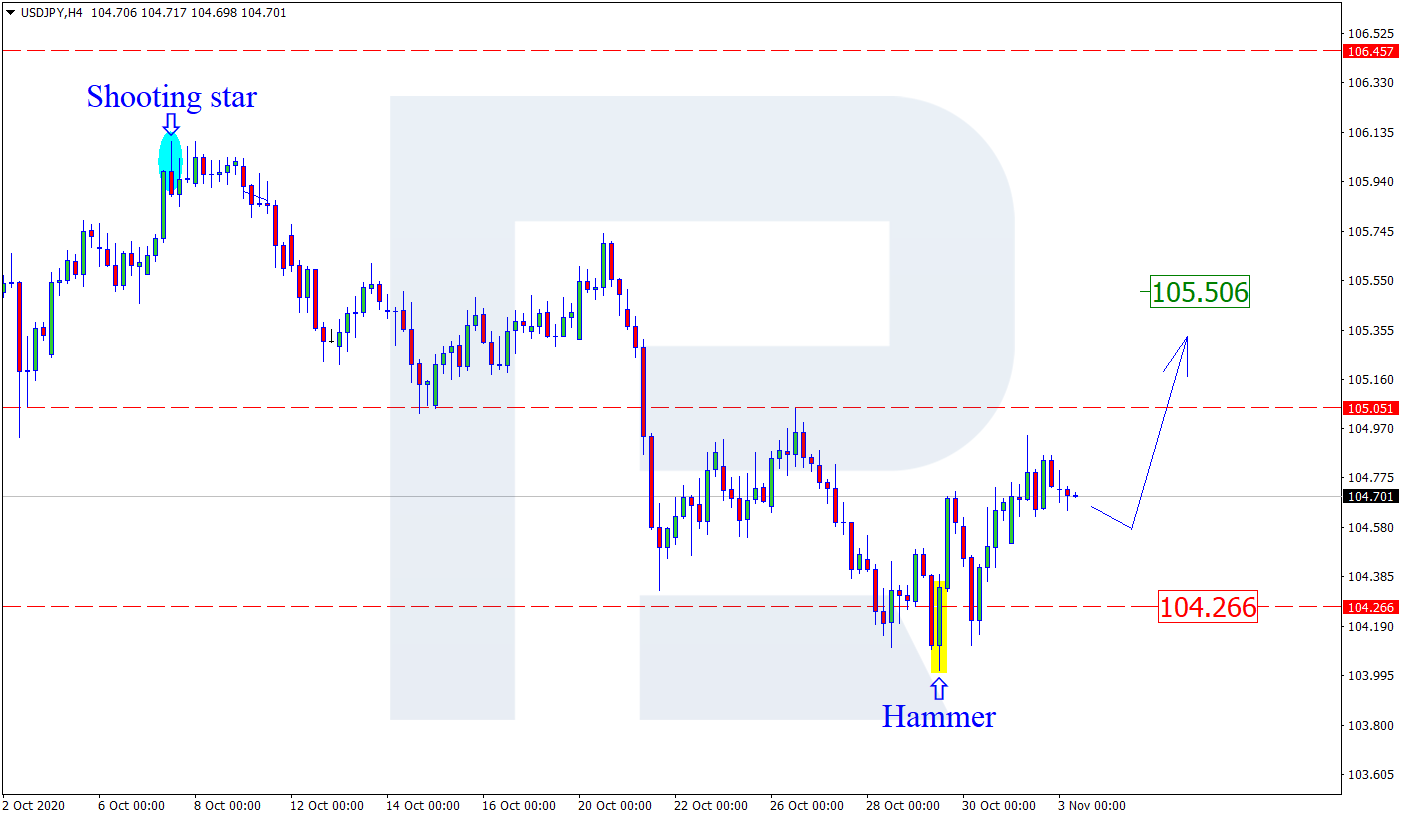
USDJPY is trading at 104.70; the instrument is moving below Ichimoku Cloud, thus indicating a descending tendency. The markets could indicate that the price may test Tenkan-Sen and Kijun-Sen at 104.85 and then resume moving downwards to reach 104.05. Another signal in favor of further downtrend will be a rebound from the descending channel’s upside border. However, the bearish scenario may no longer be valid if the price breaks the cloud’s upside border and fixes above 105.20. In this case, the pair may continue growing towards 106.15. To confirm further decline, the asset must break the rising channel’s downside border and fix below 104.50.

USDJPY

Article By RoboForex.com

Attention!
Forecasts presented in this section only reflect the author’s private opinion and should not be considered as guidance for trading. RoboForex LP bears no responsibility for trading results based on trading recommendations described in these analytical reviews.
The Analytical Overview of the Main Currency Pairs on 2020.10.23

by JustForex

The EUR/USD currency pair

Technical indicators of the currency pair:
  • Prev Open: 1.18582
  • Open: 1.18168
  • % chg. over the last day: -0.38
  • Day’s range: 1.17868 – 1.18311
  • 52 wk range: 1.0637 – 1.2012

The EUR/USD currency pair has moved away from monthly highs. At the moment, quotes are consolidating. Local support and resistance levels are 1.1790 and 1.1835, respectively. US House Speaker Nancy Pelosi announced progress in talks with the White House on a new stimulus package to combat the consequences of the coronavirus pandemic. Today, investors will assess data on economic activity in the Eurozone and the US. Positions should be opened from key levels.

The news feed on 2020.10.23:
  • – A number of indicators on economic activity in Germany and the Eurozone at 10:30 (GMT+3:00) and 11:00 (GMT+3:00), respectively;
  • – Statistics on economic activity in the US at 16:45 (GMT+3:00).
EUR/USD

Indicators do not give accurate signals: the price has crossed the 50 MA and 100 MA.

The MACD histogram is in the negative zone, which indicates the bearish sentiment.

Stochastic Oscillator is in the neutral zone, the %K line is above the %D line, which gives a signal to buy EUR/USD.

Trading recommendations
  • Support levels: 1.1790, 1.1760, 1.1730
  • Resistance levels: 1.1835, 1.1860, 1.1880

If the price fixes above 1.1835, further growth of EUR/USD quotes is expected. The movement is tending to 1.1870-1.1900.

An alternative could be a decline in the EUR/USD currency pair to 1.1760-1.1730.

The GBP/USD currency pair

Technical indicators of the currency pair:
  • Prev Open: 1.31538
  • Open: 1.30749
  • % chg. over the last day: -0.48
  • Day’s range: 1.30507 – 1.30981
  • 52 wk range: 1.1409 – 1.3516

GBP/USD quotes have been declining after a sharp growth the day before. Investors have started partially fixing positions. The British pound has set new local lows. At the moment, the GBP/USD currency pair is consolidating in the range of 1.3050-1.3110. Today, financial market participants will assess statistics on economic activity in the UK. Positions should be opened from key levels.

At 11:30 (GMT+3:00), data on economic activity in the UK will be published.

GBP/USD

Indicators do not give accurate signals: the price has fixed between 50 MA and 100 MA.

The MACD histogram is near the 0 mark. There are no signals at the moment.

Stochastic Oscillator is in the neutral zone, the %K line is above the %D line, which indicates the bullish sentiment.

Trading recommendations
  • Support levels: 1.3050, 1.3015, 1.2975
  • Resistance levels: 1.3110, 1.3150, 1.3175

If the price fixes above 1.3110, further growth of the GBP/USD currency pair is expected. The movement is tending to 1.3160-1.3200.

An alternative could be a drop in GBP/USD quotes to the round level of 1.3000.

The USD/CAD currency pair

Technical indicators of the currency pair:
  • Prev Open: 1.31387
  • Open: 1.31319
  • % chg. over the last day: -0.09
  • Day’s range: 1.31163 – 1.31579
  • 52 wk range: 1.2949 – 1.4669

The loonie is consolidating. The technical pattern is ambiguous. At the moment, the local support and resistance levels are 1.3115 and 1.3155, respectively. The demand for greenback is still quite weak. The USD/CAD currency pair has the potential for further decline. We recommend paying attention to the dynamics of “black gold” prices. Positions should be opened from key levels.

The news feed on Canada’s economy is calm.

USD/CAD

Indicators do not give accurate signals: the price has crossed the 50 MA and 100 MA.

The MACD histogram is near the 0 mark. There are no signals at the moment.

Stochastic Oscillator is in the neutral zone, the %K line is below the %D line, which gives a signal to sell USD/CAD.

Trading recommendations
  • Support levels: 1.3115, 1.3085, 1.3050
  • Resistance levels: 1.3155, 1.3175, 1.3205

If the price fixes below 1.3115, a further drop in USD/CAD quotes is expected. The movement is tending to 1.3085-1.3050.

An alternative could be the growth of the USD/CAD currency pair to the round level of 1.3200.

The USD/JPY currency pair

Technical indicators of the currency pair:
  • Prev Open: 104.533
  • Open: 104.863
  • % chg. over the last day: +0.25
  • Day’s range: 104.552 – 104.936
  • 52 wk range: 101.19 – 112.41

The USD/JPY currency pair has become stable after a sharp drop. There is no defined trend. At the moment, a trading instrument is testing local supply and demand zones: 104.40-104.55 and 104.90-105.05, respectively. USD/JPY quotes have the potential for further decline. We recommend paying attention to the dynamics of US government bonds yield. Positions should be opened from key levels.

In September, Japan’s national core consumer price index slowed down by 0.3% (YoY). Experts expected the indicator to fall by 0.4%.

USD/JPY

Indicators do not give accurate signals: the price has crossed the 50 MA.

The MACD histogram has started declining again, which indicates the bearish sentiment.

Stochastic Oscillator is in the neutral zone, the %K line has crossed the %D line. There are no signals at the moment.

Trading recommendations
  • Support levels: 104.55, 104.40, 104.00
  • Resistance levels: 104.90, 105.05, 105.25

If the price fixes below 104.55, a further drop in USD/JPY quotes is expected. The movement is tending to the round level of 104.00.

An alternative could be the growth of the USD/JPY currency pair to 105.20-105.40.

by JustForex


This article reflects a personal opinion and should not be interpreted as an investment advice, and/or offer, and/or a persistent request for carrying out financial transactions, and/or a guarantee, and/or a forecast of future events.

The Dollar Index Has Become Stable

by JustForex

The greenback has become stable against a basket of world currencies. The dollar index (#DX) is consolidating in the range of 92.50-93.00. The demand for US currency is still quite low before the US presidential elections. During yesterday’s debate, Donald Trump and Democratic candidate Joe Biden presented opposing views on the COVID-19 epidemic. At the moment, the number of people infected in the world has exceeded 41.7 million. Politicians also discussed a range of topics, including the economy, race issues, climate change, health and immigration.

US House Speaker Nancy Pelosi announced progress in talks with the White House on a new stimulus package to combat the consequences of the coronavirus pandemic. We also recommend following up-to-date information concerning Brexit. Today, financial market participants will assess data on economic activity in the Eurozone and the US.

The “black gold” prices are consolidating. At the moment, futures for the WTI crude oil are testing the $40.85 mark per barrel. We recommend paying attention to the US Baker Hughes oil rig count at 20:00 (GMT+3:00).

Market indicators

Yesterday, there was the bullish sentiment in the US stock market: #SPY (+0.55%), #DIA (+0.60%), #QQQ (0.00%).

The 10-year US government bonds yield has been growing again. At the moment, the indicator is at the level of 0.85-0.86%.

The news feed for 2020.10.23:
  • – A number of indicators on economic activity in Germany and the Eurozone at 10:30 (GMT+3:00) and 11:00 (GMT+3:00), respectively;
  • – Statistics on economic activity in the US at 16:45 (GMT+3:00).

by JustForex


This article reflects a personal opinion and should not be interpreted as an investment advice, and/or offer, and/or a persistent request for carrying out financial transactions, and/or a guarantee, and/or a forecast of future events.

EURUSD headed to 1.2000 before the ECB meeting next week?

By Admiral Markets

Economic Events October 23, 2020 Source: Economic Events October 23, 2020 – Admiral Markets’ Forex Calendar

With upcoming selling pressure in the US-Dollar, EURUSD is pushing significantly back above 1.1800, currently eyeing the region around 1.1900.

There is a reason we have pointed out the selling pressure in the US-Dollar and not Euro strength:

  • We are very sceptical, in terms of the European currency
  • We see intensifying signs of very dovish rhetoric from the ECB next week on Thursday
  • The ECB is likely to significantly weaken the Euro

These signs can, for example, be seen when looking at the Invesco Euro Currency Shares ETF which saw its 2nd biggest capital weekly outflow last week amongst all Eurozone-related ETF’s, most likely in anticipation of a dovish ECB next week.

But with further US-Dollar weakness to be expected once Democrats and Republicans finally reach a deal on an economic relief package, financed with freshly printed US-Dollar from the US central bank FED, the question seems to be: how dovish can the ECB be to counter the ongoing dovishness of the FED and USD weakness?

We feel that chances are high that we’ll see some heavier volatility in the days to come, especially into next week’s weekly close (Thursday and Friday), but that traders should remain careful in regards to short-term dips in the EURUSD.

The fact that the currency pair hasn’t seen another run down to the 1.1600 area and lower indicates substantial buying of the Euro/selling of the USD taking place, leaving any short-term dip to be short-lived, with the currency pair likely to see an aggressive attempt to capture 1.2000 into the monthly close, especially if a break above 1.1900 is seen:

Admiral Markets MT5 with MT5SE Add-on EURUSD Daily chartSource: Admiral Markets MT5 with MT5SE Add-on EURUSD Daily chart (between July 17, 2019, to October 22, 2020). Accessed: October 22, 2020, at 10:00 PM GMT. Please note: Past performance is not a reliable indicator of future results, or future performance.

In 2015, the value of the EURUSD fell by 10.2%, in 2016, it fell by 3.2%, in 2017, it increased by 13.92%, in 2018, it fell by 4.4%, and in 2019, it fell by 2.2%, meaning that in five years, it was down by 7.3%.

Discover the world’s #1 multi-asset platform

Admiral Markets offers professional traders the ability to trade with MetaTrader 5, allowing you to experience trading at a significantly higher, more rewarding level than with MetaTrader 4. Experience benefits such as the addition of the Market Heat Map, so you can compare various currency pairs to see which ones might be lucrative investments, access real-time trading data, and so much more. Click the banner below to start your FREE download of MT5!

Trade With MetaTrader 5

Disclaimer: The given data provides additional information regarding all analysis, estimates, prognosis, forecasts or other similar assessments or information (hereinafter “Analysis”) published on the website of Admiral Markets. Before making any investment decisions please pay close attention to the following:

  1. This is a marketing communication. The analysis is published for informative purposes only and is in no way to be construed as investment advice or recommendation. It has not been prepared in accordance with legal requirements designed to promote the independence of investment research, and that it is not subject to any prohibition on dealing ahead of the dissemination of investment research.
  2. Any investment decision is made by each client alone whereas Admiral Markets shall not be responsible for any loss or damage arising from any such decision, whether or not based on the Analysis.
  3. Each of the Analysis is prepared by an independent analyst (Jens Klatt, Professional Trader and Analyst, hereinafter “Author”) based on the Author’s personal estimations.
  4. To ensure that the interests of the clients would be protected and objectivity of the Analysis would not be damaged Admiral Markets has established relevant internal procedures for prevention and management of conflicts of interest.
  5. Whilst every reasonable effort is taken to ensure that all sources of the Analysis are reliable and that all information is presented, as much as possible, in an understandable, timely, precise and complete manner, Admiral Markets does not guarantee the accuracy or completeness of any information contained within the Analysis. The presented figures that refer to any past performance is not a reliable indicator of future results.
  6. The contents of the Analysis should not be construed as an express or implied promise, guarantee or implication by Admiral Markets that the client shall profit from the strategies therein or that losses in connection therewith may or shall be limited.
  7. Any kind of previous or modelled performance of financial instruments indicated within the Publication should not be construed as an express or implied promise, guarantee or implication by Admiral Markets for any future performance. The value of the financial instrument may both increase and decrease and the preservation of the asset value is not guaranteed.
  8. The projections included in the Analysis may be subject to additional fees, taxes or other charges, depending on the subject of the Publication. The price list applicable to the services provided by Admiral Markets is publicly available from the website of Admiral Markets.
  9. Leveraged products (including contracts for difference) are speculative in nature and may result in losses or profit. Before you start trading, you should make sure that you understand all the risks.

By Admiral Markets