
Article By RoboForex.com
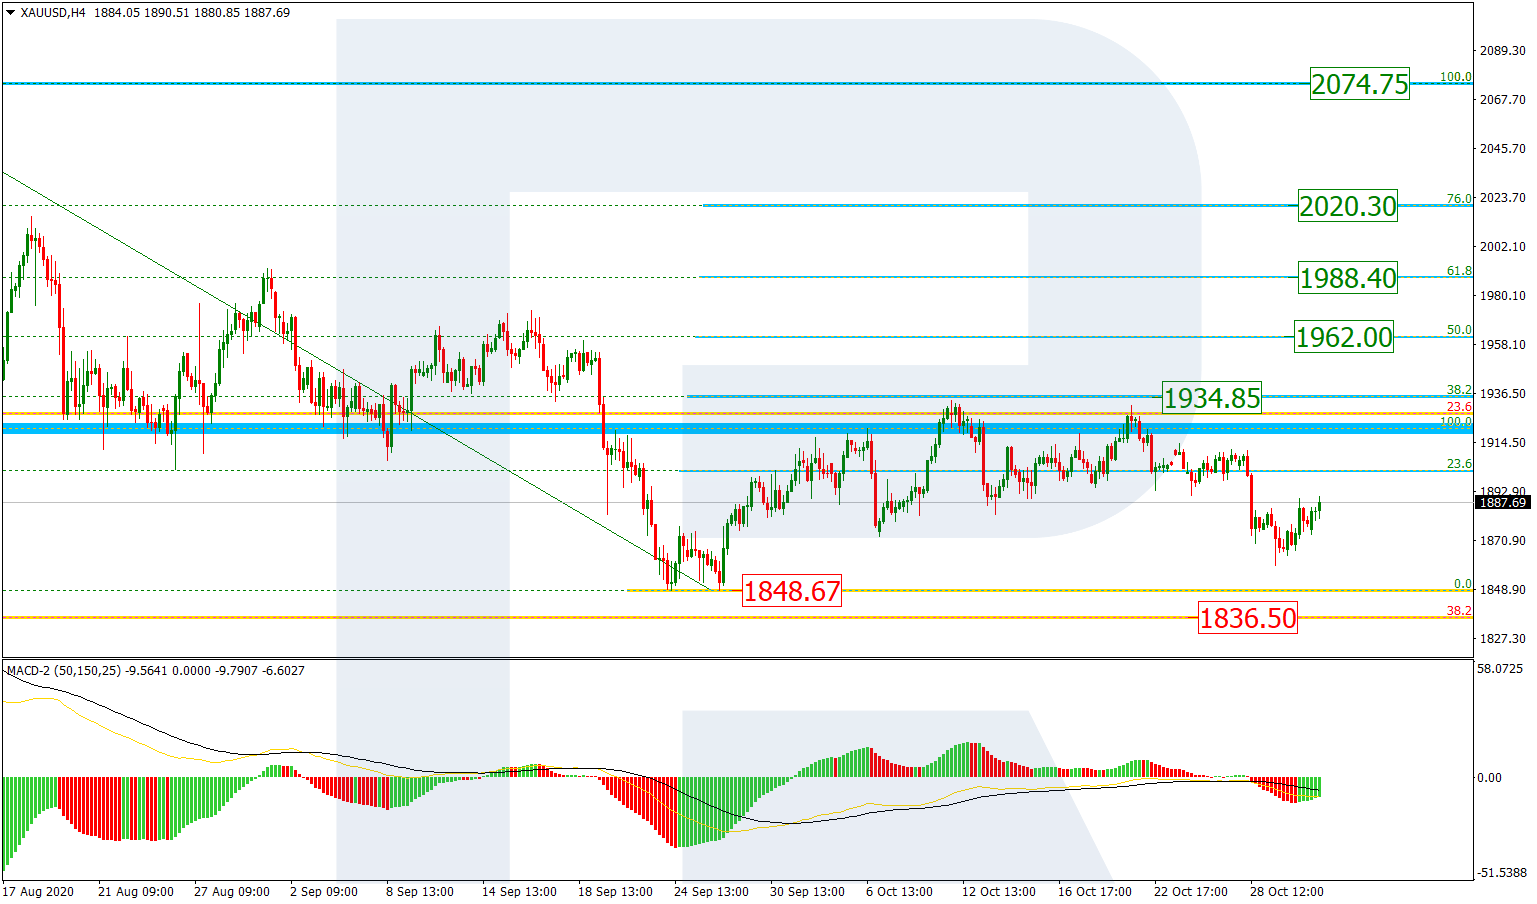
XAUUSD, “Gold vs US Dollar”
As we can see in the H4 chart, the correctional downtrend has failed to break the low at 1848,67 and reach the mid-term 38.2% fibo at 1836.50. Such a failure may indicate that XAUUSD is intending to reverse the current tendency in favor of a new uptrend. If this proves to be true, the next rising impulse may reach 38.2% at 1934.85. The next upside targets may be 50.0%, 61.8%, and 76.0% fibo at 1962.00, 1988.40, 2020.30 respectively, as well as the all-time high at 2074.75.

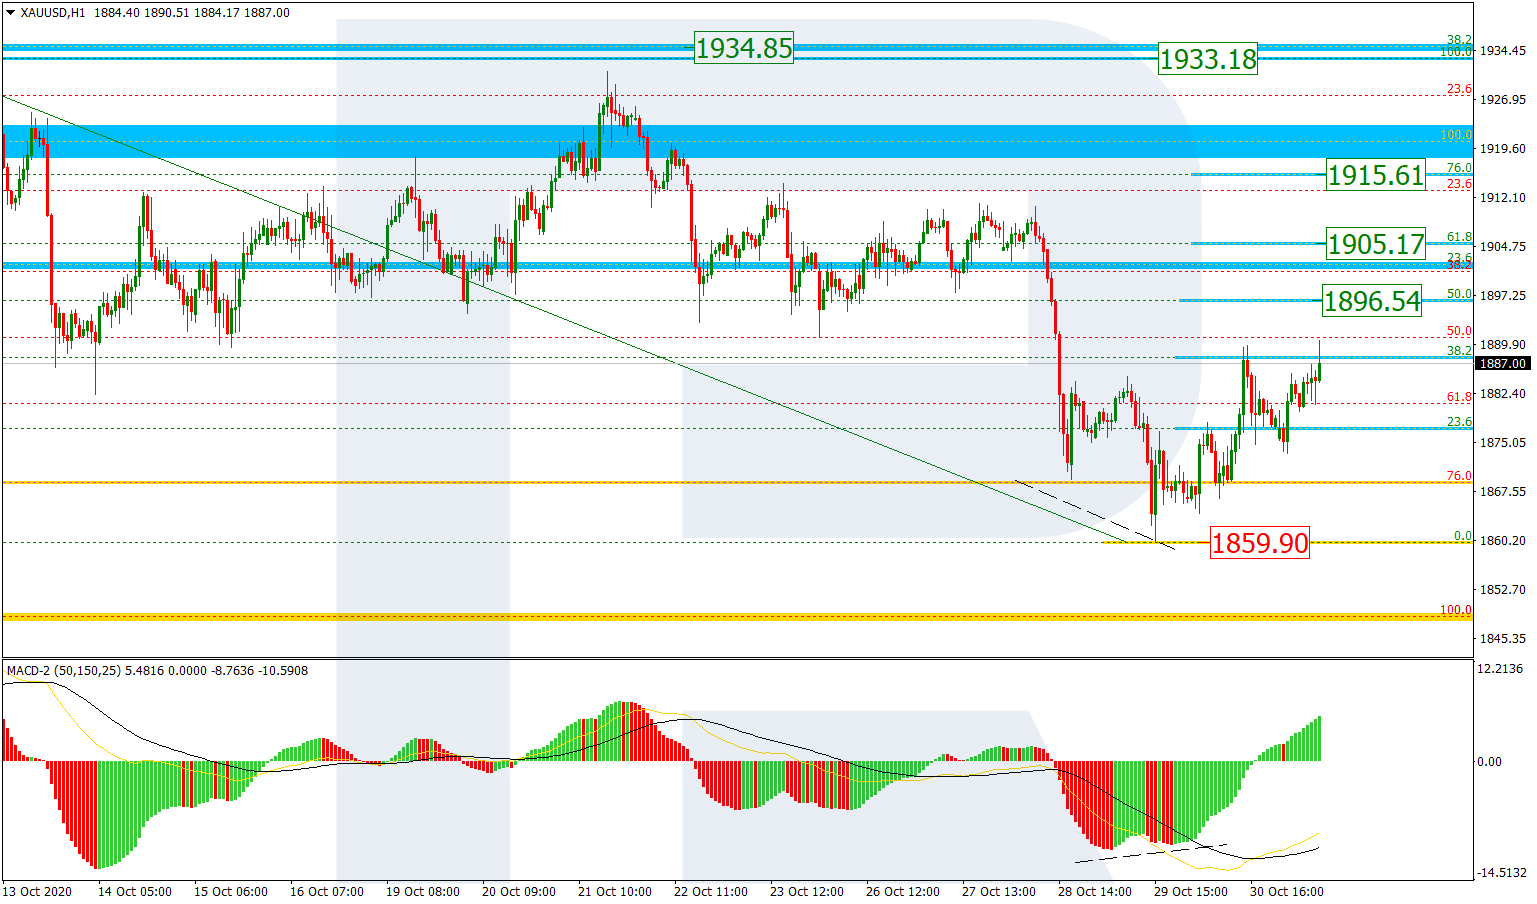
The H1 chart shows the start of a new growth after convergence on MACD. By now, the asset has tested 38.2% fibo twice, thus implying a possibility of further growth. The next upside targets may be 50.0%, 61.8%, and 76.0% fibo at 1896.54, 1905.17, and 1915.61 respectively, as well as the high at 1933.18. The support is the low at 1859.90.
Free Reports:
 Get our Weekly Commitment of Traders Reports - See where the biggest traders (Hedge Funds and Commercial Hedgers) are positioned in the futures markets on a weekly basis.
 Download Our Metatrader 4 Indicators – Put Our Free MetaTrader 4 Custom Indicators on your charts when you join our Weekly Newsletter
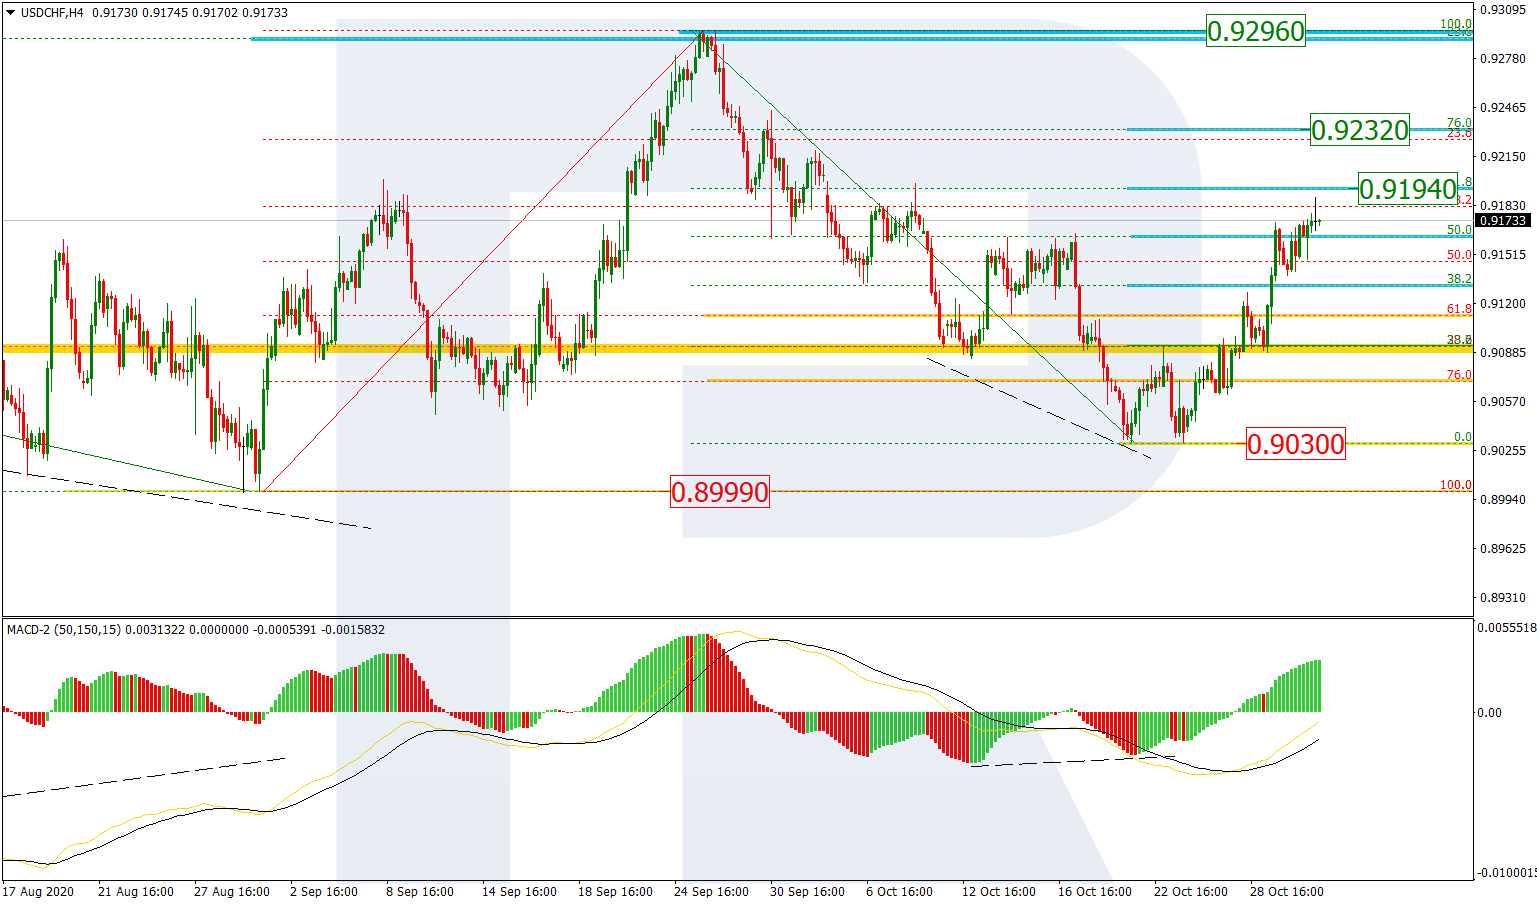
USDCHF, “US Dollar vs Swiss Franc”
As we can see in the H4 chart, after the descending wave stopped between the low at 0.8999 and 76.0% fibo, and was followed by a convergence on MACD, which made USDCHF reverse. A new rising wave has broken 50.0% fibo and may continue towards 61.8% and 76.0% fibo at 0.9194 and 0.9232 respectively, as well as the high at 0.9296. The support is the low at 0.9030.
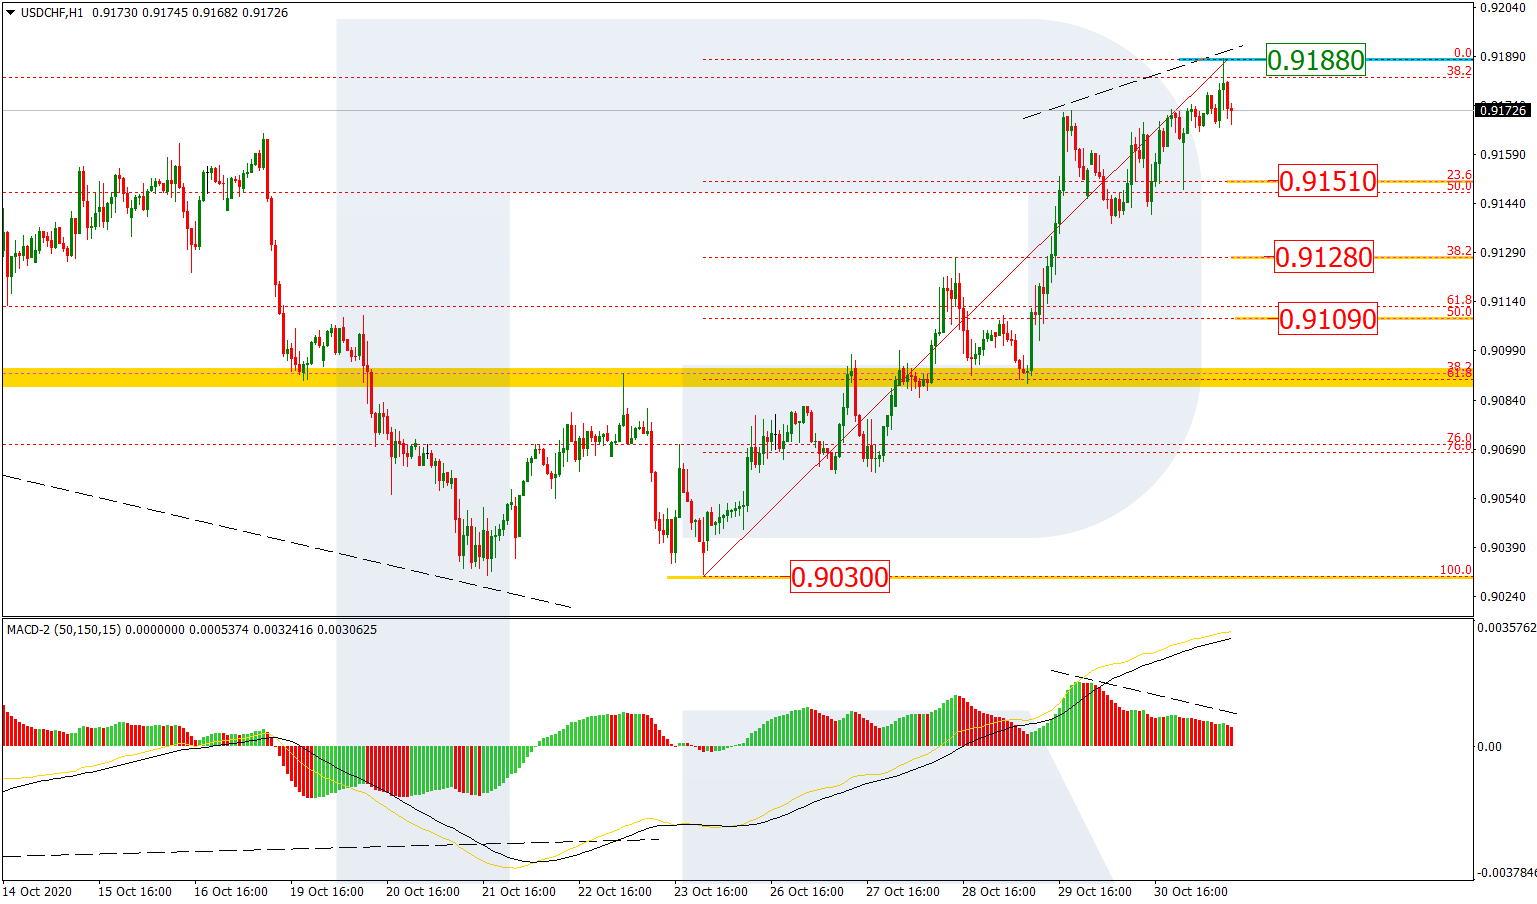
In the H1 chart, there is a divergence on MACD, which may indicate a possible pullback. The targets of this pullback may be 23.6%, 38.2%, and 50.0% fibo at 0.9151, 0.9128, and 0.9109 respectively. A breakout of the high at 0.9188 will be a signal in favor of further growth.
Article By RoboForex.com
Attention!
Forecasts presented in this section only reflect the author’s private opinion and should not be considered as guidance for trading. RoboForex LP bears no responsibility for trading results based on trading recommendations described in these analytical reviews.

- The Bank of Canada kept its interest rate unchanged. Platinum prices reached a three‑week high Jul 16, 2026
- Stock indices rose after the release of US inflation data. China’s GDP slowed sharply Jul 15, 2026
- GBP/USD Awaits Political News: What Will Happen Next Jul 15, 2026
- USD/JPY Holds at Highs: Pressure Lingers on Yen Jul 14, 2026
- Oil prices jumped 4% amid a new wave of escalation between the US and Iran Jul 13, 2026
- EUR/USD: US Inflation Will Determine Everything Jul 13, 2026
- COT Metals Charts: Weekly Speculator Bets see small gains for Silver & Gold Jul 12, 2026
- COT Bonds Charts: Speculator Bets led by SOFR 3-Months & 2-Year Bonds Jul 12, 2026
- COT Energy Charts: Weekly Speculator Changes led by Brent Oil Jul 12, 2026
- COT Soft Commodities Charts: Weekly Speculator Changes led by Sugar, Corn & Soybeans Jul 12, 2026