Archive for Forex and Currency News – Page 34

EUR/USD Stabilises Amid Fed Speculation and Absence of Major Economic Data

By RoboForex Analytical Department

The EUR/USD pair has found some stability at around 1.0921 this Friday, following a week marked by high volatility. Market participants have been adjusting their positions in response to speculations concerning the US economy’s potential rapid recession and subsequent expectations about the Federal Reserve’s response.

The broader market sentiment has increasingly leaned towards anticipating a significant rate cut by the Fed in September, possibly by 50 basis points. However, the validity of these expectations remains to be seen as the situation evolves.

Austan Goolsbee, President of the Federal Reserve Bank of Chicago, recently emphasised that the Federal Reserve’s mandate is not to respond to stock market fluctuations but to focus on its dual objectives of maximising employment and achieving price stability. He also reiterated that the Fed has set specific economic criteria to justify a rate reduction. Goolsbee’s remarks seem to have calmed some of the more erratic market movements.

With no significant economic data released this week, traders have been left to navigate the market based on speculative movements and minor indicators.

Technical analysis of EUR/USD

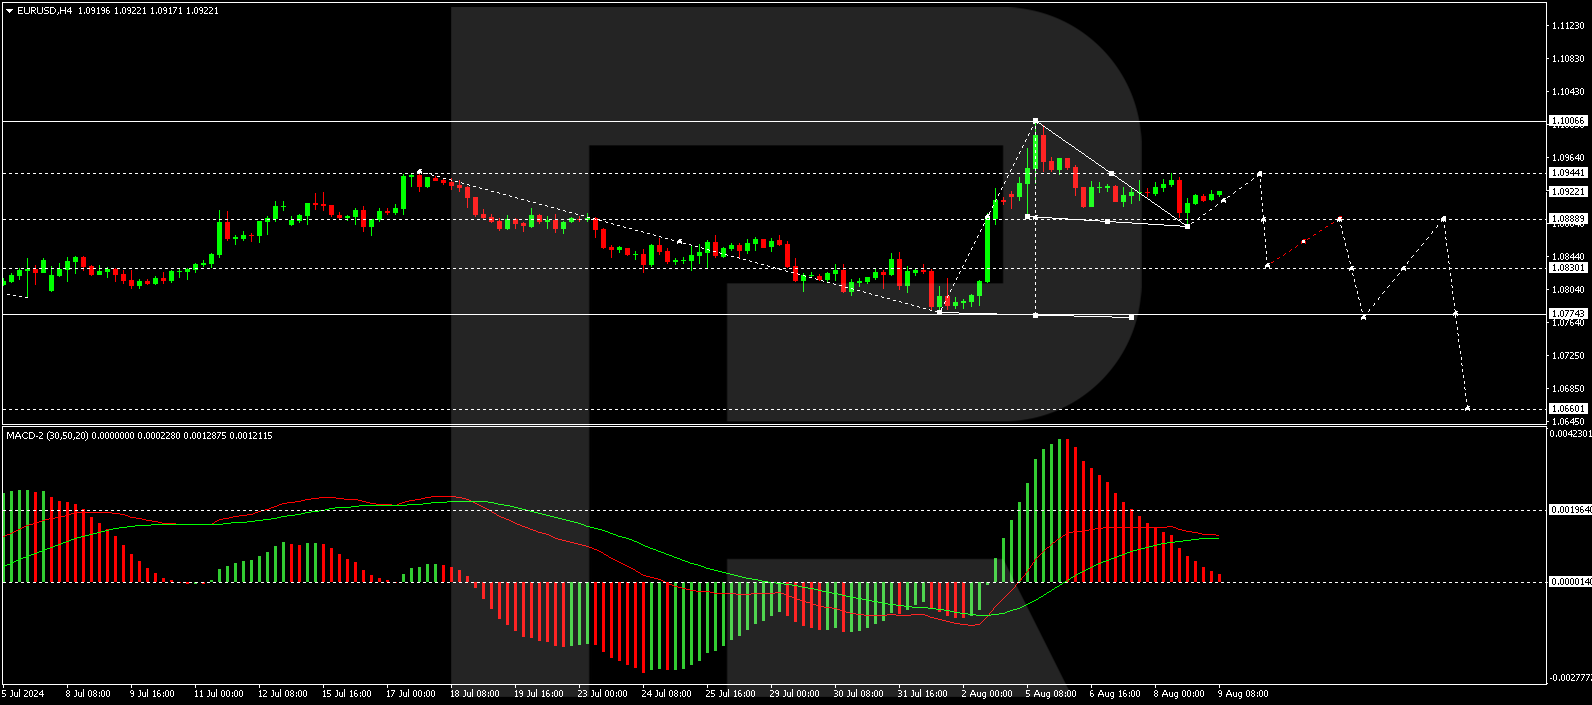
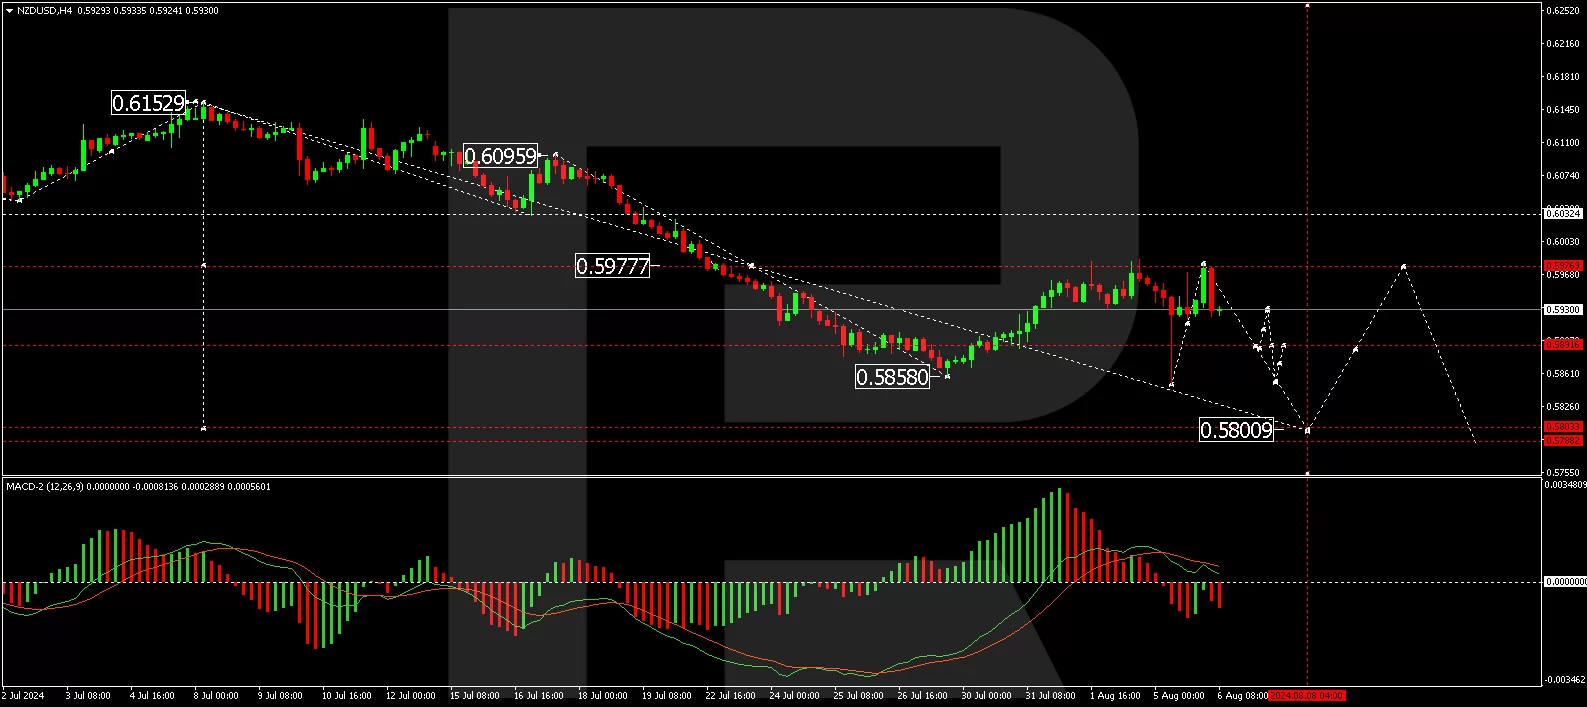
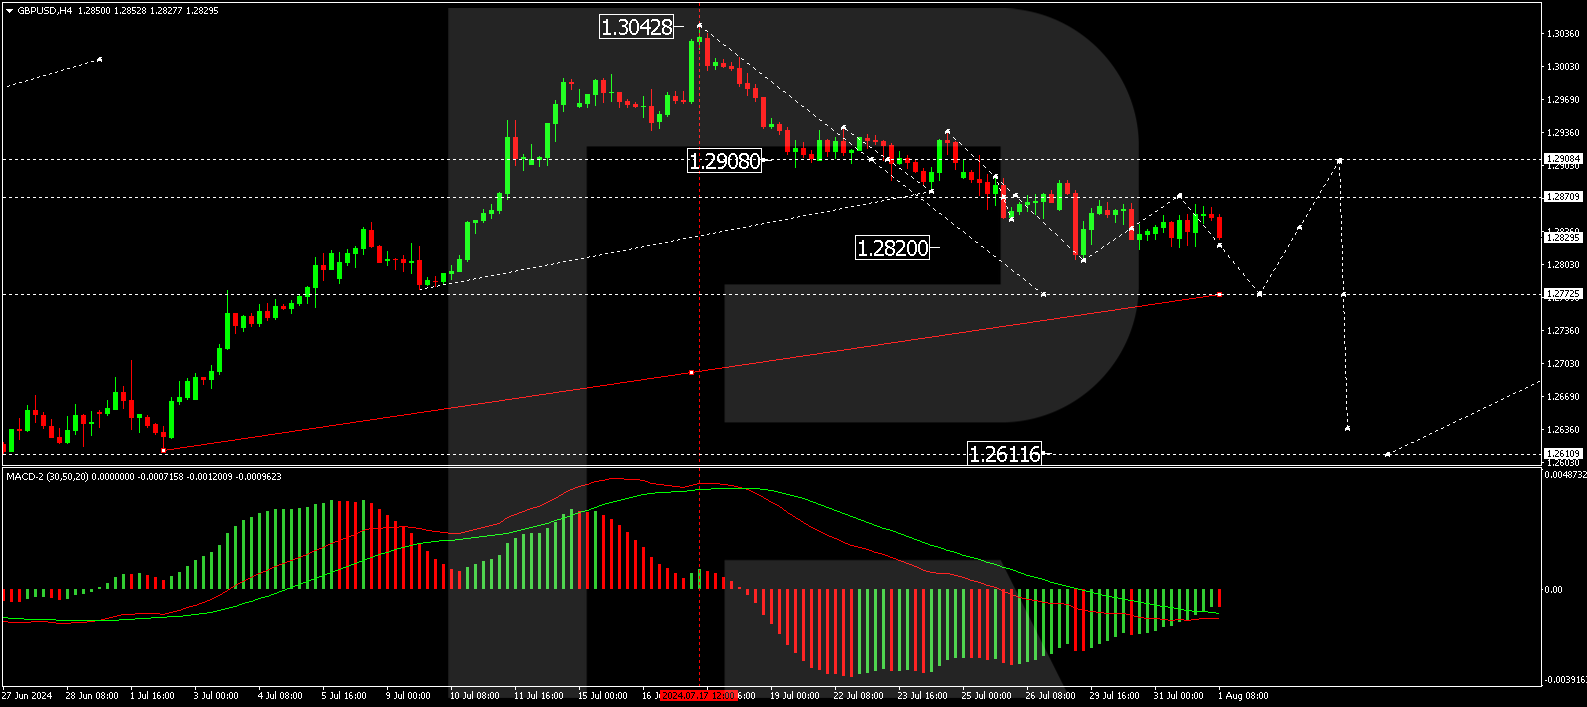
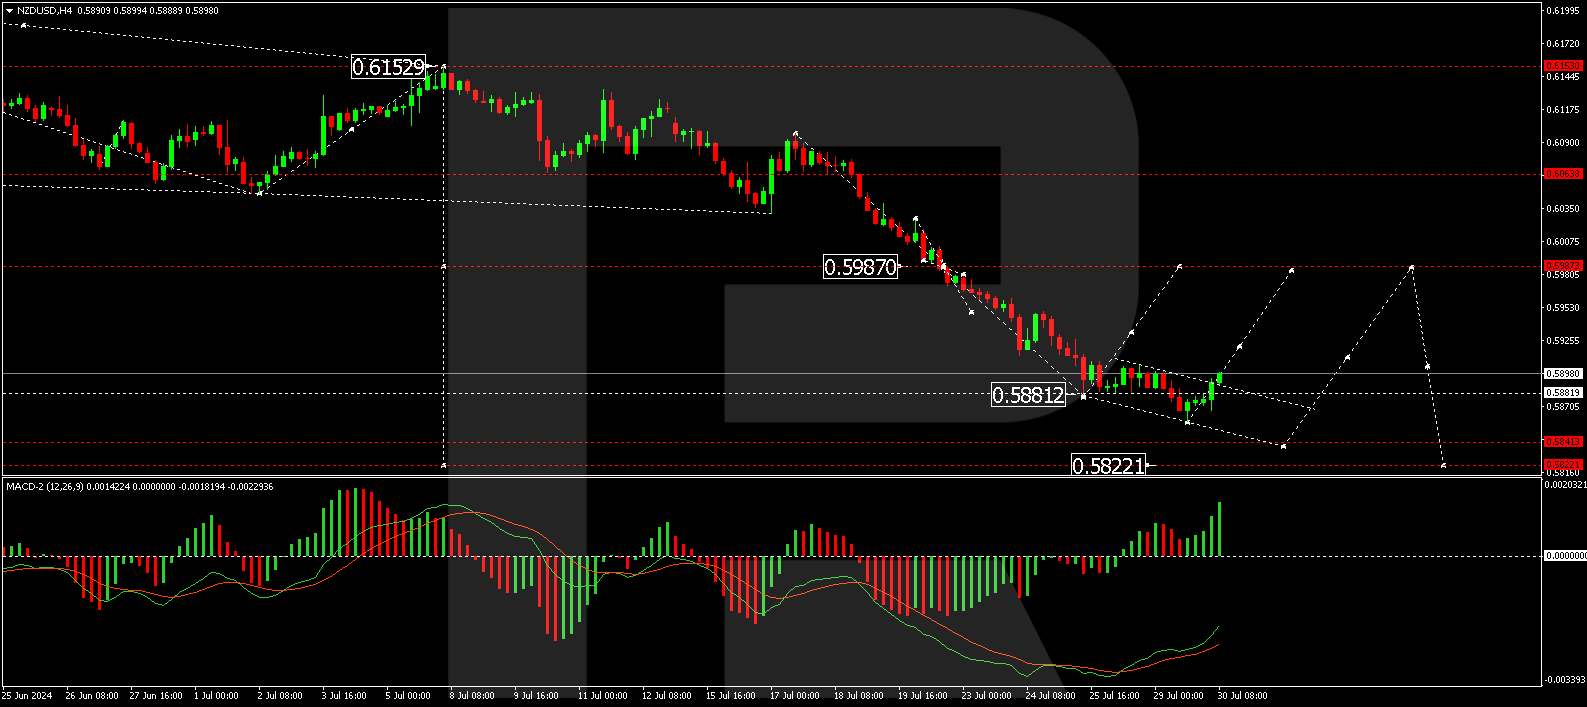
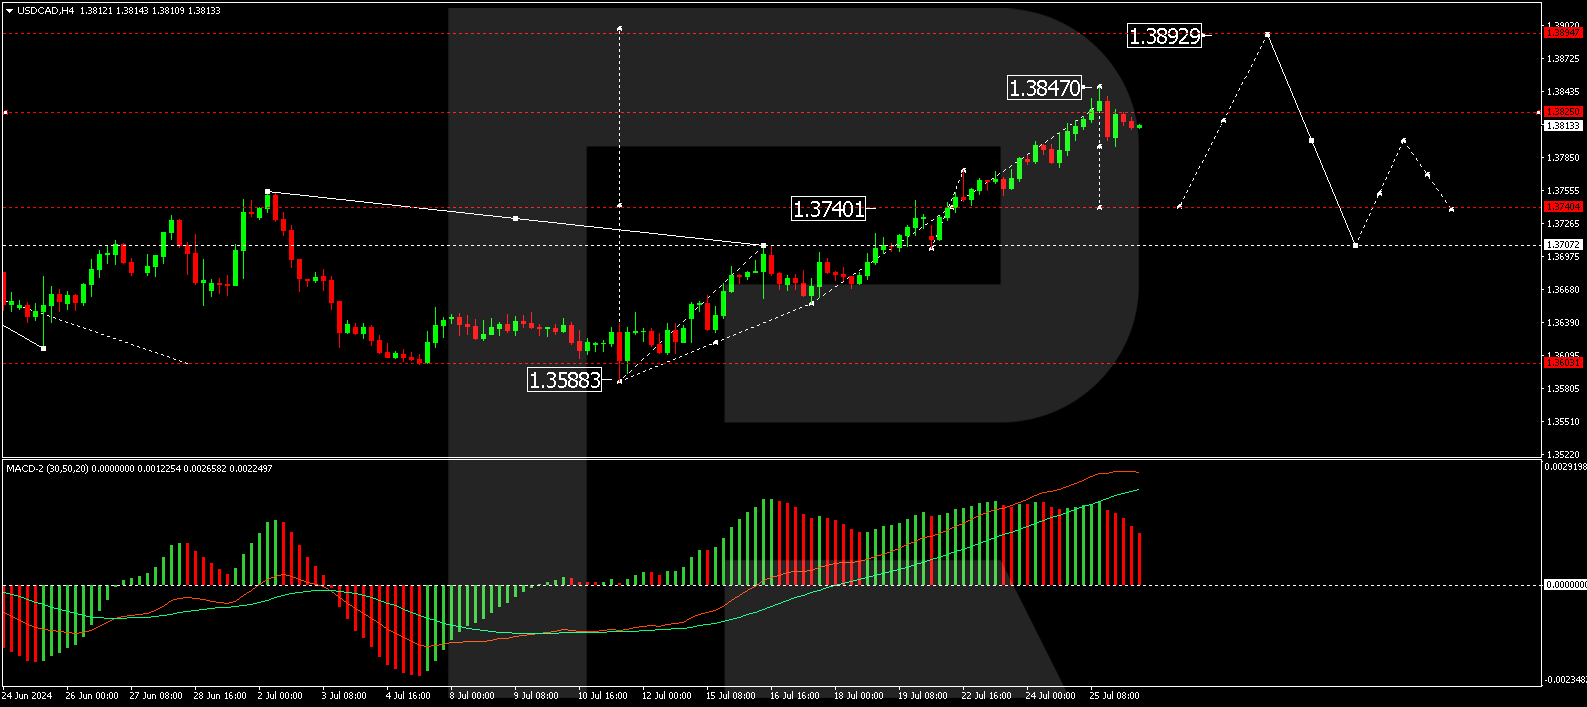
The H4 EUR/USD chart shows that the pair has completed an initial downward movement targeting the 1.0880 level, followed by a corrective phase towards 1.0944. Should this correction complete, a further decline to 1.0888 is anticipated. Breaking below this level could extend the downward trajectory towards 1.0830. The bearish outlook is supported by the MACD indicator, whose signal line is positioned above zero but trending downwards, indicating a potential continuation of the decline.

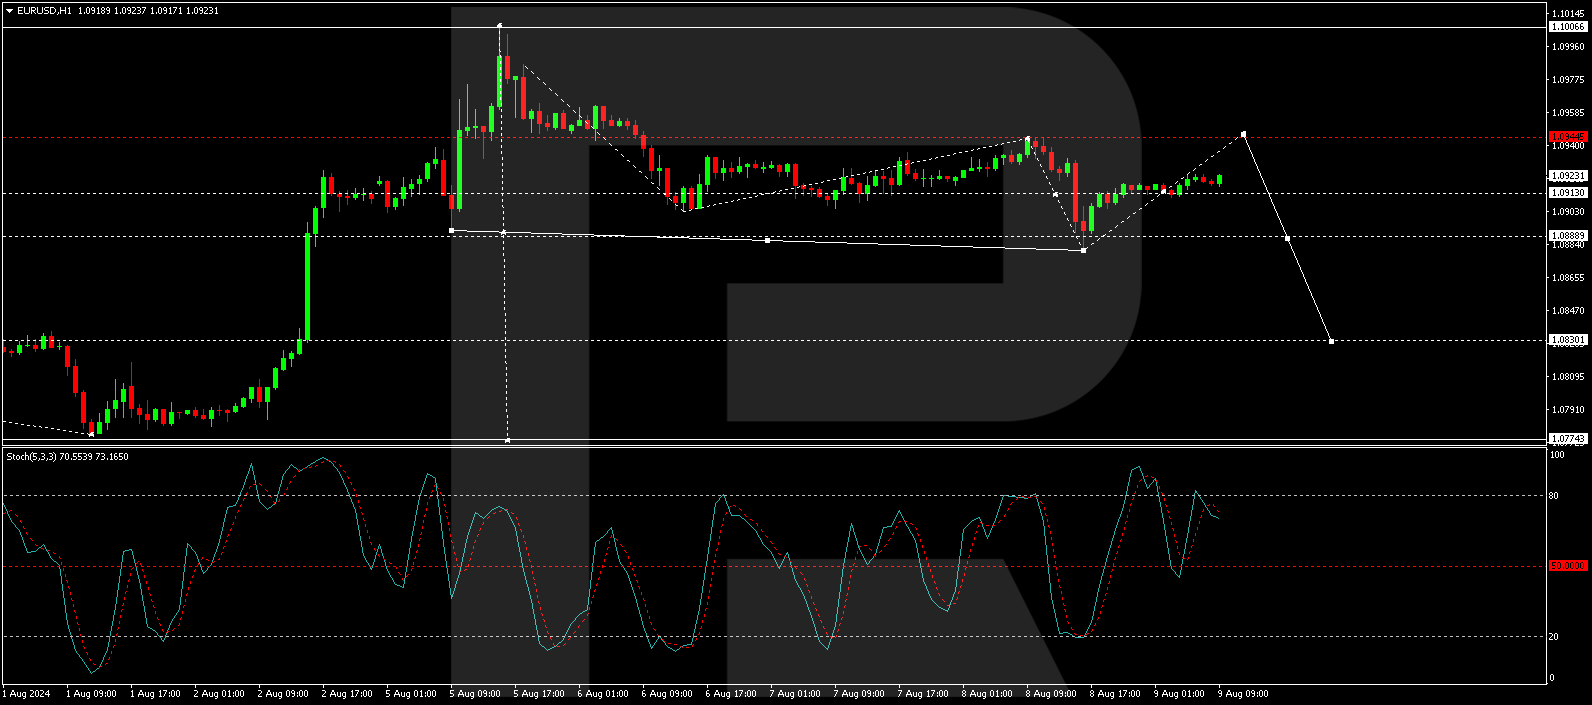
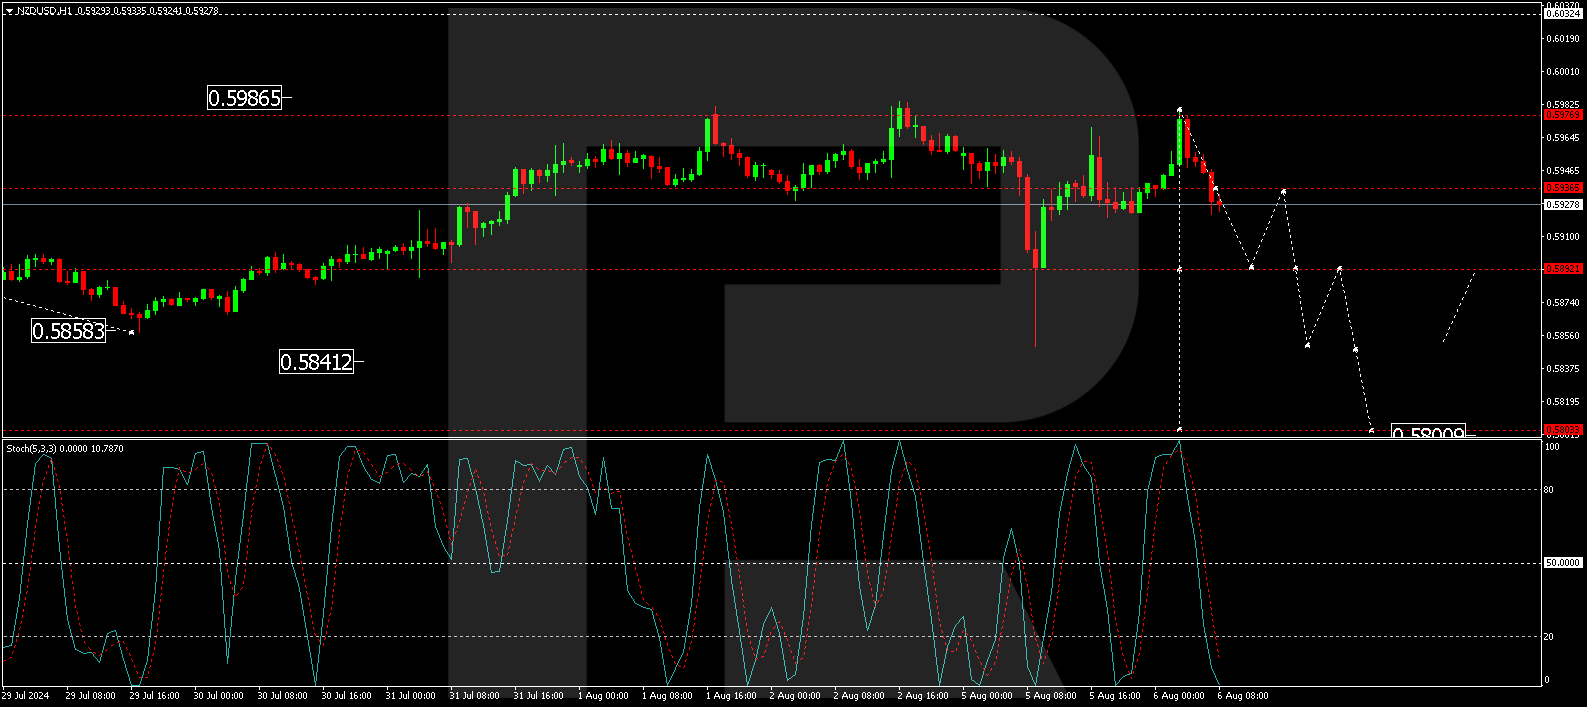
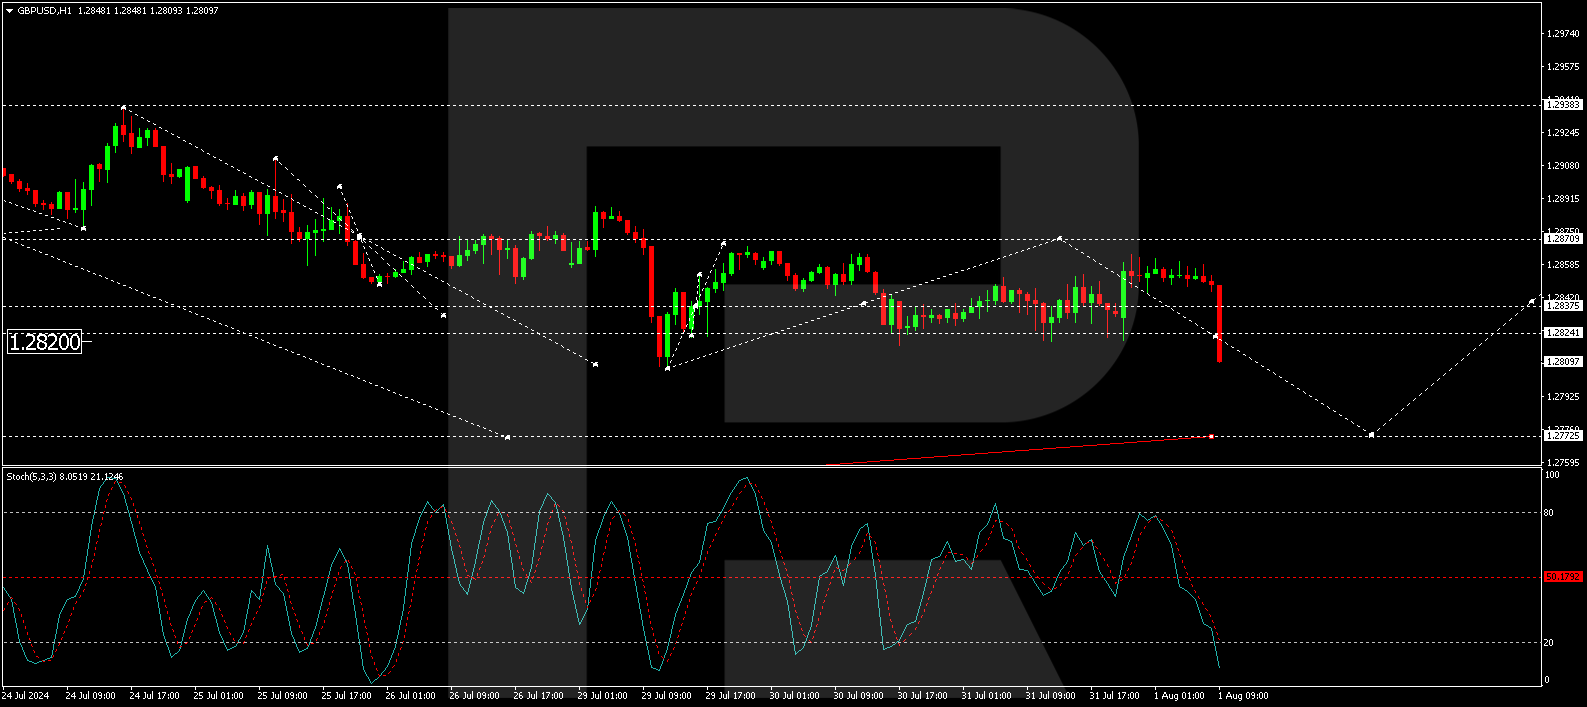
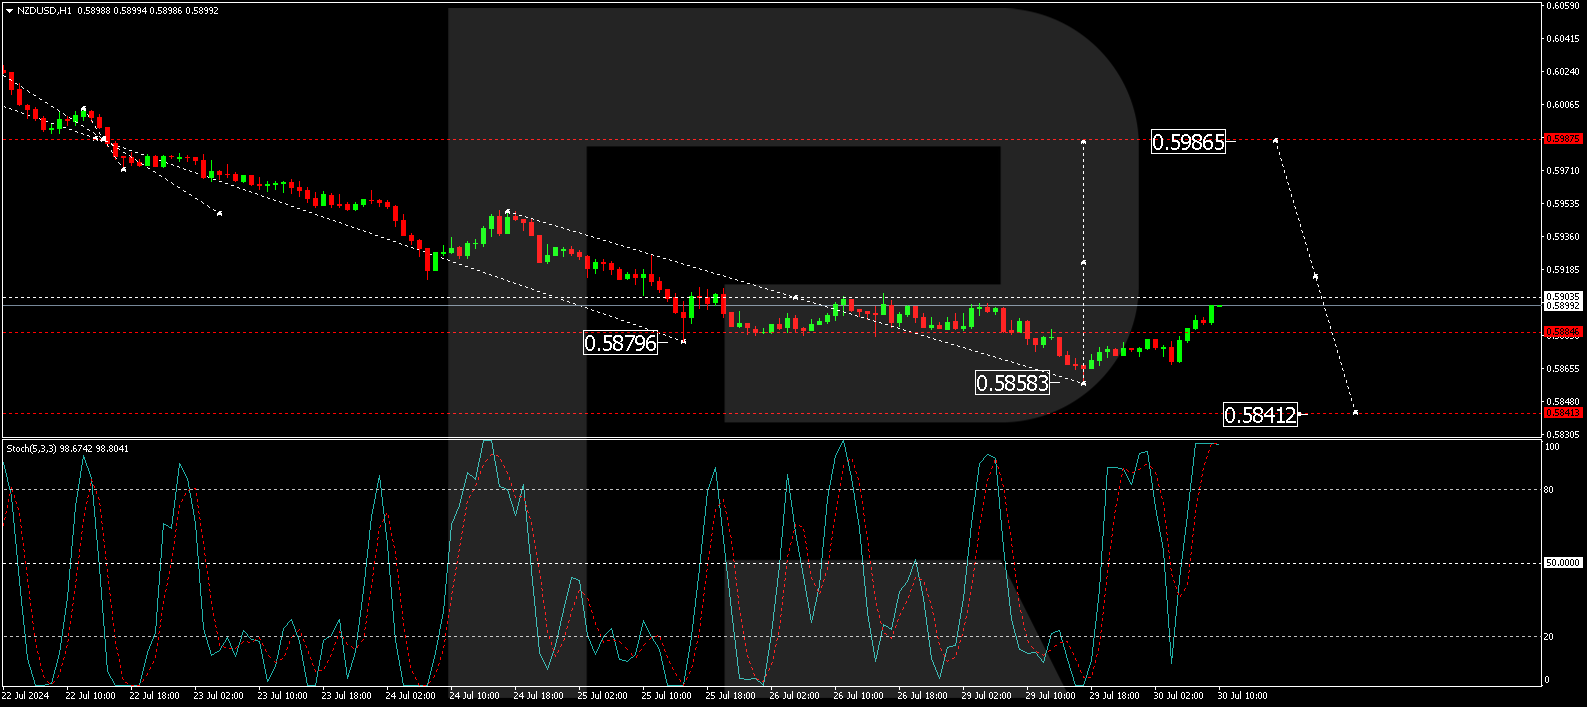
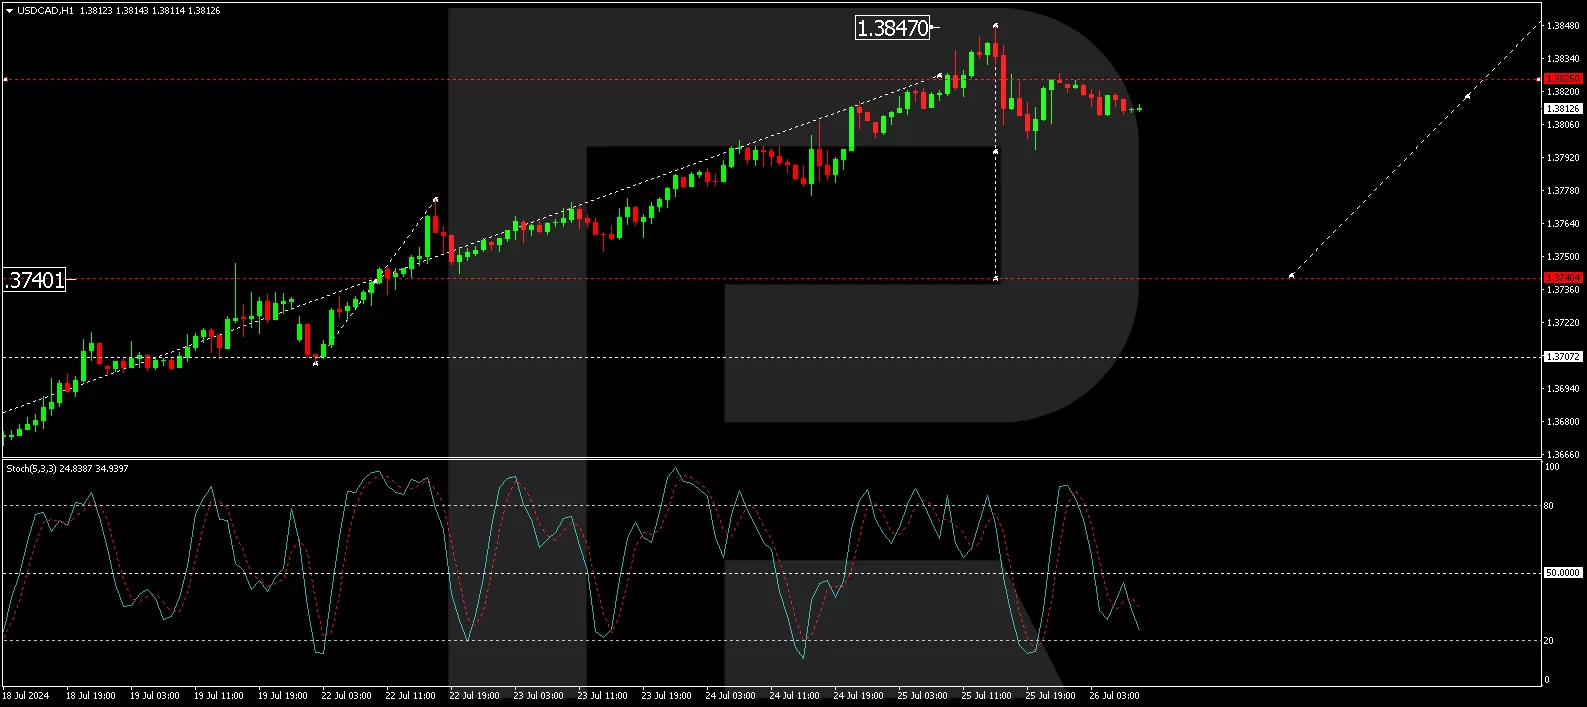
On the H1 chart, EUR/USD has formed a consolidation pattern around the 1.0913 mark. An upward breakout is expected, potentially driving the pair towards 1.0944, which is seen as a corrective move against the previous downtrend. Upon completion of this correction, the focus will shift to a new declining phase targeting 1.0888. This technical perspective is corroborated by the Stochastic oscillator, with its signal line poised to move from below the 80 level to around 20, suggesting an impending downward momentum.

Overall, the EUR/USD pair shows signs of temporary equilibrium as it navigates through speculative currents and awaits clearer directional cues from upcoming economic data or Federal Reserve communications.


Disclaimer

Any forecasts contained herein are based on the author’s particular opinion. This analysis may not be treated as trading advice. RoboForex bears no responsibility for trading results based on trading recommendations and reviews contained herein.

NZD/USD Sees Recovery After Hitting Nine-Month Low

By RoboForex Analytical Department

The NZD/USD pair has shown signs of recovery, reaching 0.5941 after initially plunging to a nine-month low. This downturn was triggered by concerns over a potential US recession, driven by weak job sector data, which rattled global financial markets.

As risk aversion spiked, the New Zealand dollar and other currencies declined steeply. This market turmoil reflects growing fears that the Federal Reserve may run out of time to adjust monetary policy to avert economic troubles.

The Reserve Bank of New Zealand (RBNZ) will meet next week. Current market expectations lean towards a rate cut, possibly by 25 basis points, reducing the interest rate to 5.25% per annum on 14 August. This anticipated move is part of a broader global trend towards monetary easing.

Further rate reductions in New Zealand could follow, with projections suggesting a potential decrease to 4.75% per annum by the end of 2024.

Technical analysis of NZD/USD

On the H4 chart, the NZD/USD pair executed a downside wave to 0.5850 and a correction to 0.5977. Today, the market is forming another wave of decline towards 0.5800, after which a correction to 0.5977 is likely (testing from below). On the technical analysis side, this scenario is confirmed by the MACD indicator with its signal line above the zero mark and pointing downwards.

On the H1 chart, the NZD/USD pair forms downward waves to 0.5892. After working off this level, a correction to 0.5936 (testing from below) is likely, and the next wave of decline to 0.5850 is expected to develop with the prospect of trend continuation to 0.5800. This bearish NZD/USD forecast is corroborated by the Stochastic Oscillator, whose signal line is currently below 50 and showing a solid downward trend.

Investors and traders will closely monitor upcoming speeches and reports from central banks, especially the Federal Reserve and RBNZ, as these will significantly influence the currency pair’s movements in the near term.


Disclaimer

Any forecasts contained herein are based on the author’s particular opinion. This analysis may not be treated as trading advice. RoboForex bears no responsibility for trading results based on trading recommendations and reviews contained herein.

Rapid Yen Appreciation: Key Factors Boosting JPY

By RoboForex Analytical Department

The Japanese yen continues its recovery rally. The USDJPY pair falls to 143.38 on Monday.

This development is likely only the midpoint of the process as the market regains past losses and brings the JPY to equilibrium. USDJPY is currently at its lowest level since 3 January.

Several reasons are driving this movement. The first is the winding down of carry trade operations on the yen. The process started earlier when it became clear that the Bank of Japan was moving towards tightening monetary conditions.

The second concern is that a US recession is playing an important role. Friday’s employment data was weaker than expected, triggering fears that the Federal Reserve might delay its decision on interest rate cuts. The market is worried the Fed could be late in making a crucial decision.

The third key factor for the JPY is the increased attractiveness of the yen as a safe-haven asset amid escalating geopolitical tensions in the Middle East. The ongoing conflict in the region poses a hypothetical threat to global stability, and investors are factoring in this risk and favouring safe-haven assets.

Technical analysis: USD/JPY

The USD/JPY pair formed a consolidation range of around 149.80 before breaking downwards on impactful news. The decline reached 142.00, setting a local low. We anticipate a new consolidation phase above this level. An upward break could see a corrective move towards 149.80. Conversely, a downward exit might extend losses towards 138.10. The MACD indicator supports this bearish outlook, showing continued downward momentum.

After reaching 142.00, a corrective phase to 147.33 may unfold, representing an intermediate target. Following this correction, a further decline to 144.66 could occur. This analysis aligns with the Stochastic oscillator, indicating a potential for an upward correction from oversold levels.


Disclaimer

Any forecasts contained herein are based on the author’s particular opinion. This analysis may not be treated as trading advice. RoboForex bears no responsibility for trading results based on trading recommendations and reviews contained herein.

GBP/USD Under Pressure as Market Anticipates Bank of England Rate Decision

By RoboForex Analytical Department

The British pound sterling continues to decline steadily against the US dollar. The GBP/USD pair is trending towards 1.2848.

On the one hand, the pressure from the USD rate is evident. On the other hand, investors are awaiting the outcome of today’s Bank of England meeting and its decision on interest rates.

There is speculation that the BoE will lower the interest rate from 5.25% to 5.00% today. The inflationary environment, coupled with the state of the employment market in the UK, supports this adjustment. The probability of a rate cut is currently estimated at 65%.

An early move towards monetary policy easing is considered possible for the Bank of England. However, the regulator’s tone in its statements may be relatively cautious, indicating that the BoE is unlikely to lower the rate rapidly. A certain degree of conservatism can be expected from the Bank of England, which will only act if it is fully confident about the economic conditions.

This potential decision is already factored into GBP quotes. The future movements in GBPUSD will be directly influenced by the details provided in the Bank of England’s accompanying statement.

Technical Analysis: GBP/USD

On the H4 chart of GBP/USD, the market has executed a decline wave to 1.2820 and a subsequent correction to 1.2867. Today, the market continues its downward movement towards 1.2772. After reaching this level, we will assess the probability of a correction to 1.2870 (testing from below). After the correction is complete, we expect the beginning of a new decline wave to the local target of 1.2611. This scenario is technically supported by the MACD indicator, which shows the signal line below the zero mark and pointing downwards.

On the H1 chart of GBP/USD, a correction wave is currently underway towards 1.2867. Today, the formation of the next downward wave to the initial target of 1.2772 is in progress. After reaching this level, we will evaluate the likelihood of a new correction wave towards 1.2870. Following the completion of the correction, we expect a new decline wave to 1.2770. This scenario is technically confirmed by the Stochastic oscillator, with its signal line positioned below 50 and continuing to decline towards 20.

Investors and traders should closely monitor the BoE’s statement for any indications of future policy direction, as it will be crucial in determining the short to medium-term trajectory of the GBP/USD pair.


Disclaimer

Any forecasts contained herein are based on the author’s particular opinion. This analysis may not be treated as trading advice. RoboForex bears no responsibility for trading results based on trading recommendations and reviews contained herein.

USD/JPY Plummets as Bank of Japan Tightens Policy

By RoboForex Analytical Department

The USD/JPY pair has experienced a sharp decline, currently at 152.79, following decisive monetary policy adjustments by the Bank of Japan (BoJ). In a significant shift, the BoJ raised its interest rate to 0.25% per annum and unveiled plans to scale back monthly bond purchases to approximately 3 trillion yen by Q1 2026. Further interest rate hikes and monetary policy adjustments are on the table if economic activities and inflation pressures align with projections.

This move comes as the BoJ faces increasing pressure from government and financial authorities to mitigate the yen’s weakness and curb rising inflation. The yen’s devaluation has been a pressing concern, intensifying inflationary pressures within the country.

Recent data from Japan provided mixed signals: retail sales reached a four-month high in June, indicating robust consumer activity, whereas industrial production showed a smaller-than-expected decline.

As the market continues to digest the BoJ’s new stance, the USD/JPY pair shows potential for further declines, especially if the market fully assimilates these recent adjustments from the Japanese central bank.

Technical Analysis: USD/JPY

The USD/JPY pair formed a consolidation range around 153.03, extending between 155.20 and 152.10. Following a breakout below this range, there is a visible downward trajectory towards 151.26, potentially extending to 150.77. The MACD indicator, positioned below zero with a downward trajectory, supports this bearish outlook.

After completing a decline to 151.57 and a subsequent correction to 153.88, the market is poised for another downward movement towards 151.35, potentially continuing to 150.77. This bearish forecast is bolstered by the Stochastic oscillator, below the 50 mark and trending downwards, indicating continued selling pressure.


Disclaimer

Any forecasts contained herein are based on the author’s particular opinion. This analysis may not be treated as trading advice. RoboForex bears no responsibility for trading results based on trading recommendations and reviews contained herein.

USDJPY: Braced for BoJ & Fed combo

By ForexTime 

  • USDJPY could see extreme volatility this week
  • Over past year BoJ decision triggered moves of ↑ 1.1%
  • Fed decision sparked moves of ↑ 0.6% & ↓ 1.3% over past year
  • Bloomberg FX model: 77% USDJPY – (151.30 – 157.99)
  • Key technical level – 155.00

A super central bank combo featuring the Bank of Japan (BoJ) and Federal Reserve (Fed) could rattle the USDJPY!

That’s right, markets are forecasting this to be one of the most volatile weeks for the currency pair this year.

Vol

After trending lower this month and touching levels not seen since early May 2024, a significant move could be on the horizon.

Weekly

On the daily charts, a technical bounce seems to be taking place with prices lingering around resistance at 155.00.

Daily

This rebound may be the product of yen weakness as investors question whether the BoJ will hike rates tomorrow.

weakness

Nevertheless, this is a big week for the USDJPY with fresh trading opportunities on the horizon. 

This is what you need to keep an eye on.

     1) BoJ rate decision

Expectations are mixed over what actions the Bank of Japan will take this month.

Traders are currently pricing in a 50% probability that the BoJ hikes rates by 10bp in July.

Given how inflation and wage growth have picked up, this presents an argument for higher rates. However, the BoJ has a solid record of disappointing market expectations.

  • The USDJPY may trade lower if the BOJ hikes interest rates and signals more hikes down the road.
  • Should the central bank leave rates unchanged and sound more dovish than expected, this could push the USDJPY higher.

Golden nugget: Over the past year, the BoJ decision has only triggered upside moves on the USDJPY with prices rising as much as 1.1% a 6-hour window post-release.


    2) Fed rate decision

No changes to US interest rates are expected. However, much focus will be on the press conference which could offer fresh clues on future policy moves.

Traders have priced in a 25-basis point Fed cut by September with a 75% probability of another cut by November.

  • The USDJPY may fall if the Fed strikes a dovish note and signals that rates will be cut in September.
  • Should the Fed sound more hawkish than expected, the USDJPY could rise.

Golden nugget: Over the past year, the Fed decision has triggered upside moves of as much as 0.6% or declines of 1.3% in a 6-hour window post-release.


    3) Technical forces

Prices remain under pressure on the daily charts despite the recent rebound. Although the Relative Strength Index (RSI) is moving away from oversold conditions, prices are still below the 50 & 100-day SMA.  

  • A solid breakout and daily close above 155.00 may open a path toward the 100-day SMA at 155.60, 157.00 and 157.80.
  • Should 155.00 prove reliable resistance, this could send prices towards 153.70, 153.00 and the 200-day SMA at 151.70.

USDJPY2

Bloomberg’s FX model points to a 74% chance that USDJPY will trade within the 151.30 – 157.99 range over the next one-week period.


Forex-Time-LogoArticle by ForexTime

ForexTime Ltd (FXTM) is an award winning international online forex broker regulated by CySEC 185/12 www.forextime.com

NZD/USD Sinks to Three-Month Minimum, Driven by Rate Speculation and Strengthening USD

By RoboForex Analytical Department

The NZD/USD pair plummeted to 0.5892, marking a significant three-month low. The New Zealand dollar remains under pressure as the US dollar gains strength due to the start of the Federal Reserve’s two-day meeting.

The Fed is expected to leave the interest rate in the target range of 5.25-5.50% this time. At the same time, the market eagerly anticipates clear signals regarding the September meeting, when borrowing costs are expected to be lowered.

A week earlier, the NZD fell by almost 2% against the USD due to overly large-scale risk aversion in the global market, reduced carry trade positions with JPY, and China’s relatively sluggish macroeconomic background.

Expectations regarding the Reserve Bank of New Zealand’s future steps also exert fundamental pressure on the NZD. The main forecast assumes that the RBNZ will lower the interest rate soon. At the moment, investors take a rate cut at the August meeting with a 44% probability, which is quite a lot, given all the inputs.

Technical Analysis of NZD/USD

On the H4 chart of NZD/USD, the market executed a wave of decline to the level of 0.5858. Today, the market is correcting this wave of decline. We expect a growth link to the level of 0.5903. If this level is breached upwards, the correction continuing to 0.5987 (test from below) is possible. After the correction is completed, we will consider the beginning of a new wave of decline to the level of 0.5840 with the prospect of trend continuation to the level of 0.5822. Technically, this scenario is confirmed by the MACD indicator. Its signal line is under the zero mark and is directed strictly upwards.

On the H1 chart of NZD/USD, the market is forming a growth structure towards the level of 0.5903. After working off this level, we will consider the probability of a decline to the level of 0.5884 (test from above). Then, we will consider the likelihood of another growth structure to the level of 0.5986. Technically, this scenario is confirmed by the Stochastic oscillator. Its signal line is above the 80 mark. We expect a decline to the level of 50 and further to the level of 20.


Disclaimer

Any forecasts contained herein are based on the author’s particular opinion. This analysis may not be treated as trading advice. RoboForex bears no responsibility for trading results based on trading recommendations and reviews contained herein.

AUD/USD Gains Amid Anticipation for Key Economic Data

By RoboForex Analytical Department

The AUD/USD pair is climbing towards 0.6552 on Monday. The Australian dollar is bouncing back from a 12-week low as investors await Australian inflation data.

In the past two weeks, the AUD, in the currency pair with the USD, has fallen more than 3%. This happened amid a global sell-off in risky assets and also due to weak reports from China.

This week, the release of crucial price statistics will significantly influence the Reserve Bank of Australia’s future course of action. Inflation is expected to have accelerated slightly in Australia in Q2 2024. For example, for April-June, inflation could have risen by 1.0% QoQ, the same as before. In annualised terms, it could accelerate to 3.8% from 3.6% previously. The data will be released on Wednesday.

This week, Australia’s macroeconomic calendar will be particularly active. The release of reports on last quarter’s retail sales, trade balance, exports and imports, and the producer price index will provide crucial insights into the economy. The stronger the data, the better – especially amid China’s economic weakness, Australia’s main economic partner. In this context, it is essential to remain resilient.

Currently, the market estimates the probability of the RBA interest rate hike in August to be 20%.

AUD/USD technical analysis

On the H4 chart of AUD/USD, the market performed a wave of decline to 0.6513. Today, it is relevant to consider the probability of correction development to the level of 0.6609. After the correction is completed, we will consider the likelihood of trend continuation to the level of 0.6468 with the prospect of trend continuation to the level of 0.6420. Technically, such a scenario is confirmed by the MACD indicator. Its signal line is under the zero mark and is directed strictly downwards.

On the H1 AUD/USD chart, the market is forming a consolidation range around the level of 0.6561. In case of an upside exit, the potential of a wave to the level of 0.6609 will open. In case of a downward exit, we will consider the continuation of the wave to the level of 0.6468. The target is local. Technically, this scenario is confirmed by the Stochastic oscillator. Its signal line is under 50 and is directed strictly downwards to 20.


Disclaimer

Any forecasts contained herein are based on the author’s particular opinion. This analysis may not be treated as trading advice. RoboForex bears no responsibility for trading results based on trading recommendations and reviews contained herein.

USD/CAD Rally Pauses: Awaiting Next Correction

By RoboForex Analytical Department

The USD/CAD pair ended its continuous upward trend on Friday, 26 June 2024, settling around 1.3813, signalling a potential shift towards correction.

The Bank of Canada decided to lower the interest rate from 4.75% p.a. to 4.50% p.a. at its meeting this week. Overall, the tone of the Canadian regulator’s remarks has changed. The Bank of Canada expects the economy to grow by 1.2% this year versus the previous forecast of 1.5%. Expectations for 2025 and 2026 were adjusted to 2.1% and 2.4% from 2.2% and 1.9%.

Inflation forecasts were also changed. By the end of 2024, the overall consumer price index is expected to fall to 2.6%. Inflation will be 2.4% in 2025 and 2.0% in 2026.

The Bank of Canada is confident that the state of the economy is well positioned for inflation to return to target even if economic activity improves slightly in the second half of this year.

Since 11 July, the CAD has been falling almost nonstop in tandem with the USD. It has only started to correct now that it has reached a three-month low.

USD/CAD technical analysis

On the H4 chart of USD/CAD, the market has formed a consolidation range around 1.3740 and worked off the local target of the growth wave at 1.3847 in an upward movement. Today, we expect a new consolidation range to form at the current highs. In case of a downside exit, we will consider the probability of correction to 1.3740 (test from above). In case of an upward exit, we will consider the likelihood of the trend’s continuation to 1.3892. Technically, this scenario is confirmed by the MACD indicator. Its signal line is at the maximum and is preparing for a decline.

On the USD/CAD H1 chart, the market made a downward impulse to the level of 1.3795 and a correction to the level of 1.3825. The market has practically marked the boundaries of the consolidation range. We expect the exit from this range down to the level of 1.3790. If this level is breached, we will consider the correction wave development to continue to 1.3763. The target is local. Technically, this scenario is confirmed by the Stochastic oscillator. Its signal line is under the mark of 50 and is directed strictly downwards to the level of 20.


Disclaimer

Any forecasts contained herein are based on the author’s particular opinion. This analysis may not be treated as trading advice. RoboForex bears no responsibility for trading results based on trading recommendations and reviews contained herein.

GBP/USD Faces Downward Pressure Amid US Dollar Strength

By RoboForex Analytical Department

GBP/USD pair is down to 1.2892 on Thursday. Selling intensified on the 18th of July. Since then, GBP has remained under pressure, although it is making attempts to stabilise.

Statistics released earlier showed that UK private sector activity improved in July. PMI data indicated that activity in the services sector expanded slightly, while in the industrial segment, it was the highest since February 2022.

The data aligned with forecasts and confirmed the positive sentiment in industrial production after Labour’s convincing election victory.

The market is watching the situation with the Bank of England interest rate. The probability of a rate reduction at the August meeting is at most 40%. The UK regulator holds a neutral view of the monetary policy structure and is unlikely to make decisions that could have a mixed effect.

Overall, GBP remains under pressure from the US Dollar, which is receiving support from various sides.

GBP/USD Technical Analysis

On the H4 chart of GBP/USD, the market has formed a consolidation range around the 1.2911 level. Today, the market broke out of this range downwards. The potential for a downside wave to 1.2777 is almost open. The target is the first one. After reaching this level, we will consider the probability of correction to 1.2911 (test from below). Technically, this scenario is confirmed by the MACD indicator. Its signal line is above the zero mark and is directed strictly downwards.

On the H1 chart of GBP/USD, a correction wave to the level of 1.2937 is performed. Today, the structure of decrease to the level of 1.2858 is formed. After working off this level, we will consider the probability of a growth link to the level of 1.2897. At this point, the correction potential will be exhausted. After the correction is over, we will consider the beginning of a new wave of decline to 1.2824 with the prospect of trend continuation to the level of 1.2777. Technically, this scenario is confirmed by the Stochastic oscillator. Its signal line is under the level of 50 and continues to decline to the level of 20.


Disclaimer

Any forecasts contained herein are based on the author’s particular opinion. This analysis may not be treated as trading advice. RoboForex bears no responsibility for trading results based on trading recommendations and reviews contained herein.