Archive for Forex and Currency News – Page 316

The Analytical Overview of the Main Currency Pairs on 2021.02.01

by JustForex

The EUR/USD currency pair

Technical indicators of the currency pair:
  • Prev Open: 1.2122
  • Prev Close: 1.2135
  • % chg. over the last day: +0.11%.

EUR/USD continues to consolidate after falling in the first half of January. Having formed a range of 120 points, the pair seems to have been stuck in it for a long time and additional drivers are needed to exit in one direction or another. This week will be rich in economic data which could trigger increased volatility.

Trading recommendations
  • Support levels: 1.2077, 1.2059
  • Resistance levels: 1.2189, 1.2222, 1.2283

The main trading scenario for EUR/USD is trading in a sideways range between 1.2094 and 1.2155. 1.2059 level remains important. In case of its breakthrough, the southern correction will resume in a new wave. The MACD is near zero. The ADX only reacts to price declines. Since the price is stuck close to the moving averages, the total result for all signals is neutral.

Alternative scenario: if the price can gain a foothold above the level of 1.2155, the pair may move to an increase to 1.2222. The breakthrough of 1.2059 will resume a wave of sales.

EUR/USD
News feed for 2021.02.01:
  • – The German Manufacturing Purchasing Managers’ Index (PMI) (Jan) at 10:55 (GMT+2);
  • – The Eurozone Manufacturing Purchasing Managers’ Index (PMI) (Jan) at 11:00 (GMT+2);
  • – The USA ISM Manufacturing Purchasing Managers’ Index (PMI) (Jan) at 17:00 (GMT+2).

The GBP/USD currency pair

Technical indicators of the currency pair:
  • Prev Open: 1.3717
  • Prev Close: 1.3702
  • % chg. over the last day: -0.11%

The British pound continues to trade near its annual highs. This week traders are waiting for a meeting of the Bank of England, which should clarify whether it is going to keep strengthening the monetary stimulus of the economy. The majority of economists are inclined to believe that the regulator will leave the stimulus at the same level, which will support the sterling bulls.

Trading recommendations
  • Support levels: 1.3622, 1.3517
  • Resistance levels: 1.3744, 1.4386

The main scenario for the GBP/USD pair is trading sideways between 1.3622 and 1.3744. The pair trades strictly from support to resistance level and intraday movements look rather chaotic. During the Asian session, the growth of quotations was accompanied by a significant reaction of the ADX and the MACD, which increased the likelihood of a breakthrough of the upper line of the range.

Alternative scenario: if the pair consolidates above 1.3744, it is likely to resume movement up to 1.3800. A breakthrough at the 1.3622 level could trigger a further fall towards 1.3517.

GBP/USD
News feed for 2021.02.01:
  • – The UK Manufacturing Purchasing Managers’ Index (PMI) (Jan) at 11:30 (GMT +2).

The USD/JPY currency pair

Technical indicators of the currency pair:
  • Prev Open: 104.23
  • Prev Close: 104.70
  • % chg. over the last day: +0.45%

The growth of the dollar-yen pair continues to gain momentum. Despite the absence of a change in the dollar index quotes on Friday, the pair showed a strong bullish momentum amid rising Treasury yields. On the daily timeframe, the pair has consolidated above the moving averages, which suggests the beginning of a deep northern correction.

Trading recommendations
  • Support levels: 104.40, 103.56
  • Resistance levels: 104.94, 105.68

The main scenario is buying on a decline. The ADX shows a decrease in upside potential, but this is due to consolidation in a narrow price range. As long as the price is above the moving averages, all specifications will indicate growth.

An alternative scenario assumes the price fixing below 104.40. In this case, the pair may return to the previous trading range of 104.40 – 103.56.

USD/JPY
News feed for 2021.02.01:
  • – The USA ISM Manufacturing Purchasing Managers’ Index (PMI) (Jan) at 17:00 (GMT+2).

The USD/CAD currency pair

Technical indicators of the currency pair:
  • Prev Open: 1.2826
  • Prev Close: 1.2771
  • % chg. over the last day: -0.43%

The movement of the pair on Friday indicates that there is strong resistance in the area of 1.2875. The news background was in favor of the Canadian currency. The GDP growth in November was more significant than economists expected. A 0.7% increase indicates a more positive end of the fourth quarter of last year.

Trading recommendations
  • Support levels: 1.2737, 1.2686
  • Resistance levels: 1.2875, 1.2932

The main scenario is selling. All technical indicators were sharply redirected. The price consolidated below the moving averages. The MACD has sharply moved into the negative area. The ADX is still faintly reacting to the price decline. The Monday trading may be sluggish, and the decline will be limited by the first resistance level.

Alternative scenario: if the price consolidates above 1.2815, the pair may resume its growth.

USD/CAD
News feed for 2021.02.01:
  • – The USA ISM Manufacturing Purchasing Managers’ Index (PMI) (Jan) at 17:00 (GMT+2).

by JustForex


This article reflects a personal opinion and should not be interpreted as an investment advice, and/or offer, and/or a persistent request for carrying out financial transactions, and/or a guarantee, and/or a forecast of future events.

China’s manufacturing sector has weakened. The stock market is consolidating after falling last week

by JustForex

The beginning of February for the markets may start with a slight disappointment regarding the global economic recovery. China’s Caixin Manufacturing Index slowed in January, falling to a seven-month low of 51.5 when the forecast was 52.7. Production and new orders were growing at a slower pace, while export sales decreased for the first time in six months as COVID-19 resumes worldwide. Retail sales showed the biggest slowdown since May last year. Employment fell after stabilizing in December. Business sentiment hit its lowest level in eight months.

So far, stock indices in China have ignored the indicators and closed the Asian session with a slight plus. But G10 government bonds show negative dynamics, which may subsequently affect the stock market.

A report from the Federal Statistics Office of Germany showed decreasing sales of 9.6% compared to the previous month, which is much worse than the market one. This is the first decline in 3 months due to repeated restrictions related to the pandemic. Against this background, the European currency decreased again. The credit market hasn’t shown significant fluctuations yet.

Last week, the fall in major stock indices was the largest in the past three months. The MSCI Emerging Markets Index decreased by 4.5%, the worst since March last year, as delays in vaccine supply and fluctuations caused by retail traders in the US markets eroded risk appetite. But banking giants such as Goldman Sachs Group Inc., Societe Generale SA, and Loomis Sayles & Co see no reason to sell on a large scale, expecting stock prices to rise over the long term.

Main market quotes:

S&P 500 (F) 3,731.38 +26.13 (+0.71%)

Dow Jones 29,982.62 -620.74 (-2.03%)

DAX 13,566.85 +133.98 (+1.00%)

FTSE 100 6,449.99 +42.53 (+0.66%)

USD Index 90.665 +0.130 (+0.14%)

Important events:
  • – Caixin Manufacturing PMI in China (Jan) at 03:45 (GMT+2);
  • – German Manufacturing PMI (Jan) at 10:55 (GMT+2);
  • – Eurozone Manufacturing PMI (Jan) at 11:00 (GMT+2);
  • – UK Manufacturing PMI (Jan) at 11:30 (GMT+2);
  • – ISM Manufacturing PMI in the US (Jan) at 17:00 (GMT+2).

by JustForex


This article reflects a personal opinion and should not be interpreted as an investment advice, and/or offer, and/or a persistent request for carrying out financial transactions, and/or a guarantee, and/or a forecast of future events.

Ichimoku Cloud Analysis 29.01.2021 (NZDUSD, USDJPY, USDCAD)

Article By RoboForex.com

NZDUSD, “New Zealand Dollar vs US Dollar”

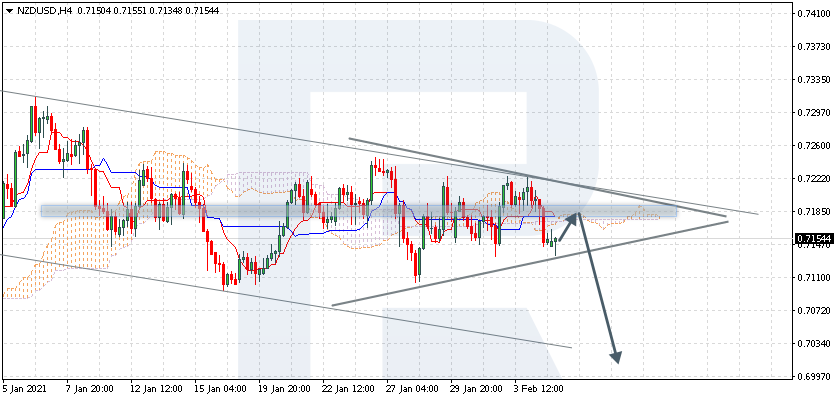
NZDUSD is trading at 0.7152; the instrument is moving below Ichimoku Cloud, thus indicating a descending tendency. The markets could indicate that the price may test the cloud’s downside border at 0.7165 and then resume moving downwards to reach 0.7075. Another signal in favor of a further downtrend will be a rebound from the descending channel’s upside border. However, the bearish scenario may be canceled if the price breaks the cloud’s upside border and fixes above 0.7185. In this case, the pair may continue growing towards 0.7245.

NZDUSD
Risk Warning: the result of previous trading operations do not guarantee the same results in the future

USDJPY, “US Dollar vs Japanese Yen”

USDJPY is trading at 104.45; the instrument is moving above Ichimoku Cloud, thus indicating an ascending tendency. The markets could indicate that the price may test Tenkan-Sen and Kijun-Sen at 104.35 and then resume moving upwards to reach 105.05. Another signal in favor of a further uptrend will be a rebound from the rising channel’s downside border. However, the bullish scenario may no longer be valid if the price breaks the cloud’s downside border and fixes below 103.75. In this case, the pair may continue falling towards 102.85.

USDJPY
Risk Warning: the result of previous trading operations do not guarantee the same results in the future

USDCAD, “US Dollar vs Canadian Dollar”

USDCAD is trading at 1.2871; the instrument is moving above Ichimoku Cloud, thus indicating an ascending tendency. The markets could indicate that the price may test the cloud’s upside border at 1.2835 and then resume moving upwards to reach 1.2985. Another signal in favor of a further uptrend will be a rebound from the rising channel’s downside border. However, the bullish scenario may no longer be valid if the price breaks the cloud’s downside border and fixes below 1.2745. In this case, the pair may continue falling towards 1.2655.

USDCAD

Article By RoboForex.com

Attention!
Forecasts presented in this section only reflect the author’s private opinion and should not be considered as guidance for trading. RoboForex LP bears no responsibility for trading results based on trading recommendations described in these analytical reviews.

The Analytical Overview of the Main Currency Pairs on 2021.01.29

by JustForex

The EUR/USD currency pair

Technical indicators of the currency pair:
  • Prev Open: 1.2109
  • Prev Close: 1.2121
  • % chg. over the last day: +0.10%.

EUR/USD is still keeping the first resistance level from falling. However, the pair is clearly in no hurry to start growing. The US GDP data turned out rather positive overall. As a result, the Treasury yields rose slightly against German Bonds. Medium-term indicators remain on the bearish side.

Trading recommendations
  • Support levels: 1.2077, 1.2059
  • Resistance levels: 1.2189, 1.2222, 1.2283

The main scenario for trading EUR/USD is selling. In case of a breakthrough of the important 1.2059 level, the wave of sales can significantly gain momentum. The MACD is fixed in the negative area on the H1 time frame. The ADX is declining, showing a significant increase in potential. As long as the price stays below the moving averages, short positions will be relevant.

Alternative scenario: if the price fixes above the level of 1.2144, the pair may increase to 1.2222.

EUR/USD
News feed for 2021.01.29:
  • – The GDP of Germany (q/q) (4q) at 11:00 (GMT+2);
  • – German Unemployment Change (Jan) at 11:00 (GMT+2).

The GBP/USD currency pair

Technical indicators of the currency pair:
  • Prev Open: 1.3683
  • Prev Close: 1.3716
  • % chg. over the last day: +0.24%

The growth of the dollar puts slight pressure on the pound. Yesterday, at the first southern pullback of the greenback, sterling reached the highs of the year. It indicates the strength of the bulls, which can continue the upward trend at the earliest opportunity. Though traders still lack drivers for growth. They may appear next week after the Bank of England meeting.

Trading recommendations
  • Support levels: 1.3622, 1.3517
  • Resistance levels: 1.3744, 1.4386

The main scenario for trading GBP/USD is trading sideways between 1.3622 and 1.3701. The pair is trading strictly from support to resistance and runs the risk of being stuck in this range until the end of next week, as a strong news background is not expected shortly. All technical indicators are gradually reduced to zero.

Alternative scenario: if the pair consolidates above 1.3701, it is likely to return to 1.3744. A breakthrough of 1.3622 could trigger a further fall towards 1.3517.

GBP/USD
There is no news feed for today.

The USD/JPY currency pair

Technical indicators of the currency pair:
  • Prev Open: 104.08
  • Prev Close: 104.24
  • % chg. over the last day: +0.15%

The growth of the dollar-yen currency pair continues to gain momentum. Despite a slight decline in the dollar index on Thursday, the pair was able to close in positive territory amid rising Treasury yields. The instrument continues to ignore the stock market. On the daily chart, a breakthrough of the SMA100 moving average signals the start of a deep correction.

Trading recommendations
  • Support levels: 103.56, 103.32
  • Resistance levels: 104.76, 105.68

The main scenario is buying on a decline. The ADX shows a slight decrease in the upside potential, and at the same time, the pair is ready to move further northward. As long as the price is above the moving averages, all specifications will indicate growth.

Alternative scenario assumes the price-fixing below 103.95. In this case, the pair may return to the previous trading range.

USD/JPY
News feed for 2021.01.29:
There is no news feed for today.

The USD/CAD currency pair

Technical indicators of the currency pair:
  • Prev Open: 1.2799
  • Prev Close: 1.2825
  • % chg. over the last day: +0.20%

The Canadian dollar shows the greatest weakness against the US dollar among the G10 currencies. One of the growth drivers is the correction in the oil market. Brent lost just over $50 per barrel on Thursday. The daily chart showed the likelihood of a deep correction.

Trading recommendations
  • Support levels: 1.2786, 1.2624
  • Resistance levels: 1.2875, 1.2932

The main scenario is buying on a decline. All technical indicators are set for strong growth. The moving averages are directed sharply upward. A stop near the 1.2875 resistance and formation of a double top pattern could signal a short-term stop or a southern pullback. A stop near the 1.2875 resistance level and formation of a double top pattern could signal a short-term stop or a southern pullback.

Alternative scenario: if the price consolidates below 1.2786, the pair may return to 1.2686.

USD/CAD
News feed for 2021.01.29:
  • – Canadian GDP (m/m) (Nov) 15:30 (GMT+2).

by JustForex


This article reflects a personal opinion and should not be interpreted as an investment advice, and/or offer, and/or a persistent request for carrying out financial transactions, and/or a guarantee, and/or a forecast of future events.

The European economy is showing resilience in the fourth quarter of 2020

by JustForex

The release of GDP data of two out of the four largest economies of the Eurozone – France and Spain – didn’t add optimism in the market. These countries finished 2020 better than expected, suggesting that the region is likely to pull out of a deep recession.

Spain’s gross domestic product unexpectedly rose to 0.4%, despite expectations for a 1.4% fall. France’s GDP decreased by 1.3% against the expected -4.0%. The higher figures are generated by the acceleration in consumer spending. In France, there was a sharp rebound in the retail sector to 23% in December after falling in November by 18%. Spanish consumer prices showed positive dynamics instead of the expected deflation.

However, the outlook in both countries remains bleak just like in the bigger part of the region. The risk of longer constraints and greater need for incentives is on the horizon. European Central Bank President Christine Lagarde has already pledged to strengthen stimulus measures if necessary.

The stock market remains pressured. S&P 500 futures contracts continue to decline as traders move into defensive assets. The dollar showed the biggest weekly gain since October. South Korea has the largest losses in the entire Asian region. European stocks lost about 1% at the opening of trading. US Treasuries yield rose to 1.055%.

It seems that the week ends with the strongest decrease in three months. Some Wall Street strategists are confident that investors should buy the decline due to the expected economic recovery from the pandemic. Others fear that delays in vaccine supplies signal overestimated recovery estimates.

Main market quotes:

S&P 500 (F) 3,743.88 -35.37 (-0.94%)

Dow Jones 30,603.36 +300.19 (+0.99%)

DAX 13,534.05 -131.88 (-0.97%)

FTSE 100 6,468.75 -57.40 (-0.88%)

USD Index 90.657 +0.230 (+0.25%)

Important events:
  • – German GDP (q/q) (4 qtr.) at 11:00 (GMT+2);
  • – German Unemployment Change (Jan) at 11:00 (GMT+2);
  • – Canadian GDP (MoM) (Nov) at 15:30 (GMT+2).

by JustForex


This article reflects a personal opinion and should not be interpreted as an investment advice, and/or offer, and/or a persistent request for carrying out financial transactions, and/or a guarantee, and/or a forecast of future events.

Murrey Math Lines 28.01.2021 (USDCHF, GOLD)

Article By RoboForex.com

USDCHF, “US Dollar vs Swiss Franc”

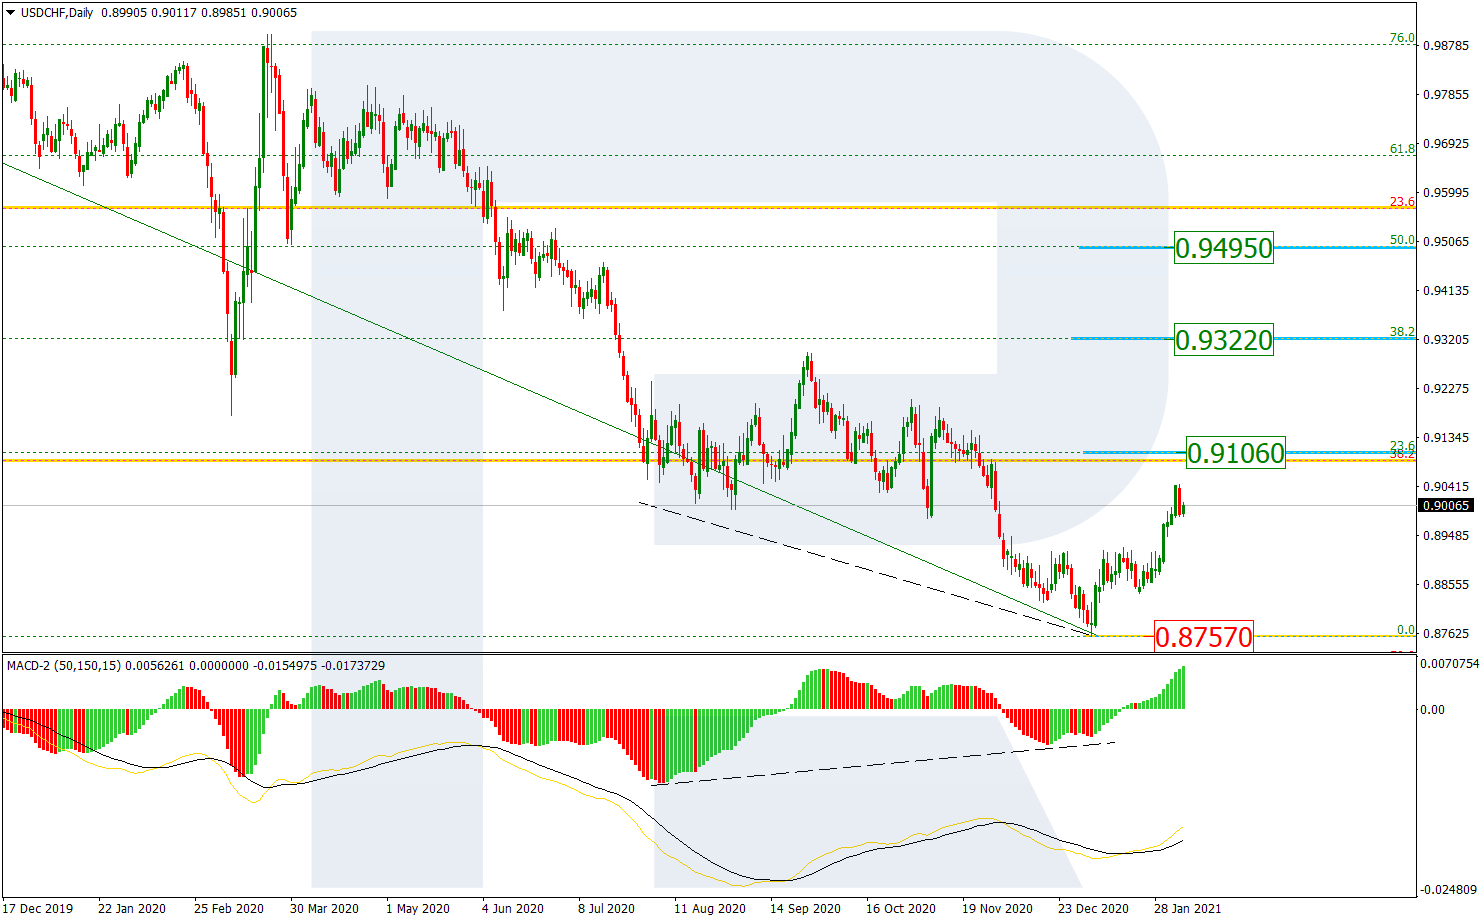
In the H4 chart, USDCHF is consolidating between 3/8 and 5/8. In this case, the price is expected to break 4/8 and then continue growing to reach the resistance at 5/8. Still, this scenario may no longer be valid if the price breaks 3/8 to the downside. After that, the instrument may reverse and fall towards the support at 2/8.

USDCHF_H4
Risk Warning: the result of previous trading operations do not guarantee the same results in the future

As we can see in the M15 chart, the pair has broken the upside line of the VoltyChannel indicator and, as a result, may continue the ascending tendency.

USDCHF_M15
Risk Warning: the result of previous trading operations do not guarantee the same results in the future

XAUUSD, “Gold vs US Dollar”

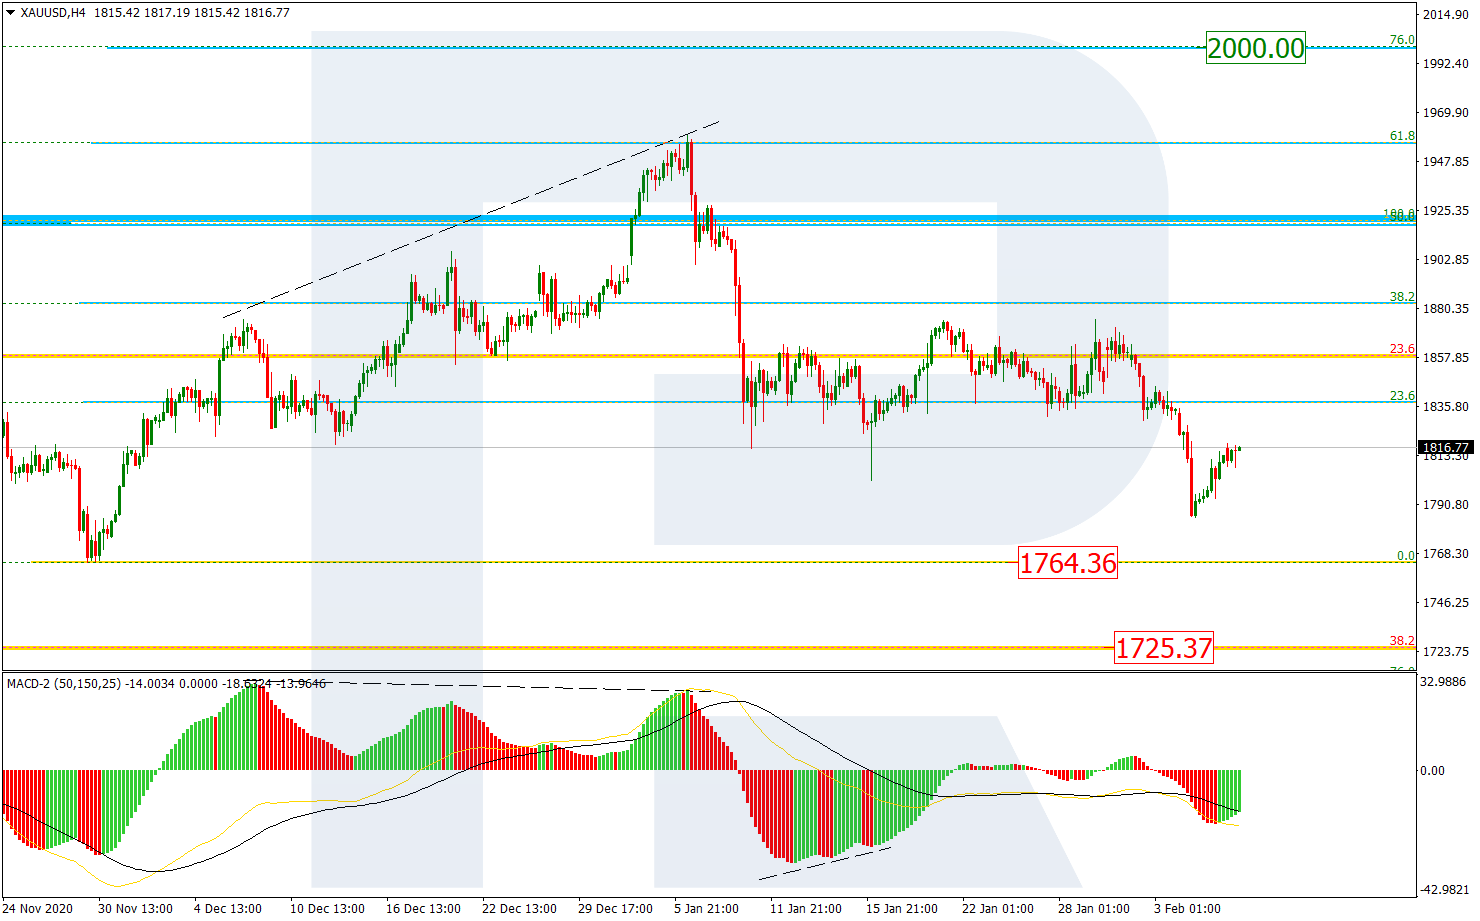
In the H4 chart, XAUUSD is moving below the 200-day Moving Average, thus indicating a descending tendency. In this case, the price is expected to break 1/8 and then continue falling to reach the support at 0/8. However, this scenario may no longer be valid if the price breaks the resistance at 2/8 to the upside. After that, the instrument may continue growing towards 3/8.

XAUUSD_H4
Risk Warning: the result of previous trading operations do not guarantee the same results in the future

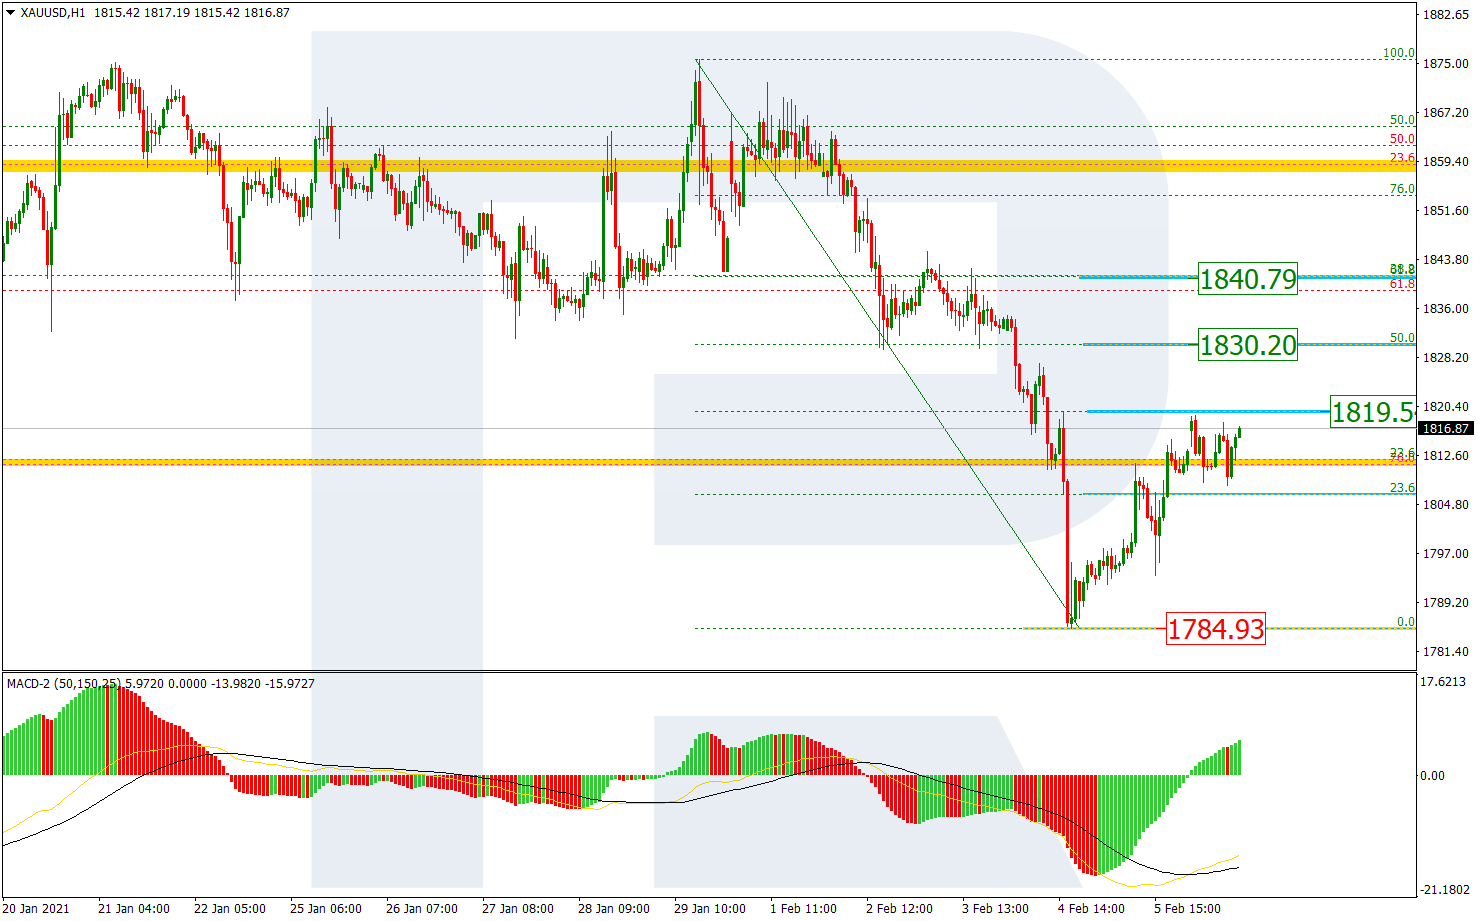
As we can see in the M15 chart, the price has broken the downside line of the VoltyChannel indicator and, as a result, may continue falling.

XAUUSD_M15

Article By RoboForex.com

Attention!
Forecasts presented in this section only reflect the author’s private opinion and should not be considered as guidance for trading. RoboForex LP bears no responsibility for trading results based on trading recommendations described in these analytical reviews.

Japanese Candlesticks Analysis 28.01.2021 (USDCAD, AUDUSD, USDCHF)

Article By RoboForex.com

USDCAD, “US Dollar vs Canadian Dollar”

As we can see in the H4 chart, the ascending tendency continues. Right now, after forming a Shooting Star reversal pattern not far from the resistance level, USDCAD may reverse in the form of another correctional wave towards the support area at 1.2720. Later, the asset may resume growing. In this case, the upside target will be at 1.2910. However, an alternative scenario implies a further growth towards 1.2910 without reversing and correcting.

USDCAD
Risk Warning: the result of previous trading operations do not guarantee the same results in the future

AUDUSD, “Australian Dollar vs US Dollar”

As we can see in the H4 chart, AUDUSD is forming a new descending impulse. Right now, after forming several reversal patterns, such as Hammer, not far from the support area, the pair may reverse and resume growing to reach the resistance area at 0.7740. At the same time, an opposite scenario says that the price may fall to return to 0.7595 without testing the resistance area.

AUDUSD
Risk Warning: the result of previous trading operations do not guarantee the same results in the future

USDCHF, “US Dollar vs Swiss Franc”

As we can see in the H4 chart, the correction within the downtrend continues. At the moment, after forming several reversal patterns, such as Shooting Star, not far from the resistance area, USDCHF is correcting. Later, the asset may complete the correction and resume the descending tendency. In this case, the downside target may be the next support area at 0.8845. Still, there might be an alternative scenario, according to which the asset may start a new pullback towards 0.8930 before failing to test the support area.

USDCHF

Article By RoboForex.com

Attention!
Forecasts presented in this section only reflect the author’s private opinion and should not be considered as guidance for trading. RoboForex LP bears no responsibility for trading results based on trading recommendations described in these analytical reviews.

The Analytical Overview of the Main Currency Pairs on 2021.01.28

by JustForex

The EUR/USD currency pair

Technical indicators of the currency pair:
  • Prev Open: 1.2151
  • Prev Close: 1.2110
  • % chg. over the last day: -0.34%.

EUR/USD has tested the support level of 1.2059 again, but without success so far. After the Fed meeting, traders will focus on GDP data, which will be released today at the beginning of the US trading session. If the performance is better than expected (more than 4.0% in the fourth quarter), the bearish pressure may increase and the price may break this level.

Trading recommendations
  • Support levels: 1.2077, 1.2059
  • Resistance levels: 1.2189, 1.2222, 1.2283

The main scenario for trading EUR/USD is selling. If the price fixes below the important level of 1.2059, the wave of selling may increase significantly. The MACD shows convergence towards the south. The declining ADX shows a significant increase in potential. As long as the price stays below the moving averages, short positions will be relevant.

The alternative scenario: if the price manages to fix above the level of 1.2144, the pair may move to an increase to 1.2222.

EUR/USD
News feed for 2021.01.28:
  • – The US GDP (Q/Q) (Q4) at 15:30 (GMT+2);
  • – US Initial Jobless Claims at 15:30 (GMT+2).

The GBP/USD currency pair

Technical indicators of the currency pair:
  • Prev Open: 1.3732
  • Prev Close: 1.3684
  • % chg. over the last day: -0.35%

Despite the equal decline of the sterling in comparison with the euro, the British currency still holds a leading position. Wednesday’s bearish move was based solely on the appreciation of the dollar. The pound has not even reached the support level and, apparently, may remain in the weekly range.

Trading recommendations
  • Support levels: 1.3622, 1.3517
  • Resistance levels: 1.3744, 1.4386

The main scenario for trading GBP/USD is trading sideways between 1.3622 and 1.3701. Sterling managed to renew the highs, but there was only a puncture of the level and the price immediately reversed. The resistance is still strong. The price has consolidated below the moving averages, but the ADX is not showing an upward trend. This suggests that the decline may be limited.

The alternative scenario: if the pair consolidates above 1.3701, it is likely to return to 1.3744. A breakdown at 1.3622 could trigger a further fall towards 1.3517.

GBP/USD
There is no news feed for today.

The USD/JPY currency pair

Technical indicators of the currency pair:
  • Prev Open: 103.59
  • Prev Close: 104.07
  • % chg. over the last day: +0.47%

The dollar-yen currency pair surprised with quick movements after a long stagnation in a sideways range.In the face of declining stock market quotes, it becomes clear that the pair has lost the correlation with risky assets, and any movement is based only on the dollar.

Trading recommendations
  • Support levels: 103.56, 103.32
  • Resistance levels: 104.40, 104.76

The main scenario is buying on a decline. The ADX showed high upside potential while moving up, but has already reached the overbought zone. This indicates that a pullback from the resistance level, where the price stopped, to the moving averages around 103.90 is possible. Then growth is expected to resume.

The alternative scenario suggests the price fixing below 103.90. In this case, the pair may return to the previous trading range.

USD/JPY
News feed for 2021.01.28:
  • – The US GDP (Q/Q) (Q4) at 15:30 (GMT+2);
  • – US Initial Jobless Claims at 15:30 (GMT+2).

The USD/CAD currency pair

Technical indicators of the currency pair:
  • Prev Open: 1.2690
  • Prev Close: 1.2800
  • % chg. over the last day: +0.86%

On Wednesday, the pair showed a strong upward movement, while the Canadian dollar demonstrated the largest gains against the US dollar. The price has broken through the first resistance level and is preparing to hazard the second one. On the daily chart, the price consolidated above the SMA 50, which indicated the likely development of a deep upward correction.

Trading recommendations
  • Support levels: 1.2686, 1.2624
  • Resistance levels: 1.2834, 1.2875

The main scenario is buying. The ADX is showing growth, and the oscillator is still far from the overbought level. This indicates the likelihood of a further upward movement without a rollback of about 40-60 points.

The alternative scenario: if the price can gain a foothold below 1.2748, the pair may return to 1.2686.

USD/CAD
News feed for 2021.01.28:
  • – The US GDP (Q/Q) (Q4) at 15:30 (GMT+2).

by JustForex


This article reflects a personal opinion and should not be interpreted as an investment advice, and/or offer, and/or a persistent request for carrying out financial transactions, and/or a guarantee, and/or a forecast of future events.

The dollar is growing, the stock market is decreasing after the Fed meeting and negative reports from the tech sector

by JustForex

After continued growth, the world stock indices moved to a sharp decline amid many negative factors related to large business income, economic assessments, trends over the epidemic, and a decrease in retail trade in the United States. The dollar, currently holding the position of a safe-haven currency, resumed its correctional growth.

Nasdaq 100 futures fell after disappointing reports from giants such as Apple Inc. and Tesla Inc. Hong Kong and Australia stocks were the fastest to fall in Asia. European futures contracts opened tradings with the decline too.

On Wednesday, the S&P 500 declined by 2.6% after the Fed left its benchmark interest rate unchanged and made it plain that the central bank wasn’t going to cut its bond buybacks. At the same time, no increase in volume is expected, despite the slowdown in economic recovery. Against this background, 10-year Treasury bonds broke through the round 1.00% level from top to bottom.

Equity markets remain vulnerable amid progressive “bubble” discussions and slow vaccination rates. Amid the raging pandemic, the European Union was unable to resolve the dispute with AstraZeneca over vaccine supplies, which increased the risk of additional delays in vaccination of the block’s population. Wall Street is expecting a significant pullback, but only within the framework of the correction, since, in their opinion, there is no reason for panic now, and long-term fundamentals are promoting growth.

Today, the market will assess how the US economy closed 2020. The fourth-quarter GDP report, which will be released today, is the first preliminary estimate and could cause high volatility across the entire market spectrum.

Main market quotes:

S&P 500 (F) 3,728.62 -15,63 (-0,42%)

Dow Jones 30,303.17 -633,87 (-2,05%)

DAX 13,451.20 -169,26 (-1,24%)

FTSE 100 6.501,75 -65,62 (-1,00%)

USD Index 90,707 +0,067 (+0,07%)

Important events:
  • – The US GDP (Q/Q) (Q4) at 15:30 (GMT+2);
  • – US Initial Jobless Claims at 15:30 (GMT+2).

by JustForex


This article reflects a personal opinion and should not be interpreted as an investment advice, and/or offer, and/or a persistent request for carrying out financial transactions, and/or a guarantee, and/or a forecast of future events.

USDCAD 5-Wave Impulse To Complete Triple Zigzag

By Orbex

usdcad elliott

The USDCAD currency pair forms a primary wave Ⓩ which is part of a global triple zigzag.

The bearish wave Ⓩ takes the form of an intermediate (A)-(B)-(C) zigzag, with the final impulse wave (C) under development.

Minor corrective wave 4, which has taken the form of a skewed triangle, has ended.

In the short term, we expect USDCAD to devalue in wave 5 to the 1.245 area. At that level, it will be at the 61.8% Fibonacci extension of minor impulse 3.

usdcad

An alternative scenario shows that the minor correction wave 4 is still under construction.

The fifth-minute wave of the bearish impulse 3, which took the form of an ending diagonal, has completed.

In the near future, we could see the completion of correction wave ⓑ, after which an increase in the impulse ⓒ to the 1.281 area is possible. At that level, minor wave 4 will be at 38.2% of impulse 3.

Then we expect a bearish impulse decline in wave 5, as shown in the chart.

By Orbex