Archive for Forex and Currency News – Page 315

The Analytical Overview of the Main Currency Pairs on 2021.02.03

by JustForex

The EUR/USD currency pair

Technical indicators of the currency pair:
  • Prev Open: 1.2060
  • Prev Close: 1.2042
  • % chg. over the last day: -0.15%.

The EUR/USD closed trading on Tuesday below the level of 1.2059. It is a signal for a further decline in the medium term. On the daily chart, there is a slight increase in the ADX on the decline, while the MACD has consolidated below zero. These are all factors that may mean a mid-term reversal.

Trading recommendations
  • Support levels: 1.1799
  • Resistance levels: 1.2059

The main scenario for trading the EUR/USD is selling. The former support at 1.2059 became a resistance level for the pair, as price fixation above it would mean a return to the previous range. The reaction of the ADX to the decline turned out to be rather weak, which indicated a slow decline or the likelihood of a stop. The MACD shows convergence, which serves as a strong signal for further decline.

Alternative scenario: if the price consolidates above the level of 1.2059, the pair may return to the previous range of 1.2059 – 1.2155.

EUR/USD
News feed for 2021.02.03:
  • – The ECB’s monetary policy statement at 10:00 (GMT+2);
  • – The Euro-zone Services Purchasing Managers’ Index (PMI) (Jan) at 11:00 (GMT+2);
  • – Eurozone Consumer Price Index (CPI) (y/y) (Jan) at 12:00 (GMT+2);
  • – The ADP Nonfarm Employment Change (Jan) at 15:15 (GMT+2);
  • – The ISM Non-Manufacturing Purchasing Managers’ Index (PMI) in the US (Jan) at 17:00 (GMT+2).

The GBP/USD currency pair

Technical indicators of the currency pair:
  • Prev Open: 1.3659
  • Prev Close: 1.3664
  • % chg. over the last day: +0.04%

The British pound continued to resist the onslaught of bears and managed to close the day in positive territory, despite the rise in the dollar index. The Gilts’ yield has increased by almost 100 basis points over the week, which provides significant support to the sterling.

Trading recommendations
  • Support levels: 1.3622, 1.3517
  • Resistance levels: 1.3744, 1.4386

The main scenario for the GBP/USD pair is trading sideways between 1.3622 and 1.3744. The pair is trading strictly from support to resistance level. Movements within the day remain chaotic. The MACD returned to the zero level. The ADX is more responsive to short-term growth, which indicates the likelihood of a return to the resistance level within the day.

Alternative scenario: if the pair consolidates above 1.3744, it is likely to resume growth to 1.3800. A breakthrough at the 1.3622 level could trigger a further fall towards 1.3517.

GBP/USD
News feed for 2021.02.03:
  • – The UK Services Purchasing Managers’ Index (PMI) (Jan) at 11:30 (GMT+2).

The USD/JPY currency pair

Technical indicators of the currency pair:
  • Prev Open: 104.91
  • Prev Close: 104.96
  • % chg. over the last day: +0.04%

The dollar-yen pair is slowing down the growth but remains in a confident north direction. The indicators on the daily chart surge upwards steeply and are still far from the overbought area. Although the H4 is already signaling the need for a rollback or a short-term stop.

Trading recommendations
  • Support levels: 104.82, 104.40
  • Resistance levels: 105.68, 106.12

The main scenario is buying on a decline. The ADX shows no upside potential, dropping to zero. The MACD has also returned to zero. Given the position on the H4 time frame, there is a possibility of a rollback to support levels. Although buying on a decline looks less risky.

An alternative scenario assumes the price-fixing below 104.40. In this case, the pair may return to the previous trading range of 104.40 – 103.56.

USD/JPY
News feed for 2021.02.03:
  • – The ADP Nonfarm Employment Change (Jan) at 15:15 (GMT+2);
  • – The ISM Non-Manufacturing Purchasing Managers’ Index (PMI) in the US (Jan) at 17:00 (GMT+2).

The USD/CAD currency pair

Technical indicators of the currency pair:
  • Prev Open: 1.2859
  • Prev Close: 1.2777
  • % chg. over the last day: -0.64%

On Tuesday, the Canadian dollar was the strongest currency against the US dollar. Oil prices continued to rise, which put significant pressure on the USD/CAD pair. The Brent quotes reached $57.8 per barrel. WTI was able to rise just above $55.

Trading recommendations
  • Support levels: 1.2737, 1.2686
  • Resistance levels: 1.2875, 1.2932

The main scenario is selling to the 1.2737 support level. The MACD continues to signal that the support level has been reached. The ADX has largely reacted to the decline, which confirms the short-term downtrend scenario.

Alternative scenario: if the price gains a foothold above 1.2813, it may resume growth to the resistance level of 1.2875.

USD/CAD
News feed for 2021.02.03:
  • – The ADP Nonfarm Employment Change (Jan) at 15:15 (GMT+2);
  • – The ISM Non-Manufacturing Purchasing Managers’ Index (PMI) in the US (Jan) at 17:00 (GMT+2);
  • – The US crude oil reserves at 17:30 (GMT+2).

by JustForex


This article reflects a personal opinion and should not be interpreted as an investment advice, and/or offer, and/or a persistent request for carrying out financial transactions, and/or a guarantee, and/or a forecast of future events.


The stock market has returned to gains and the dollar index is preparing to break out of a steep dive

by JustForex

On Tuesday, the national institutes of statistics released data on economic growth in European countries. Despite the negative values, economists point to the resilience of GDP, as the expected numbers are much worse than those received.

Gross domestic product in the Eurozone decreased by 0.7% in the fourth quarter, when the median forecast was 0.9%. Production decreased by 6.8% on an annualized basis. The economy is managing to avoid a recession on the scale that was expected at the beginning of the pandemic. However, the immediate outlook remains challenging due to problems with vaccination initiation, which means the restrictions will last longer. Against this background, the dollar continued to rise, exceeding the January highs.

German Health Minister Jens Spahn warned of “tough weeks of shortages in the first quarter and April.” And while the infection rate in the country is declining, it is still nearly double the level that would ease restrictions according to the government. Against this backdrop, economists still expect another decrease in production in q1, but less than 4%, which was predicted in early January.

Amid problems with the supply of vaccine from AstraZeneca, as well as doubts in France about the effectiveness of the vaccine for elderly patients, European leaders began to look for alternatives. On Tuesday, German Chancellor Angela Merkel said that she will consider Russia’s Sputnik V vaccine as she, like other European countries, seeks to strengthen its vaccination program.

This decision, combined with economic indicators and rising oil prices, returned the stock market to the highs of the year. The S&P 500 rose sharply to 3.835. US Treasury yields rose to 1.11%, German Bonds returned to January highs of – 0.460%.

Main market quotes:

S&P 500 (F) 3,836.12 +17.82 (+0.47%)

Dow Jones 30,687.48 +475.57 (+1.57%)

DAX 13,944.75 +109.59 (+0.79%)

FTSE 100 6,560.09 +43.44 (+0.67%)

USD Index 91.067 +0.042 (+0.05%)

Important events:
  • – Employment Change in Australia (q/q) (q4) at 00:45 (GMT+2);
  • – ECB Monetary Policy Statement at 10:00 (GMT+2);
  • – Eurozone Services PMI (Jan) at 11:00 (GMT+2);
  • – UK Services PMI (Jan) at 11:30 (GMT+2);
  • – Eurozone CPI (YoY) (Jan) at 12:00 (GMT+2);
  • – ADP United States Nonfarm Employment Change (Jan) at 15:15 (GMT+2);
  • – ISM Non-Manufacturing PMI (Jan) at 17:00 (GMT+2);
  • – US crude oil stocks at 17:30 (GMT+2).

by JustForex


This article reflects a personal opinion and should not be interpreted as an investment advice, and/or offer, and/or a persistent request for carrying out financial transactions, and/or a guarantee, and/or a forecast of future events.
Japanese Candlesticks Analysis 02.02.2021 (USDCAD, AUDUSD, USDCHF)

Article By RoboForex.com

USDCAD, “US Dollar vs Canadian Dollar”

As we can see in the H4 chart, the ascending tendency continues. Right now, after forming an Engulfing reversal pattern not far from the support level, USDCAD may reverse in the form of another rising wave towards 1.2910. Later, the asset may continue growing. However, an alternative scenario implies a further pullback towards 1.2750 before the asset resumes growing.

USDCAD
Risk Warning: the result of previous trading operations do not guarantee the same results in the future

AUDUSD, “Australian Dollar vs US Dollar”

As we can see in the H4 chart, AUDUSD is still forming the descending impulse. Right now, after forming several reversal patterns, such as Hammer, not far from the support area, the pair may reverse and resume growing to reach the resistance area at 0.7690. At the same time, an opposite scenario says that the price may fall to return to 0.7580 without testing the resistance area.

AUDUSD
Risk Warning: the result of previous trading operations do not guarantee the same results in the future

USDCHF, “US Dollar vs Swiss Franc”

As we can see in the H4 chart, the uptrend continues. At the moment, after forming several reversal patterns, such as Hanging Man, not far from the resistance area, USDCHF is correcting. Later, the asset may complete the correction and resume the ascending tendency. The correctional target may be the support area at 0.8880. Still, there might be an alternative scenario, according to which the asset may start a new growth towards 0.9000 without falling and testing the support area.

USDCHF

Article By RoboForex.com

Attention!
Forecasts presented in this section only reflect the author’s private opinion and should not be considered as guidance for trading. RoboForex LP bears no responsibility for trading results based on trading recommendations described in these analytical reviews.

Forex Technical Analysis & Forecast 02.02.2021

Article By RoboForex.com

EURUSD, “Euro vs US Dollar”

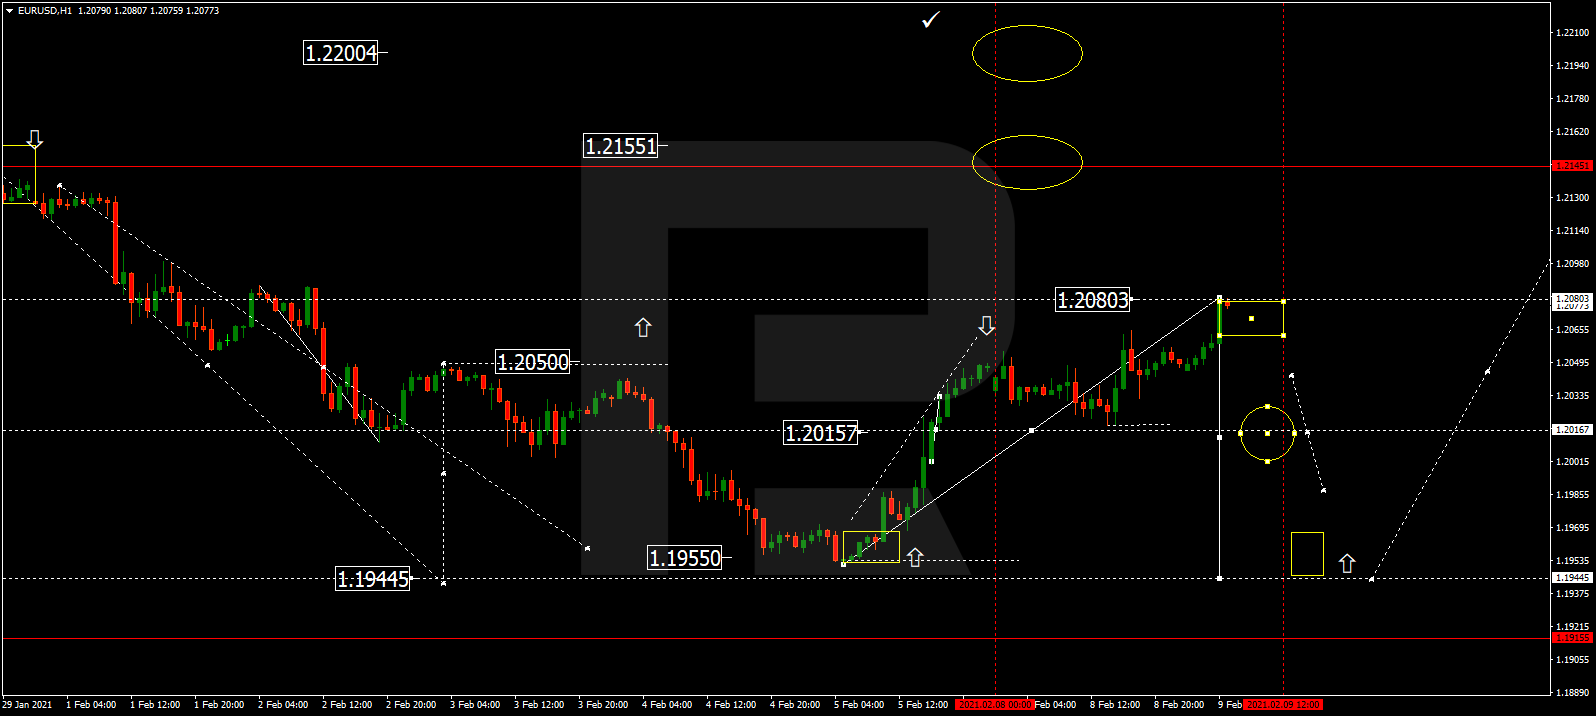
After breaking 1.2093 to the downside, EURUSD is falling towards 1.2040. Possibly, today the pair may reach this level and then form a new consolidation range there. Later, the market may break the range to the upside and start a new growth with the target at 1.2200.

EURUSD
Risk Warning: the result of previous trading operations do not guarantee the same results in the future

GBPUSD, “Great Britain Pound vs US Dollar”

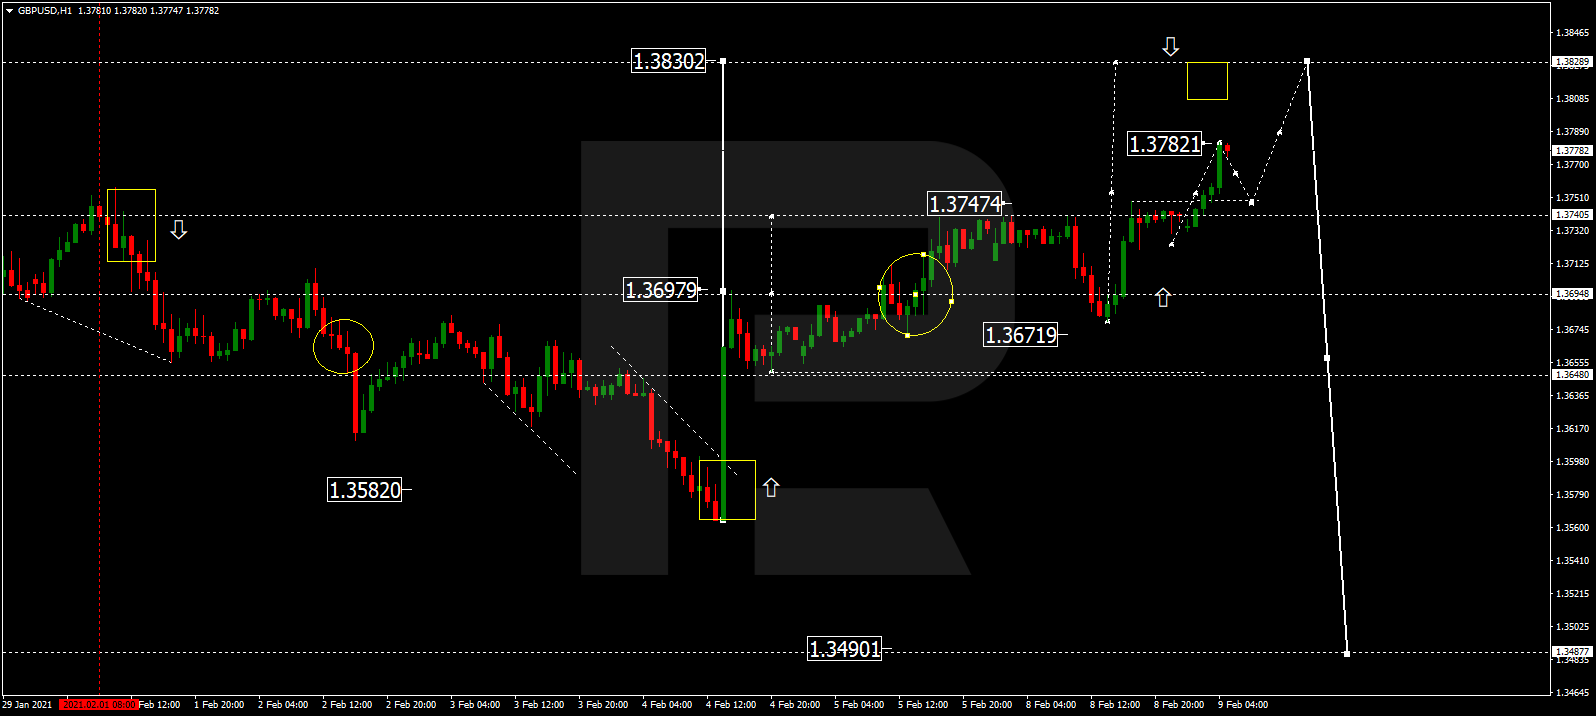
After finishing the ascending structure at 1.3750 along with the correction towards 1.3674, GBPUSD is consolidating around the latter level. Today, the pair may break this range to the downside and resume trading downwards with the target at 1.3587.

GBPUSD
Risk Warning: the result of previous trading operations do not guarantee the same results in the future

USDRUB, “US Dollar vs Russian Ruble”

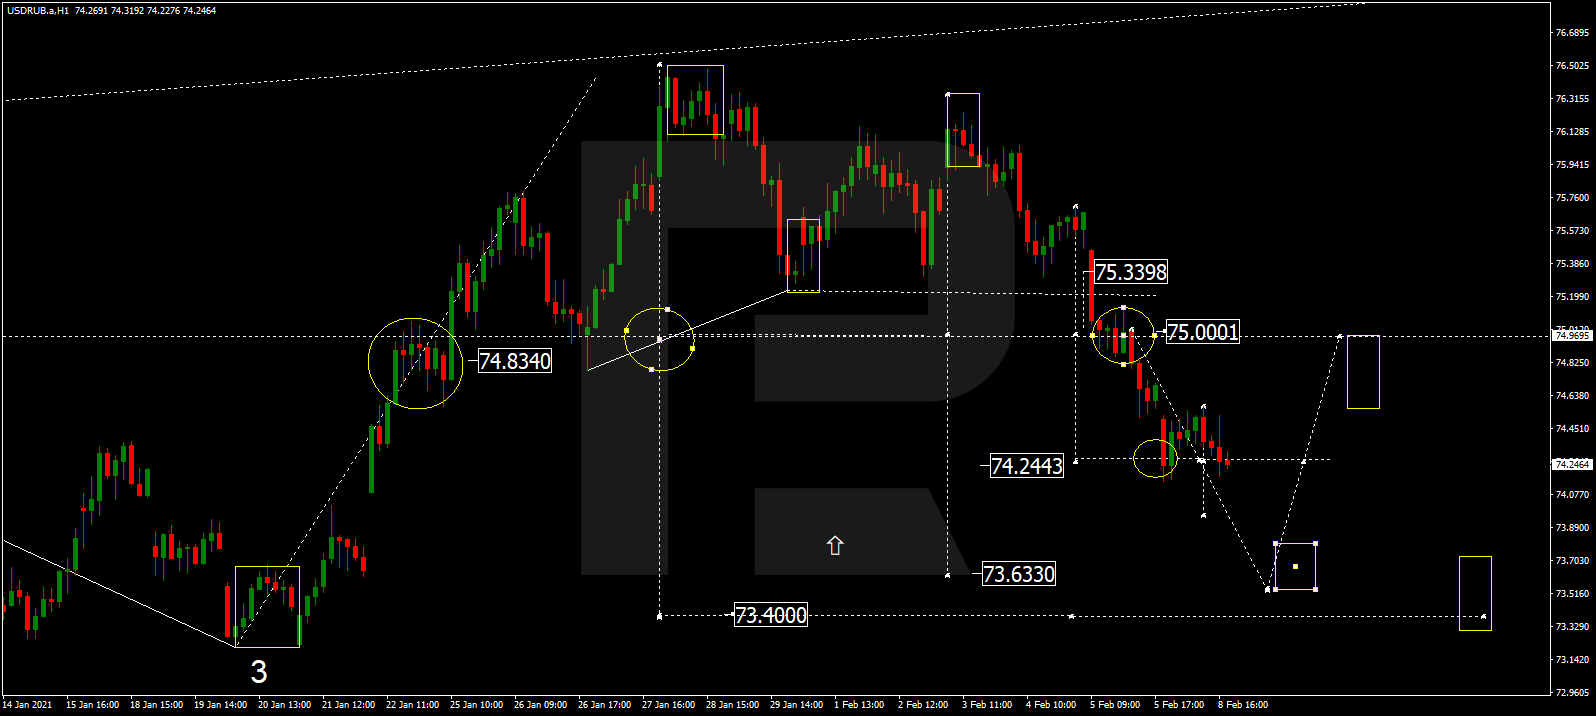
After completing the ascending correction at 76.00, USDRUB is falling towards 75.03. Later, the market may break the latter level and continue trading downwards with the short-term target at 73.95.

USDRUB
Risk Warning: the result of previous trading operations do not guarantee the same results in the future

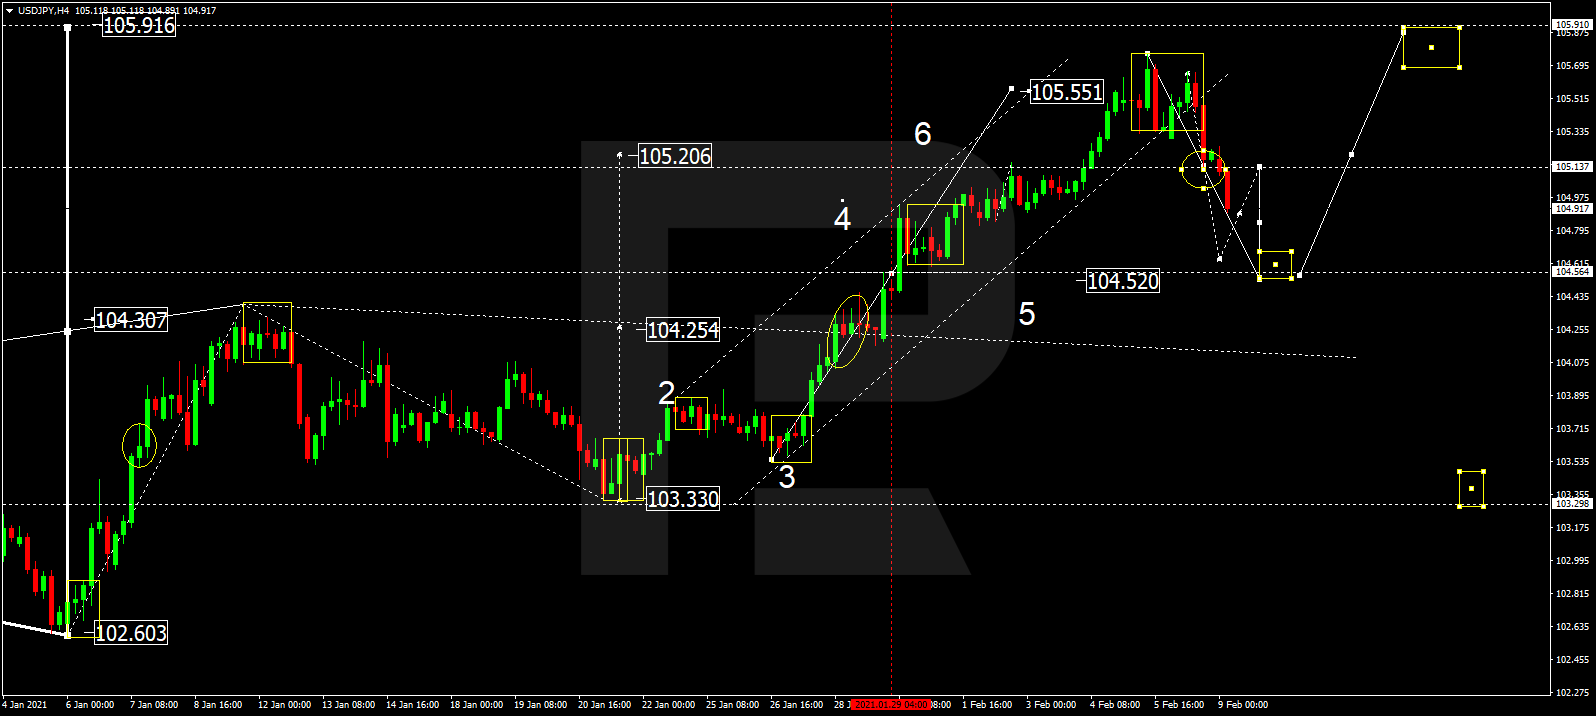
USDJPY, “US Dollar vs Japanese Yen”

USDJPY has reached the short-term upside target at 104.88; right now, it is consolidating around this level. Possibly, the pair may expand the range up to 105.05 and then start another correction towards 104.30. After that, the instrument may form one more ascending structure with the target at 105.20.

USDJPY
Risk Warning: the result of previous trading operations do not guarantee the same results in the future

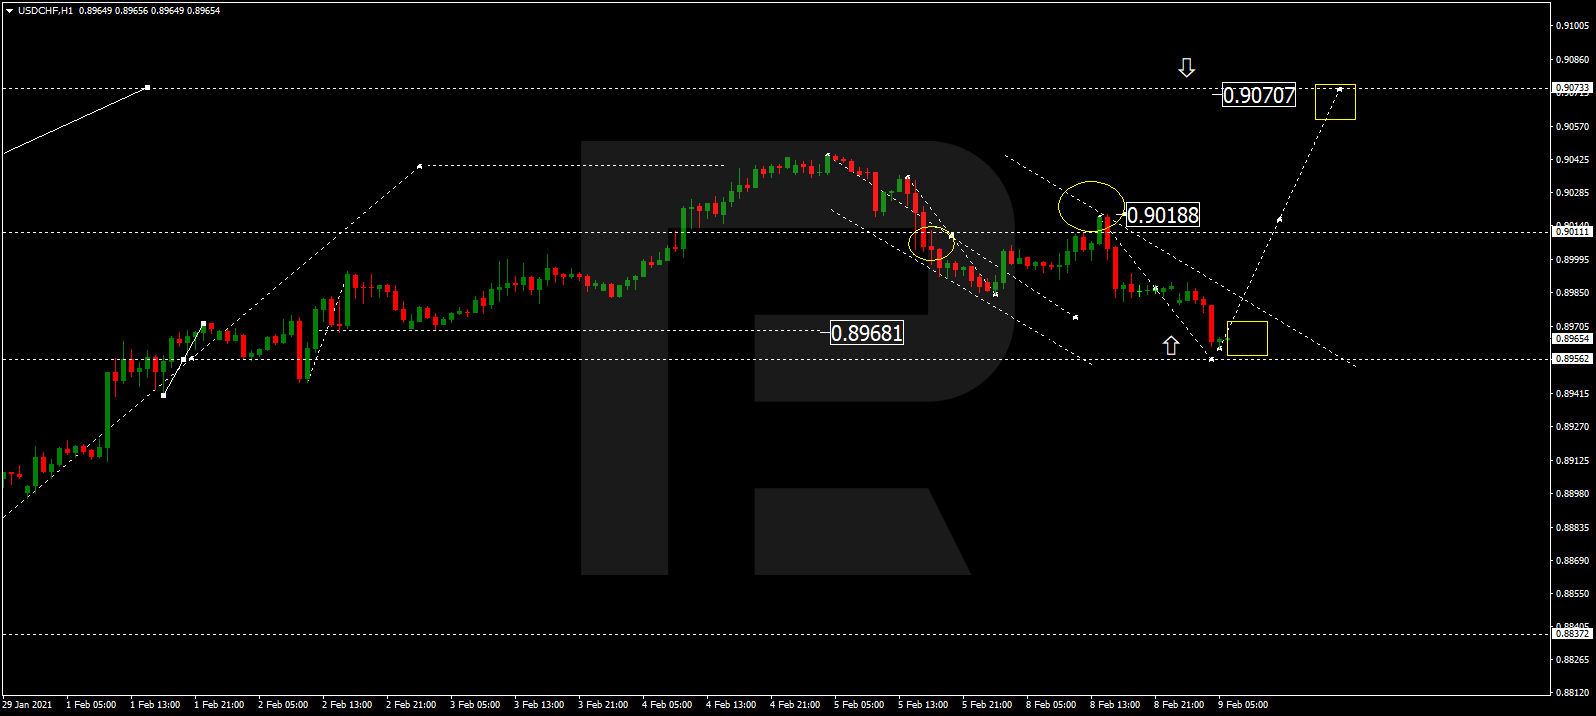
USDCHF, “US Dollar vs Swiss Franc”

After completing the ascending wave at 0.8920 and then forming a new consolidation range around this level, USDCHF has broken it to the upside to reach 0.8971. Today, the pair may start a new correction to return to 0.8920 and then resume trading upwards with the target at 0.9000.

USDCHF
Risk Warning: the result of previous trading operations do not guarantee the same results in the future

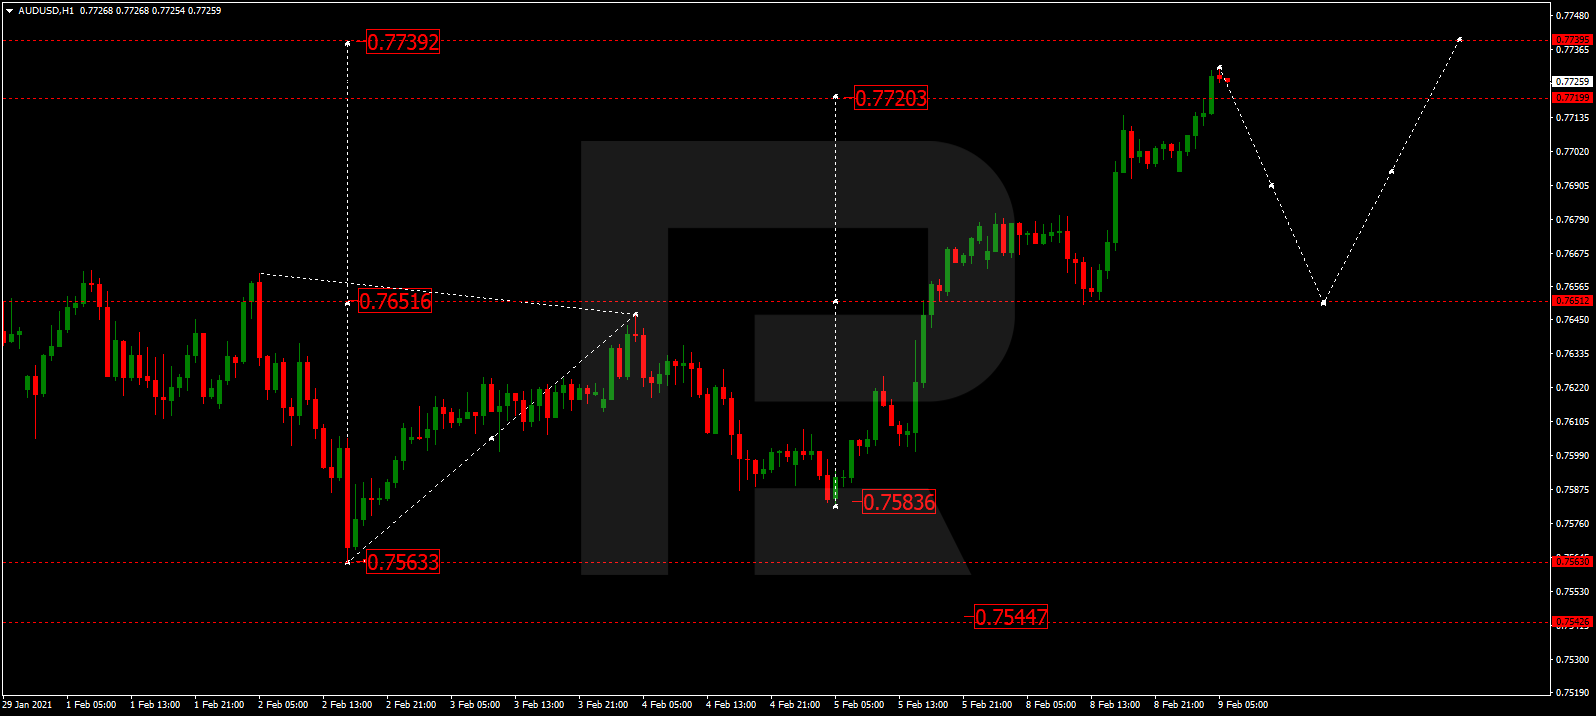
AUDUSD, “Australian Dollar vs US Dollar”

AUDUSD is still consolidating around 0.7625 without any particular direction. Possibly, the pair may trade downwards to reach 0.7550 and then start another growth with the target at 0.7700.

AUDUSD
Risk Warning: the result of previous trading operations do not guarantee the same results in the future

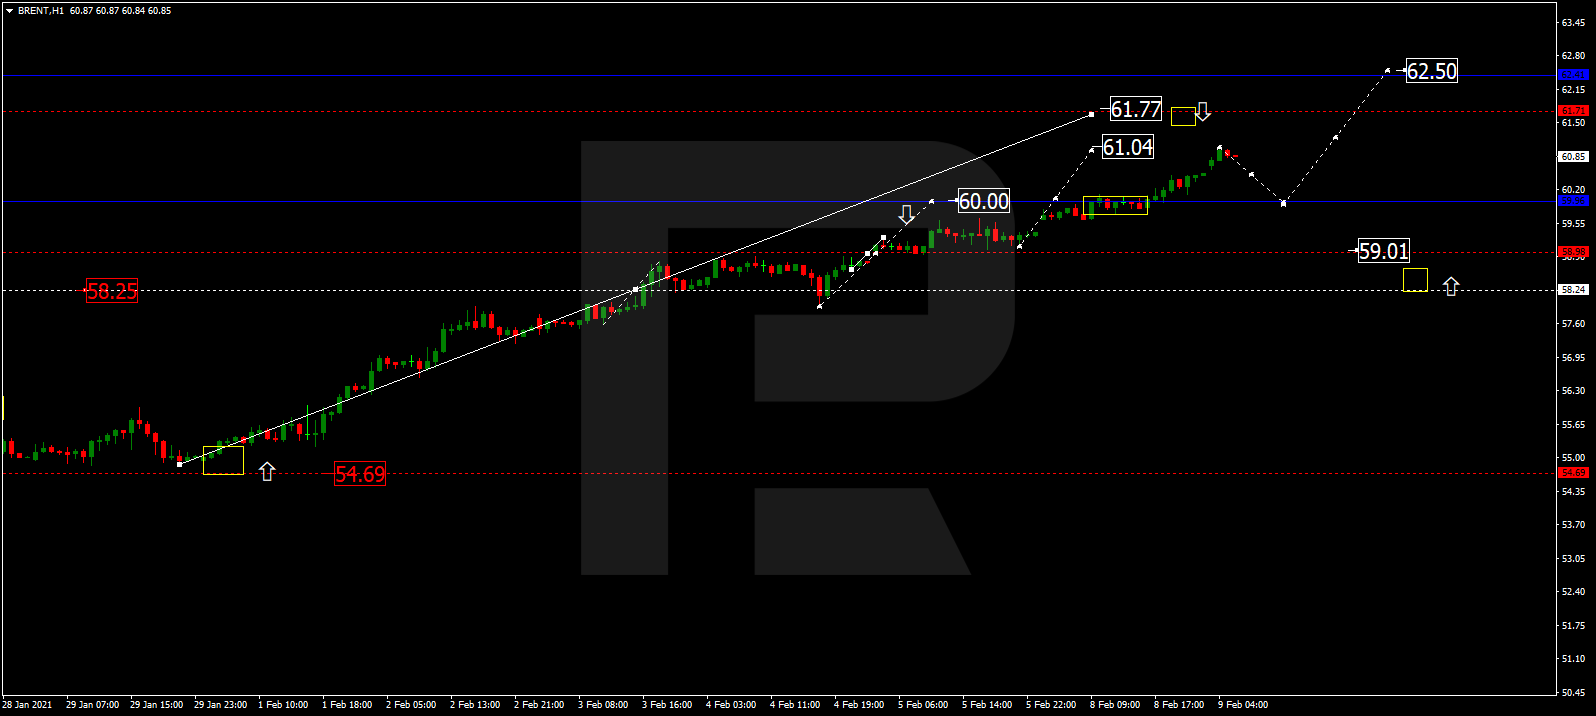
BRENT

After completing the ascending structure at 56.30 and breaking it to the upside, Brent is still growing with the target at 57.90. Possibly, today the asset may reach 57.47 and then correct to test 56.30 from above. After that, the instrument may form one more ascending structure towards the above-mentioned target.

BRENT
Risk Warning: the result of previous trading operations do not guarantee the same results in the future

XAUUSD, “Gold vs US Dollar”

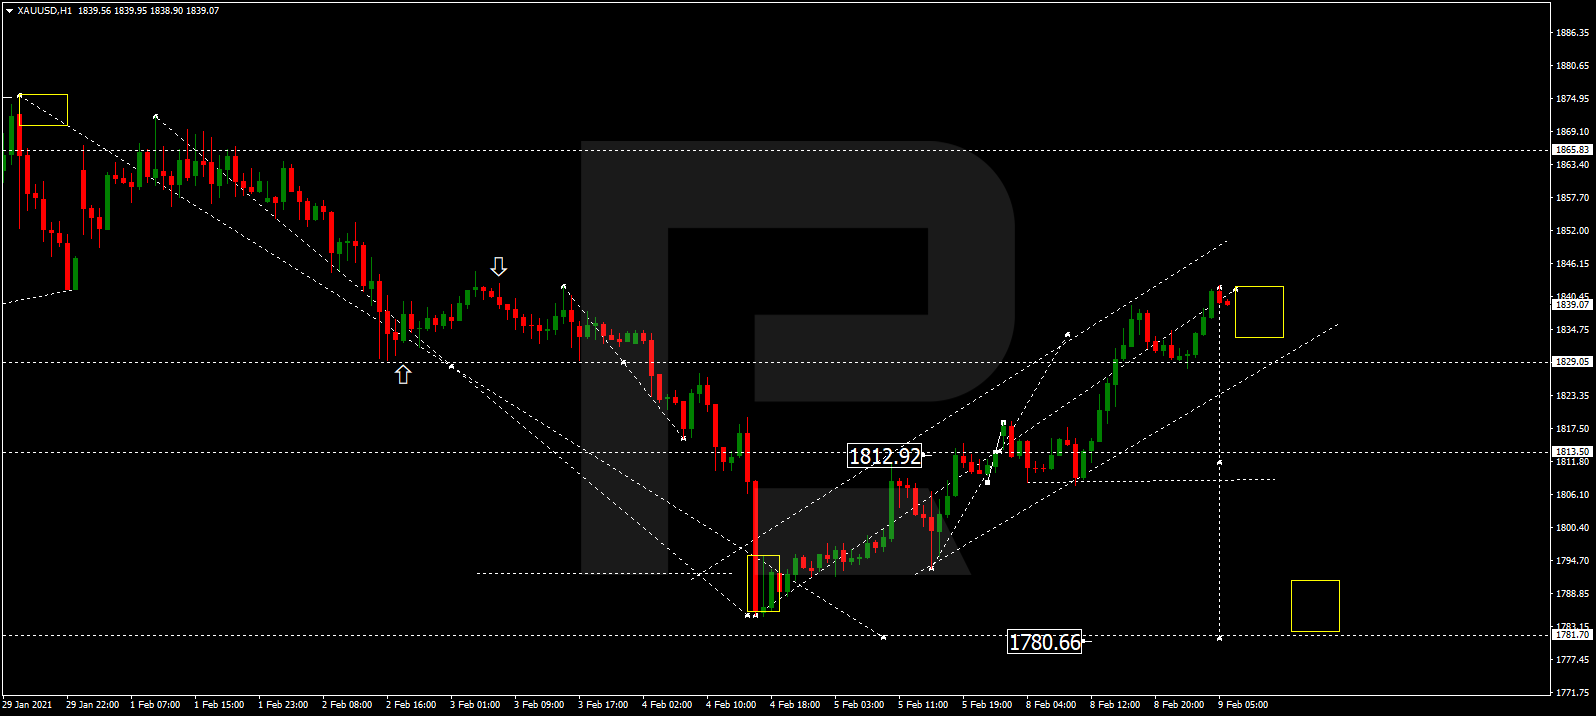
Gold is still consolidating around 1851.30 without any particular direction. Possibly, the metal may break the range to the downside and resume trading downwards with the target at 1827.00. Later, the market may form one more ascending structure to reach 1851.40.

GOLD
Risk Warning: the result of previous trading operations do not guarantee the same results in the future

BTCUSD, “Bitcoin vs US Dollar”

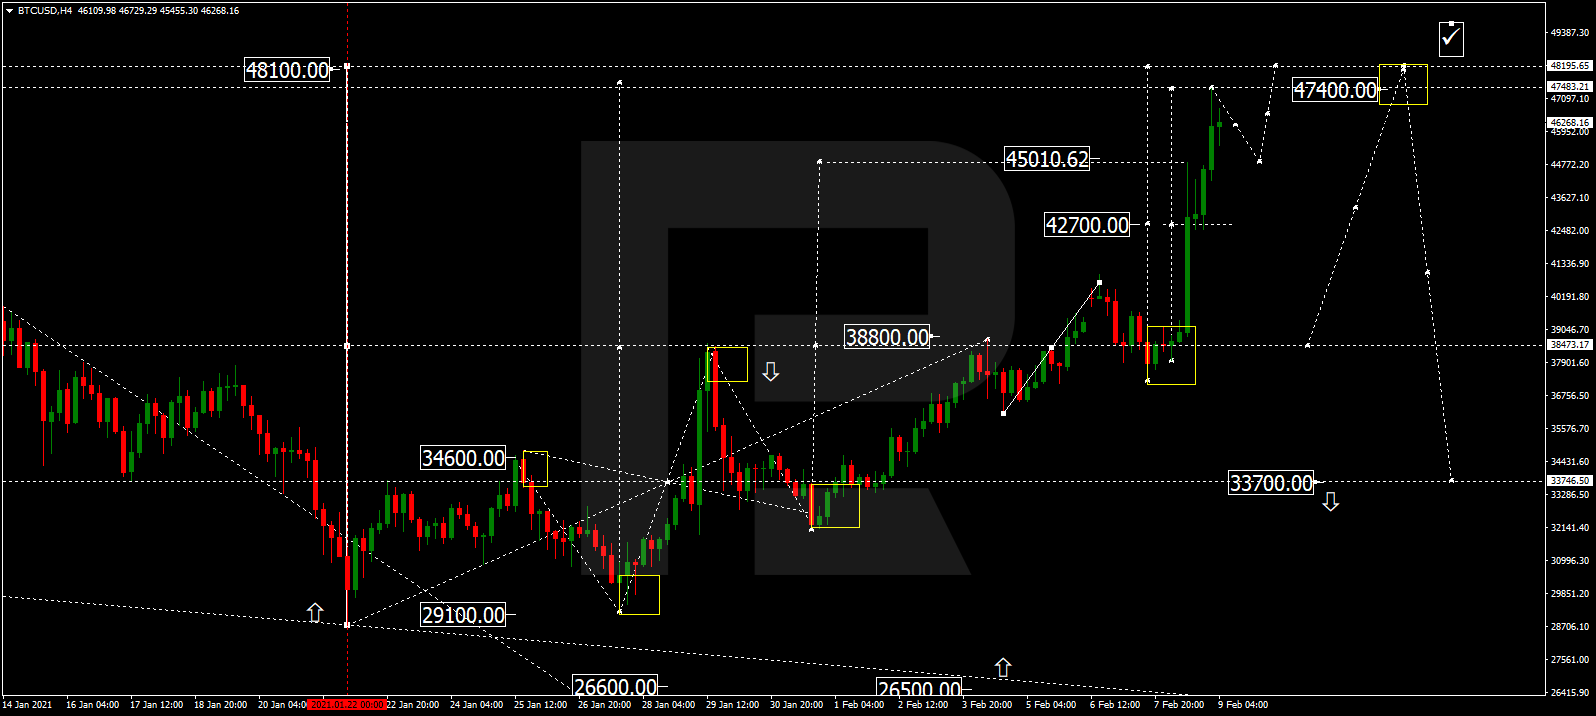
BTCUSD is still consolidating around 34000.00, Later, the market may break this range to the downside to reach 26600.00 and then resume growing with the target at 40400.00.

BITCOIN
Risk Warning: the result of previous trading operations do not guarantee the same results in the future

S&P 500

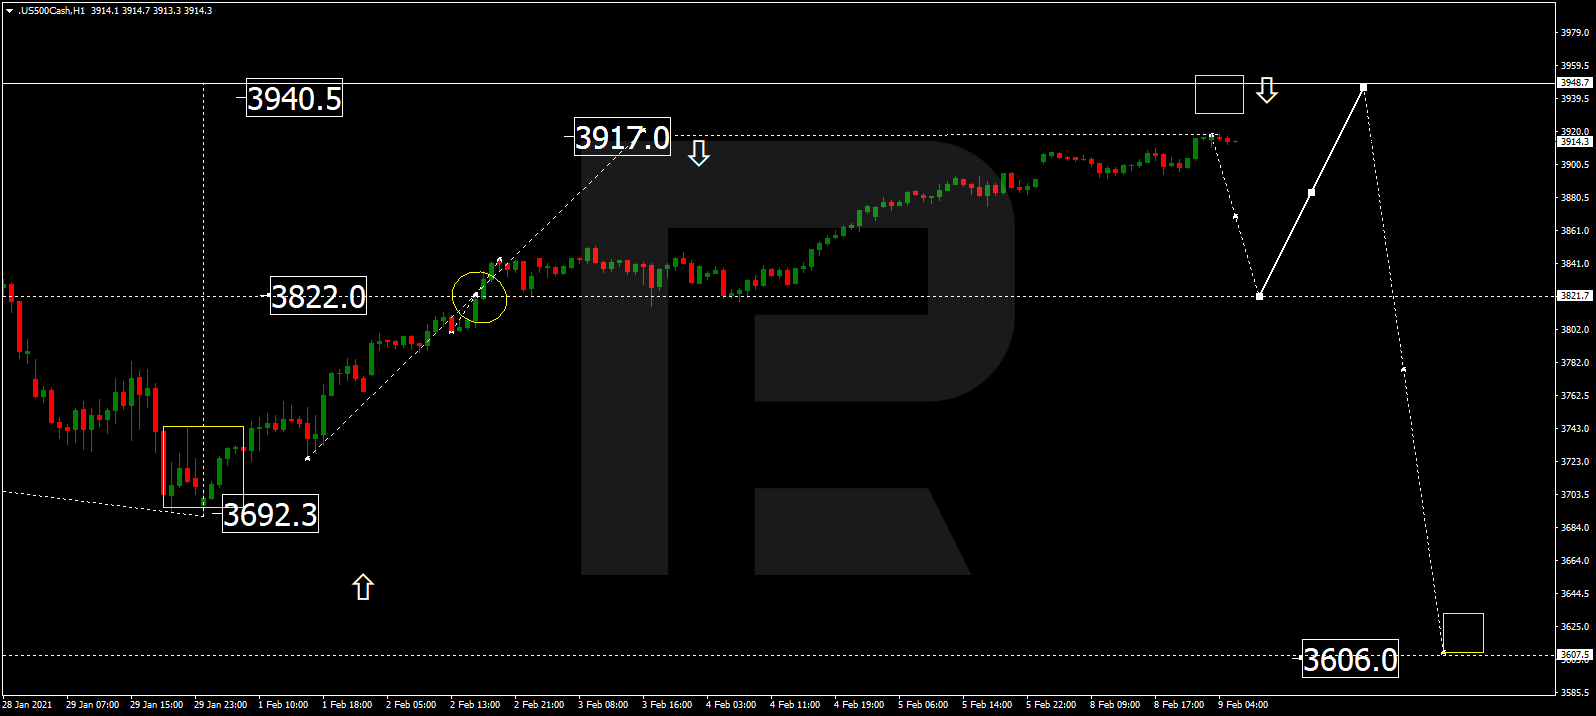
The S&P index is consolidating around 3734.1. Possibly, the asset may expand the range up to 3832.0. After that, the instrument may start a new decline to break 3700.0 and then continue falling with the target at 3567.4.

S&P 500

Article By RoboForex.com

Attention!
Forecasts presented in this section only reflect the author’s private opinion and should not be considered as guidance for trading. RoboForex LP bears no responsibility for trading results based on trading recommendations described in these analytical reviews.

The Analytical Overview of the Main Currency Pairs on 2021.02.02

by JustForex

The EUR/USD currency pair

Technical indicators of the currency pair:
  • Prev Open: 1.2130
  • Prev Close: 1.2059
  • % chg. over the last day: -0.59%.

The EUR/USD closed Monday trading at the key support level of 1.2059. On the daily chart, there was a consolidation below the SMA50. Other technical indicators are close to zero. The final PMI indices for the Eurozone, which turned out to be higher than in the preliminary calculation, kept the pair from falling further. Although the pair remains under pressure, as the American similar data shows more steady growth.

Trading recommendations
  • Support levels: 1.2059, 1.1799
  • Resistance levels: 1.2189, 1.2222, 1.2283

The main scenario for trading the EUR/USD is selling. It is necessary to continue monitoring the 1.2059 level. In case of another rebound, the likelihood of a southern correction will again be called into question. The MACD showed no convergence after Monday’s fall. The ADX showed weak dynamics. The price decline is expected to be slow, and sales will be relevant as long as the pair is below the moving averages.

Alternative scenario: if the price can gain a foothold above the level of 1.2110, the pair may move to an increase to 1.2222.

EUR/USD
News feed for 2021.02.02:
  • – The GDP of Eurozone (q/q) (4q) at 12:00 (GMT+2).

The GBP/USD currency pair

Technical indicators of the currency pair:
  • Prev Open: 1.3700
  • Prev Close: 1.3658
  • % chg. over the last day: -0.31%

The British pound showed a decline against the US dollar by almost half that of the euro. The southern correction of this instrument is still in question. The pair failed to break the key resistance level and Monday’s daily candle showed bearish engulfing with a long shadow at the top. However, the rest of the technical characteristics are still on the side of the bulls.

Trading recommendations
  • Support levels: 1.3622, 1.3517
  • Resistance levels: 1.3744, 1.4386

The main scenario for the GBP/USD is trading sideways between 1.3622 and 1.3744. The pair is trading strictly from support to resistance level. Movements within the day remain chaotic. The MACD is giving slight signs of a further decline towards the support level. If the decline occurs without a strong upward pullback, it will lead to convergence, which will serve as a stronger signal for the bears. The ADX is close to zero.

Alternative scenario: if the pair consolidates above the 1.3744 level, it is likely to resume growth to 1.3800. A breakthrough at 1.3622 could trigger a further fall towards 1.3517.

GBP/USD
There is no news feed for today.

The USD/JPY currency pair

Technical indicators of the currency pair:
  • Prev Open: 104.77
  • Prev Close: 104.92
  • % chg. over the last day: +0.14%

The dollar-yen pair has slowed down a little but remained in a north direction. The indicators on the daily chart show strong bullish potential. The manufacturing sector in the US remains strong, which supports the growth of quotations.

Trading recommendations
  • Support levels: 104.40, 103.56
  • Resistance levels: 104.94, 105.68

The main scenario is buying on a decline. The ADX shows a decline in upside potential and the pair has stopped near the October 26 highs. A divergence has been formed on the MACD, which indicates the likelihood of a corrective pullback to 104.48.

An alternative scenario assumes the price-fixing below 104.48 level. In this case, the pair may return to the previous trading range of 104.40 – 103.56.

USD/JPY
There is no news feed for today.

The USD/CAD currency pair

Technical indicators of the currency pair:
  • Prev Open: 1.2784
  • Prev Close: 1.2852
  • % chg. over the last day: +0.53%

On Monday, the USD/CAD bounced back from all of its Friday losses. At the same time, the oil market continued to grow, which created pressure on the pair. The fundamental background for the pair turns out to be mixed, which indicates the continuation of trading in the sideways range.

Trading recommendations
  • Support levels: 1.2737, 1.2686
  • Resistance levels: 1.2875, 1.2932

The main scenario is trading in a sideways range between 1.2805 and 1.2875. A divergence has been formed on the MACD, which signals the likelihood of a correction. This is also indicated by the formed “double top” pattern. But the ADX is at low levels and the price is above the moving averages. The overall signal is neutral.

Alternative scenario: if the price consolidates above 1.2875, the pair may resume its growth. Fixation below 1.2805 will indicate a decline with the first target at the 1.2737 level.

USD/CAD
There is no news feed for today.

by JustForex


This article reflects a personal opinion and should not be interpreted as an investment advice, and/or offer, and/or a persistent request for carrying out financial transactions, and/or a guarantee, and/or a forecast of future events.

USDTRY Continues The Plunge

By Orbex

usdtry

USDTRY has witnessed a dramatic fall from record highs at the back end of 2020. Sinking to a 6-month low, prices now test the lower $7 region with momentum firmly resting to the downside.

Prices attempted to test the long-term resistance trendline recently, however could not puncture the level which is also a strong confluence of the Ichimoku cloud.

The price test at the cloud’s downside border indicates a descending tendency, which has negated the recent bullish divergence.

We now look towards targets below the $7 psychological level as bears confirm their stance.

usdtry

An intraday look shows that prices are firmly trading in a descending channel. With prices trading far away from the Ichimoku cloud, further downside is expected.

However, should price once again bounce off the lower channel, it could be a slight indication that in the near-term, the trend could be halted.

The recent bullish divergence could emphasize a turnaroun

By Orbex

The US manufacturing sector is showing robust growth, supporting the rise of the dollar

by JustForex

At the beginning of the year, the US output growth remained robust. The Institute for Supply Management’s manufacturing activity indicator fell to 58.7 in January from 60.5 a month earlier, according to data released on Monday. The raw material price index in the sector showed the highest value since April 2011.

The data point to the 8th consecutive month of strong growth in manufacturing activity. The slowdown was observed in new orders (61.1 versus 67.5), manufacturing (60.7 versus 64.7), shipping (68.2 versus 67.7), and new export orders (54.9 versus 59.1). On the other hand, indicators such as employment (52.6 versus 51.7) and order volume (59.7 versus 59.1) grew faster, as did price pressure (82.1 versus 77.6). Manufacturing performed well, with demand and consumption showing significant growth compared to December. “Labor market pressures for the surveyed companies and their suppliers will continue to constrain sector growth until the crisis caused by the pandemic subsides,” the ISM said in a statement.

The growth in the manufacturing employment indicator of the last month is the strongest since June 2019. This is a positive sign ahead of Friday’s January employment report, which is expected to show modest gains, largely supported by manufacturing hires.

In consequence of a good ISM report, the stock market sales have stopped. American Treasuries approached the 1.10% mark. S&P 500 futures added 0.8% with the opening of trading in Europe, following the January highs since yesterday.

Main market quotes:

S&P 500 (F) 3,795.62 +29.92 (+0.79%)

Dow Jones 30,211.91 +229.29 (+0.76%)

DAX 13,786.12 +164.10 (+1.20%)

FTSE 100 6,498.25 +31.83 (+0.49%)

USD Index 90.855 -0.170 (-0.19%)

Important events:
  • – RBA Interest Rate Decision (Jan) at 05:30 (GMT+2);
  • – Eurozone GDP (q/q) (q4) at 12:00 (GMT+2).

by JustForex


This article reflects a personal opinion and should not be interpreted as an investment advice, and/or offer, and/or a persistent request for carrying out financial transactions, and/or a guarantee, and/or a forecast of future events.
CAPEX.com Review – Mobile Trading at Ease

About CAPEX.com

Established in 2016, CAPEX.com is an online trading brand that has successfully developed a method of providing accessible trading resources for a broad audience of CFD traders. With a customer-oriented business philosophy, combined with cutting-edge technology, it is now one of the most respected international brands, also the current Official Trading Partner of Juventus FC.

CAPEX.com is frequently showing commitment to ensuring a safe trading environment for its clients in every corner of the world, and its regulatory compliance serves as proof of that.

CAPEX.com official logo

Key Way Investments Limited, the mother company of CAPEX.com, is authorized and regulated by the Cyprus Securities and Exchange Commission, license number 292/16. On top of that, it has two registered branches in Romania and Spain. CFD traders across Europe benefit from personalized regulatory compliance since CAPEX.com is a trading brand also registered with 26 other regulators.

CAPEX WebTrader User Experience

The CAPEX WebTrader is a trading solution developed by the broker, tailored explicitly for streamline trading capabilities. This platform integrates advanced charting and analytics, with six chart types and over 90 popular indicators to choose from.

It is the right platform for CFD traders wishing to:

  • benefit from intuitive and easy-to-use software
  • manage risk effectively in volatile conditions
  • benefit from multiple 3rdparty features.

On top of the leading industry tool – Trading Central –CAPEX WebTrader includes various integrated tools, bringing together knowledge, skill, and market expertise. Traders can use trademark tools like Insiders’ Hot Stocks, Daily Analyst Ratings, Bloggers’ Opinions, Hedge Funds Activity, and News Sentiment while trading 2,100+ instruments across a broad range of popular asset classes.

CAPEX WebTrader

Ultimately, CAPEX.com aims at and succeeds in making CAPEX WebTrader a solution suited for beginner, intermediate and advanced traders, without having to make compromises about performance, trade execution, and transparency.

Mobile Trading

CAPEX.com is aware that business and trading are done on the spot, and the modern office can be anywhere. This comes with massive implications and a need for more advanced tools. On top of the CAPEX WebTrader solution designed to be used via a browser on a PC or laptop, the broker also offers Android and iOS app solutions.

Mobile trading can be an essential factor for traders because access to fast trade execution, security, and easy account management has become vital requirements in traders. CAPEX.com manages to stay in line with the latest trends and has put a lot of effort into optimizing two apps, promising great specs.

CAPEX.com assets

The CAPEX.com asset coverage stands out in terms of diversity and the number of available instruments, currently including over 2,100 CFDs as follows:

  • more than 55 currency pairs
  • over 26 indices covering the major economies of the world
  • CFDs on EU, USA, and UK bonds
  • more than 30 ETF instruments
  • gold, oil, natural gas, wheat, and many other commodities
  • aselection of 2,000+ shares of popular global companies
  • blends covering stocks & exchange-traded funds
  • CFDs on Bitcoin, Bitcoin Cash, Ethereum, Ripple, and other leading cryptocurrencies

Trading Conditions

In terms of trading conditions, flexibility is the keyword when talking about CAPEX.com. Spreads are fixed or variable, depending on the instrument. The same applies for the maximum leverage, as it depends on the instrument type and the client’s type (retail or professional).

On top of that, trading conditions vary based on the account type chosen by each customer. The offer currently includes Essential, Original, and Signature accounts, each with a series of features designed to facilitate optimal trading conditions.

CAPEX.com offers support via dedicated account representatives and provides 3rd party resources such as Daily Analyst Ratings for all customers.

Educational Tools

In a challenging market environment, retail traders need access to updated information and other resources to make better trading decisions. CAPEX.com is aware of the massive implications of proper education and thus has included multiple benefits in its offer.

CAPEX.com education

Traders can take advantage of the video library, the daily market reviews, open access to research, the Trading Central resources, and the one-on-one meetings with an account representative. On the website, traders have access to market news, an economic calendar, and several other resources for those desiring to learn how to trade.

The Bottom Line

Thanks to its customer-oriented approach, CAPEX.com has developed a modern and efficient trading platform that is flexible enough to meet the challenges of financial market conditions in 2021 and beyond. Traders can trade on mobile devices regardless of location, benefiting from multiple technical analysis tools, educational resources, and a solid pack of 2,100+ CFDs.

Combined with a stable regulatory background and with full transparency, it seems CAPEX.com is keen on being one of the most reliable trading brands in the industry and attracting a growing number of traders.


Risk Warning: CFDs are complex instruments and come with a high risk of losing money rapidly due to leverage. 79.69% of retail investor accounts lose money when trading CFDs with this provider. You should consider whether you understand how CFDs work and whether you can afford to take the high risk of losing your money.

By Taylor Wilman


Ichimoku Cloud Analysis 01.02.2021 (EURUSD, AUDUSD, ETHUSD)

Article By RoboForex.com

EURUSD, “Euro vs US Dollar”

EURUSD is trading at 1.2130; the instrument is moving inside Ichimoku Cloud, thus indicating a sideways tendency. The markets could indicate that the price may test the cloud’s upside border at 1.2145 and then resume moving downwards to reach 1.1995. Another signal in favor of a further downtrend will be a rebound from the upside border of the Triangle pattern. However, the bearish scenario may be canceled if the price breaks the cloud’s upside border and fixes above 1.2160. In this case, the pair may continue growing towards 1.2255. To confirm further decline, the asset must break the support area and fix below 1.2045.

EURUSD
Risk Warning: the result of previous trading operations do not guarantee the same results in the future

AUDUSD, “Australian Dollar vs US Dollar”

AUDUSD is trading at 0.7657; the instrument is moving below Ichimoku Cloud, thus indicating a descending tendency. The markets could indicate that the price may test Tenkan-Sen and Kijun-Sen at 0.7665 and then resume moving downwards to reach 0.7515. Another signal in favor of a further downtrend will be a rebound from the descending channel’s upside border. However, the bearish scenario may no longer be valid if the price breaks the cloud’s upside border and fixes above 0.7760. In this case, the pair may continue growing towards 0.7845. To confirm further decline, the asset must break the descending channel’s downside border and fix below 0.7540.

AUDUSD
Risk Warning: the result of previous trading operations do not guarantee the same results in the future

ETHUSD, “Ethereum vs US Dollar”

ETHUSD is trading at 1326.70; the instrument is moving above Ichimoku Cloud, thus indicating an ascending tendency. The markets could indicate that the price may test the cloud’s upside border at 1290.00 and then resume moving upwards to reach 1570.00. Another signal in favor of a further uptrend is a rebound from the downside border of a Triangle pattern. However, the bullish scenario may no longer be valid if the price breaks the cloud’s downside border and fixes below 1205.00. In this case, the pair may continue falling towards 1065.00. To confirm further growth, the asset must break the pattern’s upside border and fix above 1455.00.

ETHUSD

Article By RoboForex.com

Attention!
Forecasts presented in this section only reflect the author’s private opinion and should not be considered as guidance for trading. RoboForex LP bears no responsibility for trading results based on trading recommendations described in these analytical reviews.

Fibonacci Retracements Analysis 01.02.2021 (GOLD, USDCHF)

Article By RoboForex.com

XAUUSD, “Gold vs US Dollar”

In the H4 chart, a local convergence on MACD made the pair corrected and then started consolidating. This consolidation may warn about a new impulse movement. If the price breaks this consolidation channel to the upside, the asset may form a proper rising wave towards 76.0% fibo at 2000.00. Another scenario implies that the asset may break the channel downwards to reach the low at 1764.36, a breakout of which will lead to a further long-term downtrend towards 38.2% at 1725.37.

GOLD_H4
Risk Warning: the result of previous trading operations do not guarantee the same results in the future

The H1 chart shows a more detailed structure of the consolidation range. At the moment, the price is moving between 23.6% and 38.2% fibo. In the short-term, the asset may continue growing towards 50.0% and 61.8% fibo at 1880.55 and 1899.10 respectively. the local support is the low at 1801.79.

GOLD_H1
Risk Warning: the result of previous trading operations do not guarantee the same results in the future

USDCHF, “US Dollar vs Swiss Franc”

As we can see in the daily chart, after testing the post-correctional extension area between 138.2% and 161.8% fibo at 0.8886 and 0.8816 respectively, USDCHF is forming a new rising wave that may transform into a proper uptrend. In the mid-term, this growth may be heading towards 23.6%, 38.2%, and 50.0% fibo at 0.9106, 0.9322, and 0.9495 respectively.

USDCHF_D1
Risk Warning: the result of previous trading operations do not guarantee the same results in the future

The H1 chart shows a more detailed structure of the correctional trend. The asset is approaching 50.0% fibo at 0.8975 and may later continue growing 61.8% and 76.0% fibo at 0.9026 and 0.9087 respectively. The support is the low at 0.8757.

USDCHF_H1

Article By RoboForex.com

Attention!
Forecasts presented in this section only reflect the author’s private opinion and should not be considered as guidance for trading. RoboForex LP bears no responsibility for trading results based on trading recommendations described in these analytical reviews.