Archive for Forex and Currency News – Page 313

Fibonacci Retracements Analysis 08.02.2021 (GOLD, USDCHF)

Article By RoboForex.com

XAUUSD, “Gold vs US Dollar”

In the H4 chart, after breaking the consolidation range, XAUUSD has updated its previous local low but right now, it is starting a new pullback. A breakout of the range may lead to a further downtrend towards the low at 1764.36 and then the long-term 38.2% fibo at 1725.37.

GOLD_H4
Risk Warning: the result of previous trading operations do not guarantee the same results in the future

The H1 chart shows a new rising correction after the previous descending wave, which is approaching 38.2% fibo at 1819.50. In the short-term, the asset may continue growing towards 50.0% and 61.8% fibo at 1830.20 and 1840.79 respectively. The local support here is the low at 1784.93.

GOLD_H1
Risk Warning: the result of previous trading operations do not guarantee the same results in the future

USDCHF, “US Dollar vs Swiss Franc”

As we can see in the daily chart, USDCHF continues correcting to the upside after a convergence on MACD. At the moment, the pair is approaching 23.6% fibo at 0.9106 and may later continue growing to reach 38.2% and 50.0% fibo at 0.9322 and 0.9495 respectively.

USDCHF_D1
Risk Warning: the result of previous trading operations do not guarantee the same results in the future

In the H1 chart, a divergence on MACD made the pair stop its growth at 61.8% fibo (0.9026) and start a new a local correction to the downside, which may reach the support area at 50.0% fibo (0.8975). After completing the correction, the asset may resume growing towards 76.0% fibo at 0.9087.

USDCHF_H1

Article By RoboForex.com

Attention!
Forecasts presented in this section only reflect the author’s private opinion and should not be considered as guidance for trading. RoboForex LP bears no responsibility for trading results based on trading recommendations described in these analytical reviews.

Ichimoku Cloud Analysis 08.02.2021 (LTCUSD, EURUSD, USDJPY)

Article By RoboForex.com

LTCUSD, “Litecoin vs US Dollar”

LTCUSD is trading at 150.25; the instrument is moving above Ichimoku Cloud, thus indicating an ascending tendency. The markets could indicate that the price may test the cloud’s upside border at 146.55 and then resume moving upwards to reach 175.05. Another signal in favor of a further uptrend is a rebound from the rising channel’s downside border. However, the bullish scenario may no longer be valid if the price breaks the cloud’s downside border and fixes below 135.05. In this case, the pair may continue falling towards 120.05.

LTCUSD
Risk Warning: the result of previous trading operations do not guarantee the same results in the future

EURUSD, “Euro vs US Dollar”

EURUSD is trading at 1.2037; the instrument is moving below Ichimoku Cloud, thus indicating a descending tendency. The markets could indicate that the price may test the cloud’s downside border at 1.2050 and then resume moving downwards to reach 1.1875. Another signal in favor of a further downtrend will be a rebound from the descending channel’s upside border. However, the bearish scenario may be canceled if the price breaks the cloud’s upside border and fixes above 1.2125. In this case, the pair may continue growing towards 1.2205.

EURUSD
Risk Warning: the result of previous trading operations do not guarantee the same results in the future

USDJPY, “US Dollar vs Japanese Yen”

USDJPY is trading at 105.50; the instrument is moving above Ichimoku Cloud, thus indicating an ascending tendency. The markets could indicate that the price may test Tenkan-Sen and Kijun-Sen at 105.15 and then resume moving upwards to reach 106.35. Another signal in favor of a further uptrend will be a rebound from the rising channel’s downside border. However, the bullish scenario may no longer be valid if the price breaks the cloud’s downside border and fixes below 103.95. In this case, the pair may continue falling towards 103.05.

USDJPY

Article By RoboForex.com

Attention!
Forecasts presented in this section only reflect the author’s private opinion and should not be considered as guidance for trading. RoboForex LP bears no responsibility for trading results based on trading recommendations described in these analytical reviews.

The Analytical Overview of the Main Currency Pairs on 2021.02.08

by JustForex

The EUR/USD currency pair

Technical indicators of the currency pair:
  • Prev Open: 1.1963
  • Prev Close: 1.2045
  • % chg. over the last day: +0.68%.

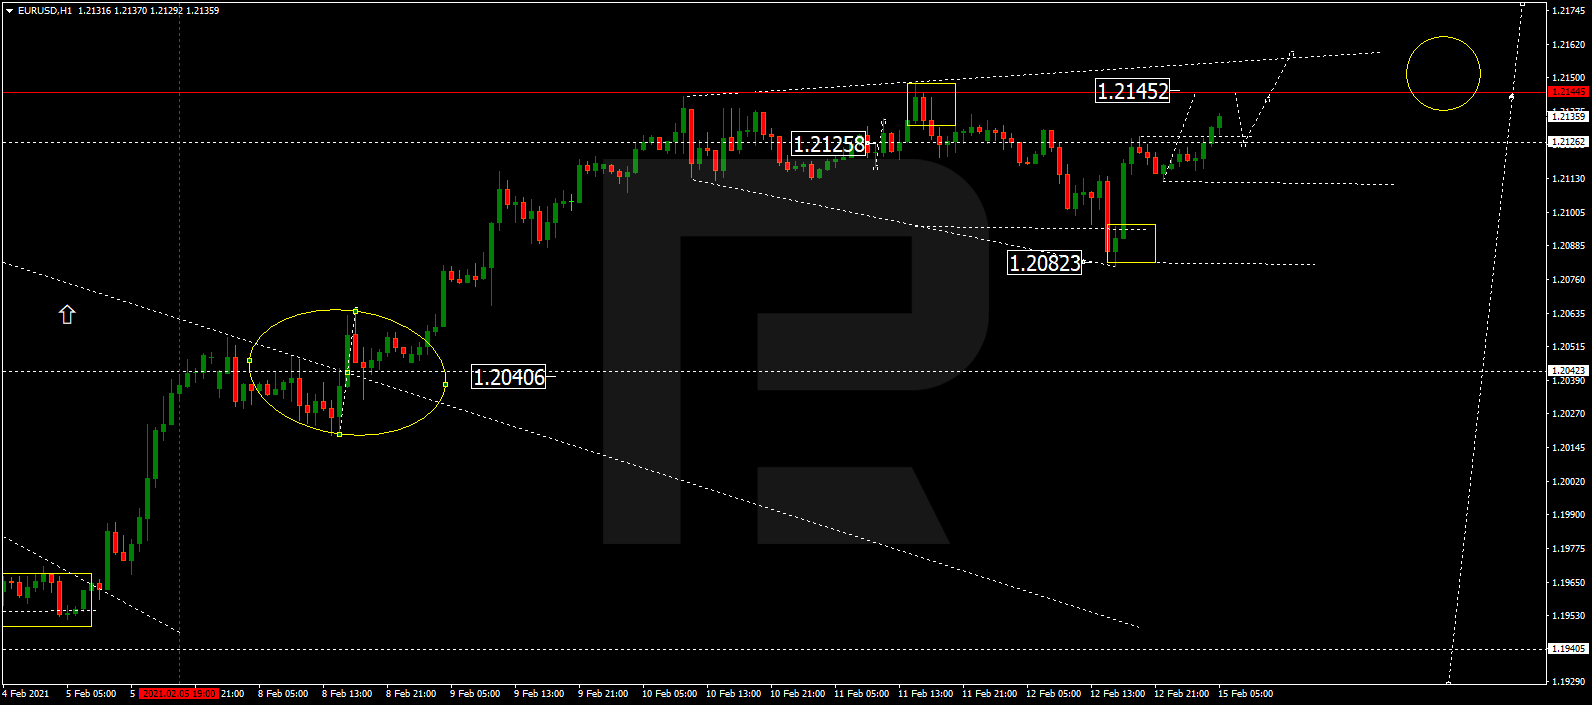
The EUR/USD has rebounded sharply after negative statistics from the States but remains below the important level of 1.2059, which is the border of the previous trading range. Given the yield on bonds in the credit market, where German Bonds are still lagging behind American Treasuries, the development of the northern correction remains a big question mark.

Trading recommendations
  • Support levels: 1.1952, 1.1799
  • Resistance levels: 1.2059

The main scenario for trading the EUR/USD is cautious buying. Technical indicators have rearranged northward. The ADX showed significant gains during the rebound. As long as the price is above the moving averages, buying will be relevant.

Alternative scenario: if the price consolidates below the level of 1.2017, the pair may return to 1.1952.

EUR/USD
There is no news feed for today.

The GBP/USD currency pair

Technical indicators of the currency pair:
  • Prev Open: 1.3667
  • Prev Close: 1.3734
  • % chg. over the last day: +0.49%

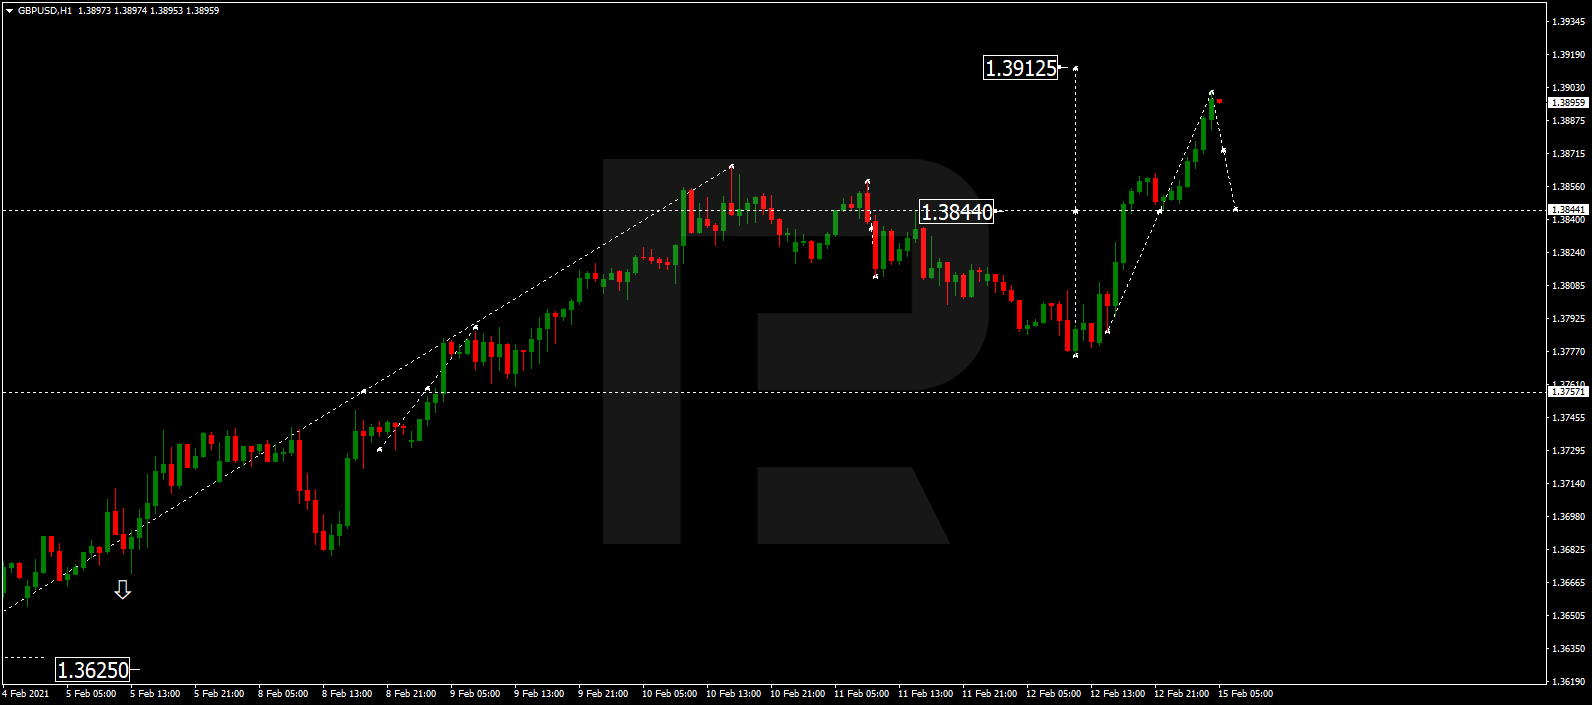
The sterling showed mixed results on Friday. On the one hand, it rose following the decline in the dollar index. On the other hand, the growth has turned out to be less than in the euro, which calls into question the strength of the British currency. The pair stalled again near annual highs, indicating strong resistance around 1.3750.

Trading recommendations
  • Support levels: 1.3609, 1.3565
  • Resistance levels: 1.3757

The main scenario for the GBP/USD is trading sideways between 1.3757 and 1.3680. Despite the rapid growth Thursday through Friday and the price-fixing above the moving averages, the situation remains ambiguous. The ADX reacts very weakly to the pair’s growth. It gives a reason to believe that further growth will be limited by the resistance level of 1.3757.

Alternative scenario: if the pair consolidates above 1.3757, it is likely to continue rising to 1.3800. A breakthrough of 1.3680 will bring the pair back to the downtrend scenario and the 1.3609 level.

GBP/USD
There is no news feed for today.

The USD/JPY currency pair

Technical indicators of the currency pair:
  • Prev Open: 105.53
  • Prev Close: 105.36
  • % chg. over the last day: -0.16%

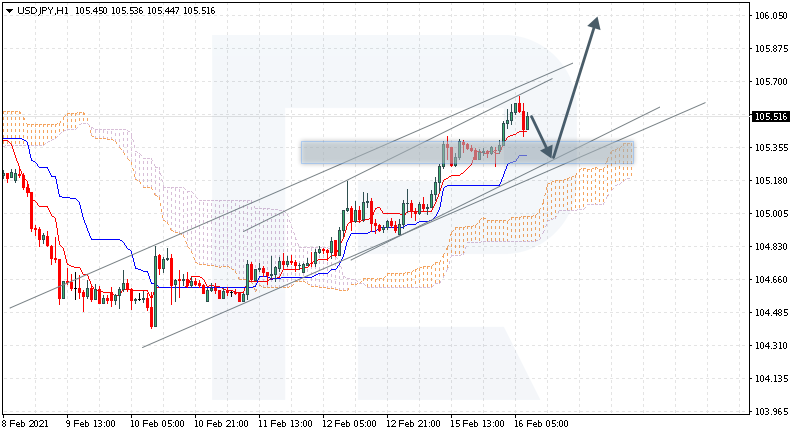
The dollar-yen pair stopped after the disappointing data on the US labor market was revealed. Although, the decline in the dollar index hardly affected the pair. Stock growth and bond yields were supported by the bulls. In this light, a correction can be expected after a three-week rise, but there are no signals for a complete price reversal in the market so far.

Trading recommendations
  • Support levels: 104.82, 104.40
  • Resistance levels: 105.77, 106.12

The main scenario is buying after a pullback. The ADX has fallen sharply after entering the overbought area, and the pair has slowed down. The price is near the moving averages. The MACD is close to zero. These are signs of sideways trading for some time or a short-term decline.

An alternative scenario implies the price-fixing below 104.82. In this case, the pair may decline to 104.40.

USD/JPY
There is no news feed for today.

The USD/CAD currency pair

Technical indicators of the currency pair:
  • Prev Open: 1.2822
  • Prev Close: 1.2752
  • % chg. over the last day: -0.55%

The pair dropped significantly on Friday. The growth of quotations on the oil market continued to put pressure on the instrument, and disappointing statistics in the US increased this pressure. As a result, the price closed near the week’s lows.

Trading recommendations
  • Support levels: 1.2737, 1.2683
  • Resistance levels: 1.2844, 1.2879

The main scenario is selling. The ADX shows the average values of the downside potential. Taking into account the position of the other indicators, the downward movement will remain in force as long as the price is below 1.2844.

Alternative scenario: if the price manages to gain a foothold above 1.2844, the pair may resume its growth to the resistance level of 1.2875 or higher.

USD/CAD
There is no news feed for today.

by JustForex


This article reflects a personal opinion and should not be interpreted as an investment advice, and/or offer, and/or a persistent request for carrying out financial transactions, and/or a guarantee, and/or a forecast of future events.

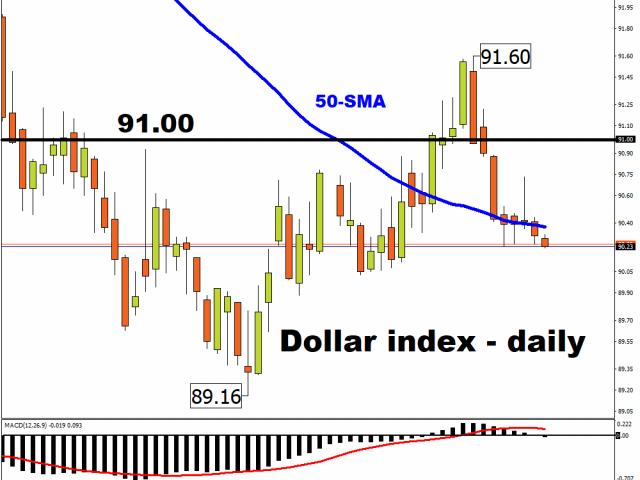
The dollar index decreased after the release of NFP data, but the stock market is growing amid expectations of a stimulus packag

by JustForex

The latest US labor market data was disappointing, nonfarm payrolls increased just by 49,000 in January, which is below the average growth estimate of 105,000. The revised indicator for December was even worse, with the Labor Department reporting that the world’s largest economy lost 227,000 workplaces compared with a cut of 140,000 earlier. At first glance, the unemployment rate looks much better: 6.3% from 6.7% earlier, but this is partly because the share of the economically active population has decreased.

The salary level is also below expectations. The increase was 0.2%, but the average working week increased to 35 hours from 34.7 previously. In general, the report turned out to be extremely negative, which served as a driver for the decline in the US dollar. Treasury obligations reacted roughly as expected, with 10-year bonds falling from 1.17% to 1.15% within 10 minutes after the report release.

However, later there was an increase in bond and stock market yields. The Treasuries rose to 1.185%. The reason for the optimism was the results of the vote for the economic aid package proposed by Joe Biden. On Friday, in the Senate Hall, the vote was divided as follows: 51 votes in favor and 50 votes opposed. This allows Democrats to draft a stimulus bill in the next few weeks.

As a result, optimism returned to the market. In the European session, the Treasury yield rose to 1.90%. Stock market futures are showing an upward trend.

Main market quotes:

S&P 500 (F) 3,890.12 +9.87 (+0.25%)

Dow Jones 31,148.24 +92.38 (+0.30%)

DAX 14,090.10 +33.38 (+0.24%)

FTSE 100 6,535.76 +46.43 (+0.72%)

USD Index 91.177 +0.209 (+0.23%)

There is no news feed for today.

by JustForex


This article reflects a personal opinion and should not be interpreted as an investment advice, and/or offer, and/or a persistent request for carrying out financial transactions, and/or a guarantee, and/or a forecast of future events.

Key events this week: Will political noise trump US earnings?

By Han Tan, Market Analyst, ForexTime

With the WallStreetBets frenzy looking to have cooled off last week, global investors are able to focus most of their attention on fundamental events over the coming days:

  • Tuesday, 9 February: Former President Trump’s second impeachment trial begins; Twitter Q4 results
  • Wednesday, 10 February: Fed Chair Jerome Powell speech; US Jan. inflation
  • Thursday, 11 February: OPEC monthly report; EC economic forecasts;
    Disney Q4 earnings
  • Friday, 12 February: UK Q4 GDP; US February consumer sentiment


Earnings could spell more upside for US benchmark indices

The S&P 500 hit a new record high on Friday, and is poised to breach the psychologically-important 3,900 mark. At the time of writing, the benchmark index’s futures contracts suggest more gains at the Monday cash open, aided by comments from Treasury Secretary Janet Yellen who foresees full US employment in 2022 on the back of President Joe Biden’s $1.9 trillion fiscal stimulus plan.

According to FactSet, more than half of the companies on the S&P 500 have already reported their respective Q4 earnings. 4 out of every 5 companies (81%) that have released their earnings have been able to beat market expectations. As a result, and potentially due to the low base effect set in 2020, markets are predicting double-digit earnings growth for all four quarters this year.

As investors continue to price in their earnings outlooks, coupled with the optimism surrounding more incoming US fiscal stimulus, this could spell new record highs for US benchmark indices.

However, negotiations surrounding the next fiscal package may be influenced by the proceedings in the Senate this week, as former US President Donald Trump undergoes his second impeachment trial.

Such political noise, if it grows loud enough, could dampen the risk-on sentiment in US stocks.


Brent may hit $60/bbl this week

Brent oil is tantalisingly close to the psychologically-important $60/bbl level, which is well within reach. Still, from a technical perspective, its 14-day relative strength index indicates that it has reached overbought levels, and may be ripe for a pullback.

Should OPEC’s report this Thursday point to a faster recovery in global demand, that could spur bulls to push this commodity prices even higher.


Gold’s death cross to meet mid-week catalyst?

As mentioned last week, spot gold’s 50-day moving average is very close to crossing below its 200-day counterpart, which would mark a ‘death cross’. Such a technical event often triggers further declines.

From a fundamental perspective, gold investors will be looking out for any signals from Fed Chair Jerome Powell’s speech as well as the US January inflation data release on Wednesday.

Noting that gold investments are widely seen as a way to preserve wealth in times of faster inflation, any cues that US inflation is going to overshoot may prompt more gains in bullion.


Disclaimer: The content in this article comprises personal opinions and should not be construed as containing personal and/or other investment advice and/or an offer of and/or solicitation for any transactions in financial instruments and/or a guarantee and/or prediction of future performance. ForexTime (FXTM), its affiliates, agents, directors, officers or employees do not guarantee the accuracy, validity, timeliness or completeness, of any information or data made available and assume no liability as to any loss arising from any investment based on the same.


Forex-Time-LogoArticle by ForexTime

ForexTime Ltd (FXTM) is an award winning international online forex broker regulated by CySEC 185/12 www.forextime.com


Ichimoku Cloud Analysis 05.02.2021 (ETHUSD, NZDUSD, AUDCHF)

Article By RoboForex.com

ETHUSD, “Ethereum vs US Dollar”

ETHUSD is trading at 1639.30; the instrument is moving above Ichimoku Cloud, thus indicating an ascending tendency. The markets could indicate that the price may test the cloud’s upside border at 1620.05 and then resume moving upwards to reach 1835.00. Another signal in favor of a further uptrend is a rebound from the downside border of a Triangle pattern. However, the bullish scenario may no longer be valid if the price breaks the cloud’s downside border and fixes below 1505.00. In this case, the pair may continue falling towards 1415.00. To confirm further growth, the asset must break the pattern’s upside border and fix above 1685.00.

ETHUSD
Risk Warning: the result of previous trading operations do not guarantee the same results in the future

NZDUSD, “New Zealand Dollar vs US Dollar”

NZDUSD is trading at 0.7154; the instrument is moving below Ichimoku Cloud, thus indicating a descending tendency. The markets could indicate that the price may test the cloud’s downside border at 0.7175 and then resume moving downwards to reach 0.7005. Another signal in favor of a further downtrend will be a rebound from the resistance area. However, the bearish scenario may be canceled if the price breaks the cloud’s upside border and fixes above 0.7220. In this case, the pair may continue growing towards 0.7295. To confirm further decline, the asset must break the downside border of the Triangle pattern and fix below 0.7105.

NZDUSD
Risk Warning: the result of previous trading operations do not guarantee the same results in the future

AUDCHF, “Australian Dollar vs Swiss Franc”

AUDCHF is trading at 0.6873; the instrument is moving above Ichimoku Cloud, thus indicating an ascending tendency. The markets could indicate that the price may test Tenkan-Sen and Kijun-Sen at 0.6840 and then resume moving upwards to reach 0.6955. Another signal in favor of a further uptrend will be a rebound from the descending channel’s upside border. However, the bullish scenario may no longer be valid if the price breaks the cloud’s downside border and fixes below 0.6790. In this case, the pair may continue falling towards 0.6735.

AUDCHF

Article By RoboForex.com

Attention!
Forecasts presented in this section only reflect the author’s private opinion and should not be considered as guidance for trading. RoboForex LP bears no responsibility for trading results based on trading recommendations described in these analytical reviews.

The Analytical Overview of the Main Currency Pairs on 2021.02.05

by JustForex

The EUR/USD currency pair

Technical indicators of the currency pair:
  • Prev Open: 1.2035
  • Prev Close: 1.1962
  • % chg. over the last day: -0.61%.

The EUR/USD continues to be the weakest pair among the G10 currencies. The euro suffered especially strong losses against the sterling, which closed the day in positive territory. On the daily chart, the pair has stopped near the SMA100 moving average, which could trigger a pullback. The data on the US market may be critical for the further movement.

Trading recommendations
  • Support levels: 1.1921, 1.1799
  • Resistance levels: 1.2059

The main scenario for trading the EUR/USD is selling on the rise. The pair may be currently looking for a new support level for a pullback. The ADX indicates a high potential for movement. It reached the short-term oversold area yesterday. A small divergence has formed on the MACD. These are all signs of a northern correction.

Alternative scenario: if the price consolidates above the level of 1.2030, the pair may return to the 1.2059 level.

EUR/USD
News feed for 2021.02.05:
  • – The US Nonfarm Employment Change (Jan) at 15:30 (GMT+2).

The GBP/USD currency pair

Technical indicators of the currency pair:
  • Prev Open: 1.3641
  • Prev Close: 1.3668
  • % chg. over the last day: +0.20%

On Thursday, the pound returned to its previous range after the Bank of England comments on monetary policy. The market is now less likely to expect a rate cut this year. In the light of this news, the pound rebounded from the day’s lows by 130 points, closing the day with a bullish engulfing candlestick.

Trading recommendations
  • Support levels: 1.3609, 1.3565
  • Resistance levels: 1.3716, 1.3757

The main scenario for the GBP/USD is trading sideways between 1.3716 and 1.3609. Despite the rapid growth on Thursday and the price-fixing above the moving averages, the situation is rather unclear. The ADX ignored the impulse and remained at low levels. This gives a reason to believe that further growth will be limited by the first resistance level.

Alternative scenario: if the pair consolidates above 1.3616, it is likely to continue growing to 1.3757. A breakthrough of 1.3609 will bring the pair back to a downtrend scenario.

GBP/USD
News feed for 2021.02.05:
  • – The US Nonfarm Employment Change (Jan) at 15:30 (GMT+2).

The USD/JPY currency pair

Technical indicators of the currency pair:
  • Prev Open: 105.00
  • Prev Close: 105.54
  • % chg. over the last day: +0.53%

The dollar-yen pair continues to grow steadily amid the optimistic mood on the stock market and the strengthening of the US dollar. Today’s NFP data will play a crucial role for the trend. The pair has stopped near the November highs and the dollar index is near the SMA100 moving average.

Trading recommendations
  • Support levels: 104.82, 104.40
  • Resistance levels: 105.68, 106.12

The main scenario is buying. The pair has almost reached the main goal. A pullback can be expected within the day, as the short-term overbought area is observed on the H1 and the H4 time frames. A pullback to the moving averages in the area of 105.25 – 105.10 may be appropriate.

An alternative scenario implies a price-fixing below 104.10. In this case, the pair may decline to 104.82 – 104.40.

USD/JPY
News feed for 2021.02.05:
  • – The US Nonfarm Employment Change (Jan) at 15:30 (GMT+2).

The USD/CAD currency pair

Technical indicators of the currency pair:
  • Prev Open: 1.2782
  • Prev Close: 1.2821
  • % chg. over the last day: +0.30%

The pair has stuck in the range. Oil quotes continued to rise, which contributed to the strengthening of the Canadian dollar. But the US dollar is also showing an upward trend. As a result, the USD/CAD fluctuates near the moving averages.

Trading recommendations
  • Support levels: 1.2760, 1.2737
  • Resistance levels: 1.2844, 1.2875

The main scenario is trading in a sideways range between 1.2844 and 1.2760. The ADX is still close to the minimum values, and the MACD is near zero. Taking into account the expectations of a strong news background in the American session, the probability of going out of the range is high.

Alternative scenario: if the price manages to gain a foothold above 1.2844, the pair may resume growth to the resistance level of 1.2875 or higher. A breakthrough of 1.2760 could trigger a further decline.

USD/CAD
News feed for 2021.02.05:
  • – The US Nonfarm Employment Change (Jan) at 15:30 (GMT+2);
  • – The Canada Employment Change (Jan) at 15:30 (GMT+2);
  • – The Ivey Purchasing Managers Index (PMI) (Jan) at 17:00 (GMT+2).

by JustForex


This article reflects a personal opinion and should not be interpreted as an investment advice, and/or offer, and/or a persistent request for carrying out financial transactions, and/or a guarantee, and/or a forecast of future events.

No signal for negative rates. Repeat…

By Lukman Otunuga, Research Analyst, ForexTime

It’s “Super Thursday” in the UK in case anyone forgot, and the Bank of England hasn’t let us down in terms of volatility!

The door has been left ajar very slightly to negative interest rates but importantly, this would only be after a six-month period of industry preparation. In fact, the MPC referenced multiple times in its statement the fact that it doesn’t want the market to interpret this as a sign that NIRP is on its way.

Punchy growth forecasts also indicate that any dipping of toes into sub-zero country is increasingly unlikely in the current cycle as the Bank assumes a full GDP rebound by the fourth quarter of this year.

Sterling has reacted aggressively with EUR/GBP smashing through 0.88, which had offered support over the last few sessions, and on its way to a low some 50 ticks below. If we close around these levels, there doesn’t look like much support until 0.87 where prices held last Spring. The “vaccine trade” should also continue to benefit from the faster rollout in the UK with the potential for a quicker economic reopening helping the medium-term outlook.

Dollar bulls warming to their task

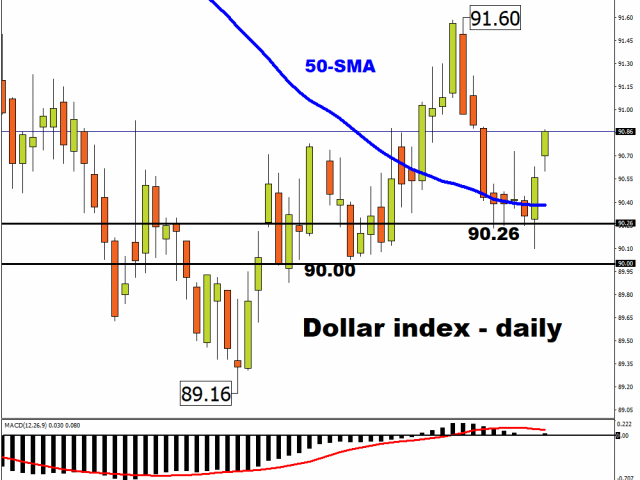
We got more positive economic data out of the US today with initial jobless claims bettering forecasts (779k v 830k). This comes on the back of decent ISM and ADP figures earlier in the week which is telling us the economy is proving more resilient than expected. This is all music to those counter-consensus greenback bulls who have pushed DXY to a minor short-term high around 91.40, the highest since the start of December.

The dollar does generally strengthen in the first quarter of the year so seasonals are helping the more positive sentiment around growth prospects in the US. With active traders covering short USD positions, the measured move on the inverse head and shoulders pattern in DXY sees 92.70 as a possible target. However, before that let’s not forget it’s the first Friday of the month tomorrow so the release of non-farm payrolls! Does a good number mean bad news for stocks with more pushback on a bigger stimulus bill?

Gold bugs getting the chill

Gold has plunged today, slicing through $1800 as the dollar moves higher on stronger nominal yields.

With US stocks opening mixed but consolidating their recent gains near the highs, the yellow metal is finding no love at all. The break of the January low doesn’t look pretty from a technical perspective with the December low at $1764 assuming huge significance.

Disclaimer: The content in this article comprises personal opinions and should not be construed as containing personal and/or other investment advice and/or an offer of and/or solicitation for any transactions in financial instruments and/or a guarantee and/or prediction of future performance. ForexTime (FXTM), its affiliates, agents, directors, officers or employees do not guarantee the accuracy, validity, timeliness or completeness, of any information or data made available and assume no liability as to any loss arising from any investment based on the same.


Forex-Time-LogoArticle by ForexTime

ForexTime Ltd (FXTM) is an award winning international online forex broker regulated by CySEC 185/12 www.forextime.com
The stock market and the dollar index continued to rise in anticipation of the NFP data

by JustForex

On Thursday, the announcement of the results of the meeting of the Bank of England was an important event of the day, which left interest rates at the previous level of 0.1% and the volume of bonds redemption at £875 billion.

The Bank of England announced that the UK economy is heading for a rapid recovery amid vaccination measures. Despite downgrading its forecast for the year, the central bank pointed to expectations of a strong rebound. The Monetary Policy Committee has indicated that banks should prepare for the integration of negative interest rates if unforeseen circumstances arise. But no rate cuts are expected in the near future. The UK bond yields rose, with 10-year and 30-year bonds has been increasing to their highest levels since March. The pound hit its highest level against the euro since May.

Meanwhile, the French government has indicated that there is no need to introduce additional quarantine measures. The number of infections in France is high, but the situation has remained relatively stable over the past two weeks. French statistical agency INSEE estimates that a seven-week nationwide lockdown similar to November’s will cut down the economy by 1% in the first quarter. But if the restrictions remain unchanged, an increase to 1.5% can be expected. The speed of vaccine introduction will be key in determining when the economy can return to its normal state.

Against this background and shortly before the publication of data on the labor market in the United States, the stock market and the dollar index continued to grow. S&P 500 futures contracts have renewed highs. Expectations are positive as Thursday’s benefit report showed that the number of filings fell to their lowest level since November.

Main market quotes:

S&P 500 (F) 3,872.62 +8.02 (+0.21%)

Dow Jones 31,055.86 +332.26 (+1.08%)

DAX 14,046.85 -13.44 (-0.10%)

FTSE 100 6,505.25 +1.53 (+0.02%)

USD Index 91.412 -0.138 (-0.15%)

Important events:
  • – Australia Retail Sales (m/m) (Dec) at 02:30 (GMT+2);
  • – United States Nonfarm Employment Change (Jan) at 15:30 (GMT+2);
  • – Canada Employment Change (Jan) at 15:30 (GMT+2);
  • – Ivey PMI (Jan) at 17:00 (GMT+2).

by JustForex


This article reflects a personal opinion and should not be interpreted as an investment advice, and/or offer, and/or a persistent request for carrying out financial transactions, and/or a guarantee, and/or a forecast of future events.

Finetero Review – Trade CFDs on Leading Global Stocks

What is Finetero?

Finetero is a company providing CFD trading services since 2018, one that has managed to reach several important milestones in terms of trading execution, transparency, and security. It takes pride in some of its features such as encrypted SSL, 2FA, Amazon AWS, or Cloudfare to mitigate potential distributed denial-of-service (DDoS) attacks.

Trading with Finetero also means access to leading asset classes, trusted platforms, and competitive trading conditions, since the customer is always the top priority. Increased competition in the trading world is a positive incentive for brands like Finetero, given their main focus is on constantly improving their offer, to stay one step ahead of other providers.

Finetero official logo

Finetero Stocks and CFDs Trading

Because its asset coverage is so diverse, Finetero is a place where retail traders with different objectives can come together. Even though its offer includes currency pairs, indices, commodities, and cryptocurrencies, the largest share is attributed to global stocks. Companies like Apple, Amazon, Facebook, Adidas, Baidu, Belgacom, BMW, BNP Paribas, JP Morgan Chase, or big pharma have been in the spotlight since the first quarter of 2020.

Finetero stocks CFDs trading

With Finetero traders have access to CFDs based on thousands of stocks, tradable with up to 1:10 leverage, flexible spreads, and also 0% trading commission. As long as stocks will continue to be volatile, traders will pile into the most active names, putting the Finetero stock trading offer in a good position.

Professional Trading Software

All the challenges raised by increased stock volatility create incentives for brands like Finetero to make sure trading software is fully optimized to deal with such conditions. WebTrader is the brand’s proprietary platform, currently the most flexible solution available with this company.

Finetero platforms

Traders wanting to track stocks will find the platform very intuitive and fast, due to multiple features built into it. Finetero wants customers to be in full control over their trading accounts all the time and that is why the WebTrader can be accessed at any point, from any location, via any browser, regardless of device or operating system.

MetaTrader 4 complements WebTrader successfully and provides a second reliable option. Developed by MetaQuotes, it continues to be a platform used by millions of traders around the world, thanks to its multiple features and trading tools. This solution can be installed on any device, including smartphones or tablets.

Competitive Trading Conditions

Trading with Finetero means access to 5 different accounts, providing access to benefits such as online chat support, STP/ NDD execution, professional leverage stocks of 1:10, an online education center, Trading Central resources, and support from a relationship manager.

Convenience is a keyword, given anybody can open an account with as little as 200 euros and test live trading conditions.

For those wanting to take their trading to the next level, Finetero offers enhanced account types with added features and benefits. Funding a trading account can be done via credit/debit card or wire transfer, currently some of the most reliable payment methods.

Pros

  • Access to thousands of stocks CFDs with competitive spreads
  • Shares trading using MetaTrader 4
  • Online chat support for all customers

Cons

  • Traders need to be aware of the overnight swaps
  • Volatility on stocks with a small market cap can be high

Finetero Review Conclusion

Finetero is truly one of the brands providing competitive trading conditions for retail traders around the world wanting to take advantage of the global stock markets. Trading on stocks from the USA, Germany, France, UK, and other large markets, is possible thanks to the wide stock CFDs coverage currently available with this company.


Article by Taylor Wilman