
Article By RoboForex.com
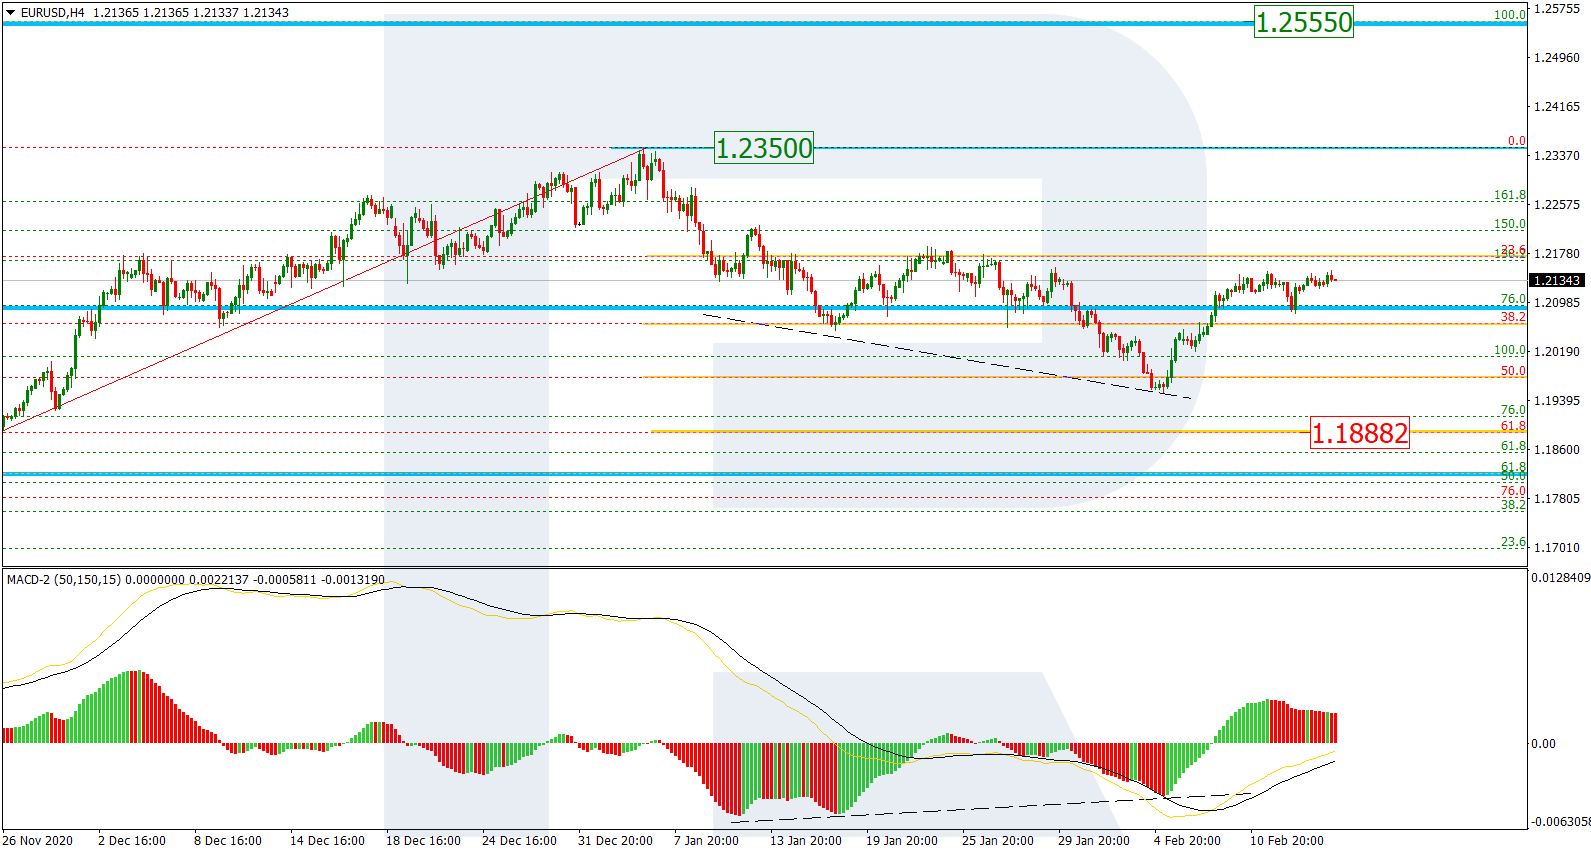
EURUSD, “Euro vs US Dollar”
As we can see in the H4 chart, after completing the correction at 50.0% fibo, EURUSD has started a new rising wave; right now, it is consolidating and may later resume growing. On the other hand, the pair may yet form another descending wave to reach 61.8% fibo at 1.1888 but this scenario is rather unlikely. The key scenario implies a further growth towards the high at 1.2350 and then the long-term fractal high at 1.2555.

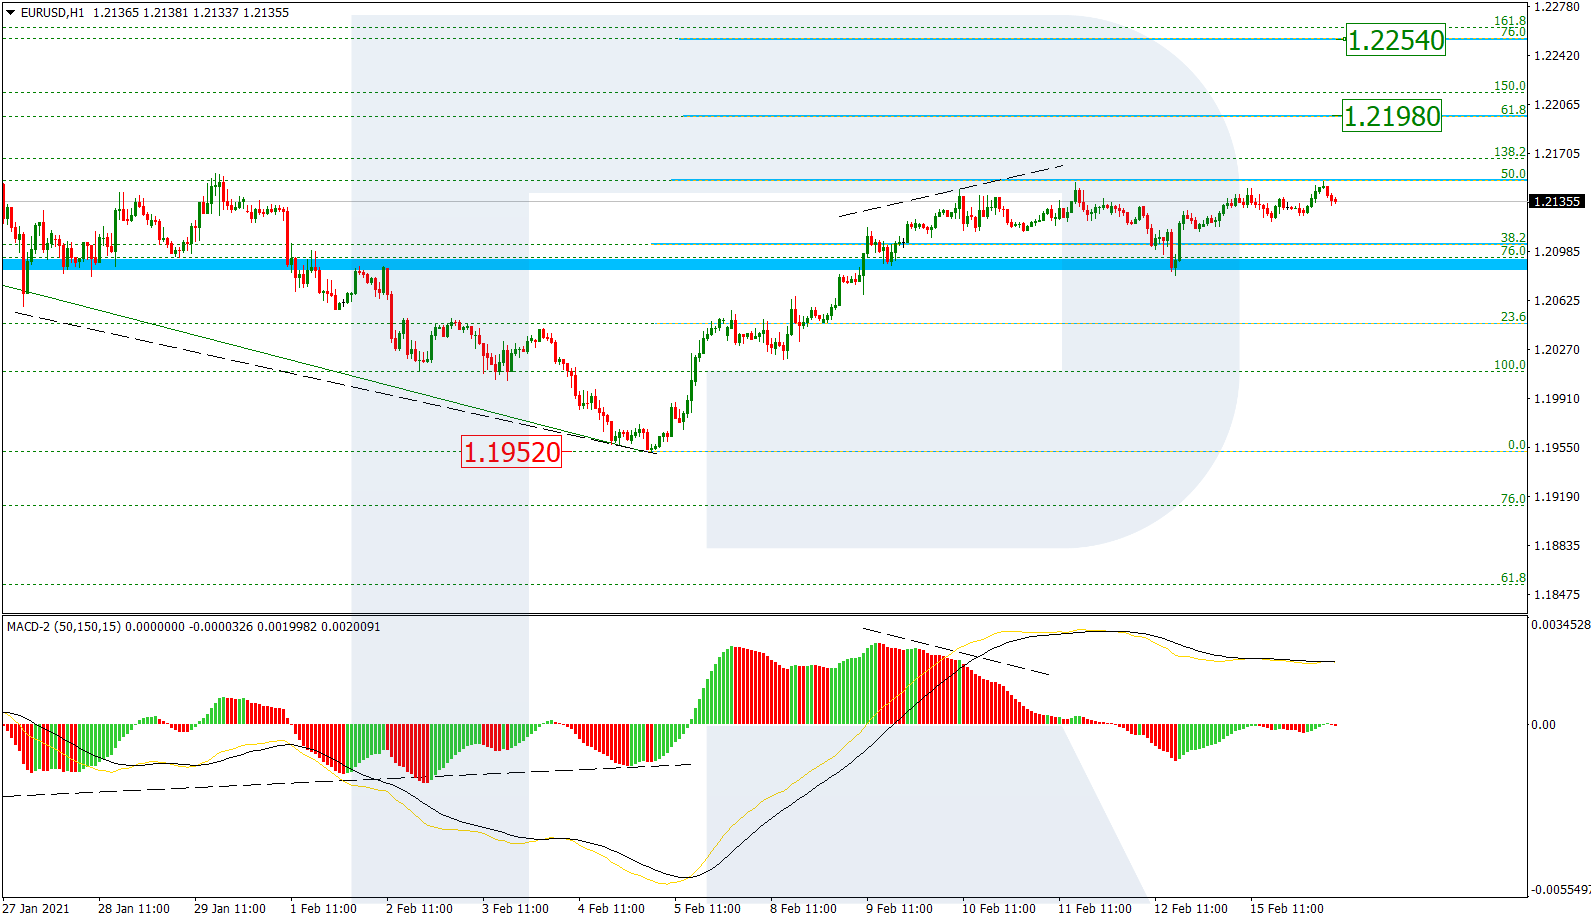
The H1 chart shows a sideways movement after a divergence on MACD – the asset is moving between 38.2% and 50.0% fibo. Later, the price may break the range to the upside and resume growing towards 61.8% and 76.0% fibo at 1.2198 and 1.2254 respectively. A breakout of the local low at 1.1952 will hint at a further downtrend.
Free Reports:
 Download Our Metatrader 4 Indicators – Put Our Free MetaTrader 4 Custom Indicators on your charts when you join our Weekly Newsletter
 Get our Weekly Commitment of Traders Reports - See where the biggest traders (Hedge Funds and Commercial Hedgers) are positioned in the futures markets on a weekly basis.
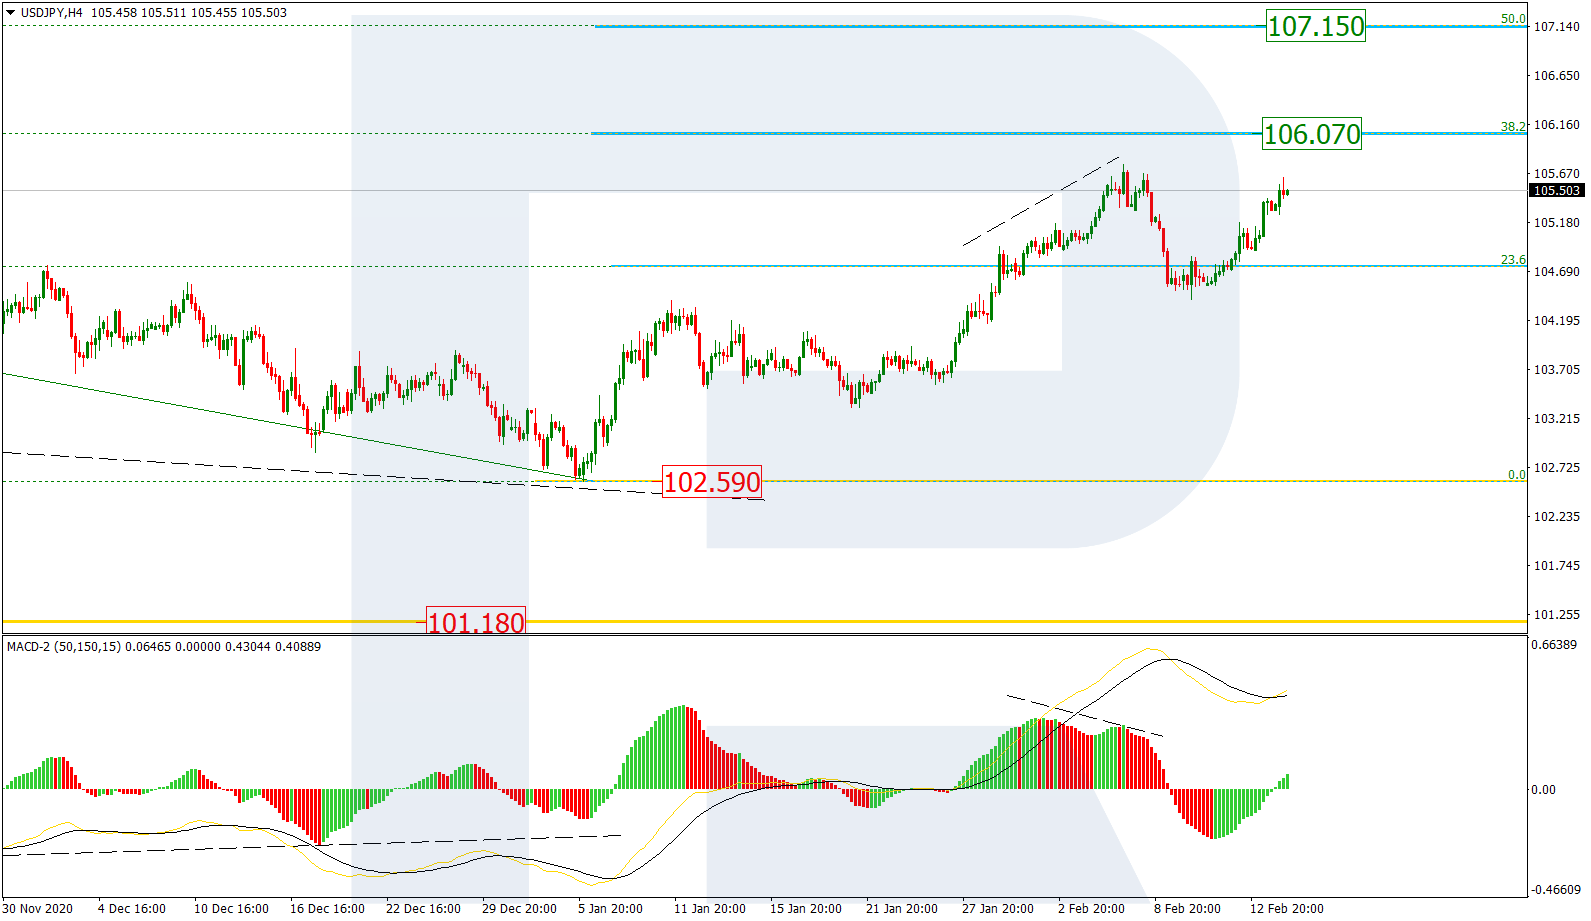
USDJPY, “US Dollar vs. Japanese Yen”
As we can see in the H4 chart, after finishing a deep pullback, USDJPY has formed another rising wave; right now, the pair is heading to reach 38.2% fibo at 106.07. After breaking it and forming a slight correction, the price may continue growing towards 50.0% fibo at 107.15. On the other hand, if the asset breaks the low at 102.59, the instrument may continue falling to reach the fractal low at 101.18.
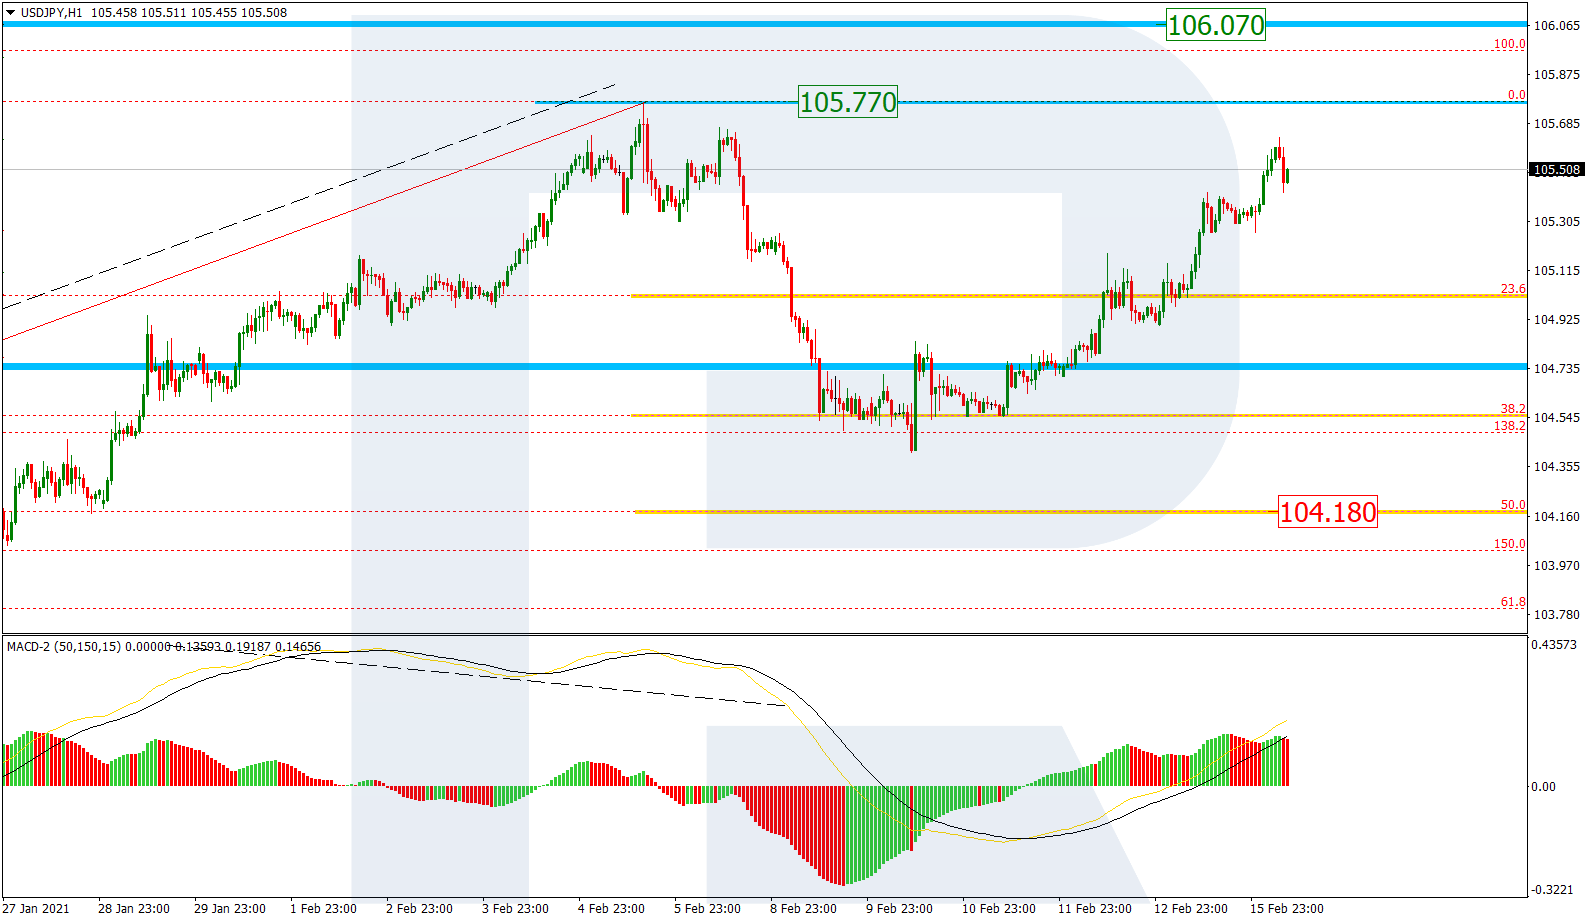
The H1 chart shows that a convergence on MACD made the pair complete the correctional downtrend at 38.2% fibo. The asset may yet continue falling towards 50.0% fibo at 104.18 but this scenario is rather unlikely. The key idea implies that the instrument may break the high at 105.77, thus completing the correction, and continue growing to reach the long-term 38.2% fibo at 106.07.
Article By RoboForex.com
Attention!
Forecasts presented in this section only reflect the author’s private opinion and should not be considered as guidance for trading. RoboForex LP bears no responsibility for trading results based on trading recommendations described in these analytical reviews.

- COT Metals Charts: Weekly Speculator Bets see small gains for Silver & Gold Jul 12, 2026
- COT Bonds Charts: Speculator Bets led by SOFR 3-Months & 2-Year Bonds Jul 12, 2026
- COT Energy Charts: Weekly Speculator Changes led by Brent Oil Jul 12, 2026
- COT Soft Commodities Charts: Weekly Speculator Changes led by Sugar, Corn & Soybeans Jul 12, 2026
- The US and European stock indices are rising again amid renewed investor interest in the AI industry. Jul 10, 2026
- USD/JPY Falls as Yen Recovers Weekly Losses Jul 10, 2026
- Crude oil prices surged sharply by 7% in reaction to the rapid escalation of the conflict in the Middle East Jul 9, 2026
- Middle East Tensions Weigh on Gold Jul 9, 2026
- Pound Awaits Tighter Policy from Bank of England Jul 8, 2026
- The United States carried out airstrikes on Iran after Iran’s attacked tankers in the Strait of Hormuz. The RBNZ raised the interest rate to 2.5% Jul 8, 2026