Archive for Forex and Currency News – Page 298

Murrey Math Lines 22.03.2021 (EURUSD, GBPUSD)

Article By RoboForex.com

EURUSD, “Euro vs. US Dollar”

In the H4 chart, EURUSD is trading below the 200-day Moving Average, thus indicating a descending tendency. In this case, the price is expected to rebound from 3/8 and resume falling to reach the support at 2/8. Still, this scenario may no longer be valid if the price breaks the resistance at 3/8 to the upside. After that, the instrument may continue growing towards 5/8.

EURUSD_H4
Risk Warning: the result of previous trading operations do not guarantee the same results in the future

As we can see in the M15 chart, the pair has broken the downside line of the VoltyChannel indicator and, as a result, may continue its decline.

EURUSD_M15
Risk Warning: the result of previous trading operations do not guarantee the same results in the future

GBPUSD, “Great Britain Pound vs US Dollar”

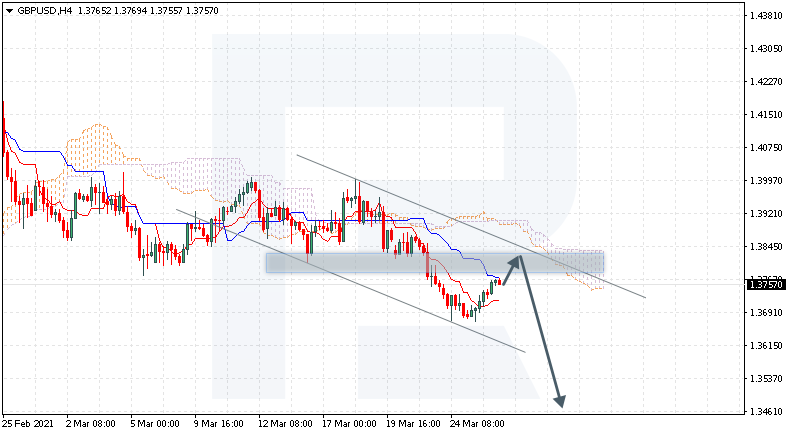
In the H4 chart of GBPUSD, the price is also trading below the 200-day Moving Average, thus indicating a descending tendency. In this case, the asset is expected to test 3/8, rebound from it, and then resume falling towards the support at 1/8. However, this scenario may no longer be valid if the price breaks the resistance at 3/8 to the upside. After that, the instrument may reverse and grow to reach 5/8.

GBPUSD_H4
Risk Warning: the result of previous trading operations do not guarantee the same results in the future

As we can see in the M15 chart, the price has broken the downside line of the VoltyChannel indicator and, as a result, continue trading downwards.

GBPUSD_M15

Article By RoboForex.com

Attention!
Forecasts presented in this section only reflect the author’s private opinion and should not be considered as guidance for trading. RoboForex LP bears no responsibility for trading results based on trading recommendations described in these analytical reviews.

The Analytical Overview of the Main Currency Pairs on 2021.03.22

by JustForex

The EUR/USD currency pair

Technical indicators of the currency pair:
  • Prev Open: 1.1914
  • Prev Close: 1.1903
  • % chg. over the last day: -0.09%.

The euro fell slightly on Friday and continued to decline during the Asian session amid growing tensions in the vaccination program. Also, new quarantine measures in European countries cast doubt on the rapid recovery of the EU economy from the crisis. Economists estimate that the planned recovery could be delayed until September.

Trading recommendations
  • Support levels: 1.1882, 1.1834
  • Resistance levels: 1.1990, 1.2113

The main scenario for EUR/USD is trading sideways between 1.1882 and 1.1990. The price only pierced the first support level on low liquidity at the beginning of trading, which indicates the bears’ weakness. The ADX shows no significant southward trend. But the moving averages and the MACD indicate a low probability of the price-fixing below the support level. In general, the signal is neutral.

Alternative scenario: if the price manages to consolidate below the level of 1.1882, the pair may return to the decline to 1.1834. A breakdown of 1.1990 could send the pair towards 1.2113.

EUR/USD
There is no news feed for today.

The GBP/USD currency pair

Technical indicators of the currency pair:
  • Prev Open: 1.3925
  • Prev Close: 1.3872
  • % chg. over the last day: -0,38%

On Friday, the sterling tended to decline more against the dollar than against the euro. The disappointment of the currency market after the meeting of the Bank of England seems to continue. In addition, the commodity market is declining as well as bond yields and stock prices, making the US dollar rise.

Trading recommendations
  • Support levels: 1.3857, 1.3775
  • Resistance levels: 1.3997, 1.4224

The main scenario for GBP/USD is selling. The ADX is starting to show signs of rising bearish strength. The support level has been broken, and the price is firmly consolidating below. A combination of factors results in a bearish signal of medium strength.

Alternative scenario: if the pair consolidates above 1.3902, it may resume growth to 1.3997.

GBP/USD
There is no news feed for today.

The USD/JPY currency pair

Technical indicators of the currency pair:
  • Prev Open: 108.91
  • Prev Close: 108.89
  • % chg. over the last day: -0,01%

The dollar-yen pair continues to show signs of correction both from the technical side and from the fundamental one. The decline in stock markets continues, putting pressure on the pair. The decline in bond yields signals an increase in demand for defensive assets, including the Japanese yen.

Trading recommendations
  • Support levels: 108.35, 107.08
  • Resistance levels: 109.34, 109.86

The main scenario is trading in a sideways range between 109.34 and 108.35. The ADX on the hourly timeframe shows growth on the pair’s decline, which indicates the presence of bears. The likelihood of a corrective decline is increasing. But as long as the pair is above the support level, the sideways movement scenario remains in effect.

An alternative scenario implies the price-fixing below 108.35. In this case, the pair may return to the decline to 107.08. A breakdown of 109.34 will resume growth.

USD/JPY
There is no news feed for today.

The USD/CAD currency pair

Technical indicators of the currency pair:
  • Prev Open: 1.2490
  • Prev Close: 1.2498
  • % chg. over the last day: +0.06%

The Canadian dollar has slowed down the corrective growth as the oil prices stopped falling. But the outlook for commodity markets remains negative in the medium term, as the threat of a third wave of the coronavirus pandemic has emerged.

Trading recommendations
  • Support levels: 1.2446, 1.2364
  • Resistance levels: 1.2546, 1.2589

The main scenario is trading in a sideways range between 1.2546 and 1.2466. Thursday’s northern impulse hardly continued on Friday. The ADX shows a fall in bullish strength. The MACD is above zero and the price is above the moving averages. In general, there is a weak northern signal limited by the first resistance level.

Alternative scenario: if the price manages to gain a foothold below 1.2466, the pair may resume its southern movement. A breakout of 1.2546 may resume corrective gains.

USD/CAD
There is no news feed for today.

by JustForex


This article reflects a personal opinion and should not be interpreted as an investment advice, and/or offer, and/or a persistent request for carrying out financial transactions, and/or a guarantee, and/or a forecast of future events.

Turkish Lira plunge felt in Japan

By Hussein Sayed Chief Market Strategist (Gulf & MENA), ForexTime

Turkey has returned to financial market headlines following President Erdogan’s decision to fire the country’s hawkish central bank head on Saturday. The Turkish Lira tumbled 14% against the dollar as trading kicked off in Asia to become one of the worst performing emerging market currencies against the greenback this year. The reverberations were felt in Asian markets, particularly in Japan where the Nikkei 225 fell 2%. While there should not be a strong link between the Turkish Lira and Japanese equity markets, it is believed that retail traders in Japan hold significant leveraged long positions in the Lira as a carry trade. Hence, they have to cover these positions by selling equities in local markets.

Elsewhere, Asian stocks traded mixed with China’s Shanghai Composite and Shenzhen Component slightly up, while Hong Kong’s Hang Seng and South Korea’s Kospi have fallen into negative territory. This indicates the Turkish Lira slump will only have a limited impact on other high yielding emerging markets with no risk of wider contagion.

US equity futures are struggling for direction with the S&P 500 spending most of the Asian session between red and green. However, the Nasdaq 100 has gained following a six-basis point fall in US 10-year Treasury yields. Global investors will again be testing the appetite for US debt auctions following a rally of more than 60% in US 10-year yields over just seven weeks. A further spike in yields will bring more volatility and continued rotation into value stocks from growth stocks.

Long term interest rates may have risen for good reason as investors anticipate a strong US economic recovery ahead that could last for several years and brings with it inflation. However, this could also be the biggest threat for risk assets that have been benefiting from an extremely low interest rate environment since the beginning of the Covid-19 pandemic. Despite the recent surge in long term interest rates, they are still considered low when compared to historic averages and that’s why some high asset prices may still be justified at current levels with the Nasdaq 100 having fallen 7% from February’s peak. However, the higher the long-term interest rates go, the more difficult it becomes to justify these valuations.

Companies with the ability to pass on higher prices to customers are likely to be the ones that benefit most and should be overweighted in portfolios. These could be in the industrial, material, financials and commodity sectors.

Disclaimer: The content in this article comprises personal opinions and should not be construed as containing personal and/or other investment advice and/or an offer of and/or solicitation for any transactions in financial instruments and/or a guarantee and/or prediction of future performance. ForexTime (FXTM), its affiliates, agents, directors, officers or employees do not guarantee the accuracy, validity, timeliness or completeness, of any information or data made available and assume no liability as to any loss arising from any investment based on the same.


Forex-Time-LogoArticle by ForexTime

ForexTime Ltd (FXTM) is an award winning international online forex broker regulated by CySEC 185/12 www.forextime.com

Key events this week: Central bank watch continues

By Han Tan Market Analyst, ForexTime

Over the past two weeks, global investors have been gripped by key central bank policy meetings. Markets have been hungry for clues about how the US Federal Reserve, the European Central Bank, the Bank of England and the Bank of Japan, intend to adjust their respective policies.

These major central banks have been buying up billions of dollars’ worth of bonds, and even ETFs, to support their respective financial markets. Given the forward-looking nature of the markets, investors are already trying to pre-empt when these policymakers would pare back those bond purchases, and such shifting expectations have rocked multiple asset classes, from US Treasuries, to the Dollar, and even tech stocks on the Nasdaq 100.

And of course, investors and trader are never fully satiated. Just because the interest rate decisions are over for the time being, doesn’t mean traders and investors can take their eyes off central banks.

This week heralds a smorgasbord of more speeches and panel discussions by key figures:

Monday, 22 March

  • Fed Chair Jerome Powell speaks at BIS Summit
  • Fed speak:
    – Richmond Fed President Thomas Barkin
    – San Francisco Fed President Mary Daly

Tuesday, 23 March

  • Fed Chair Powell and Treasury Secretary Janet Yellen to deliver joint testimonies about pandemic response policies
  • Fed speak:
    – St. Louis Fed President James Bullard
    – New York Fed President John Williams
  • BOE speak:
    – Governor Andrew Bailey
    – Chief Economist Andy Haldane
    – Deputy Governor Jon Cunliffe

Wednesday, 24 March

  • Powell and Yellen joint testimonies about pandemic policies
  • Fed speak:
    – Williams
    – Daly
    – Chicago Fed President Charles Evans

Thursday, 25 March

  • ECB President Christine Lagarde and BOE Governor Bailey speak at BIS Summit
  • Fed speak:
    – Williams
    – Evans
    – Daly
    – Atlanta Fed President Raphael Bostic
    – Fed Vice Chair Richard Clarida


All these scheduled speeches should keep traders and investors occupied over the coming days, especially when it comes to the Fed speak. As I had stated last Friday:

The slew of Fed speak in the upcoming week could also act as a volatility trigger point, especially if any of the officials offer different views from what had been conveyed by the Fed Chair himself after (last) week’s FOMC meeting.

Dollar in focus

From a technical perspective, the FXTM USD index has the potential to enjoy more near-term gains, seeing it has yet to reach the upper band of its Bollinger band (black broken lines). The 50-day simple moving average (SMA) is set to act as its immediate support level. Traders will be offered a stronger bullish signal if this USD index can breach its 100-day SMA (green line) and secure a meaningful breakout out of the downward trend (red lines) that has firmly been in place since March.

Note that the FXTM USD index is an equally-weighted index comprising the following major pairs:

Looking beyond the charts, the US Treasury has over US$180 billion worth of notes to be auctioned off this week. Poor demand for these government bonds could send yields skyrocketing even higher!

Those rising yields resulting from the selloff in Treasury markets have in turn encouraged more demand for the US Dollar. The dollar’s recovery has then weighed on demand for precious metals, such as gold, which have an inverse relationship with the greenback.

Should Treasury yields keep rising and offer support for the US dollar, that should ensure that gold bulls are kept on a tight leash, making it harder for them to push spot gold higher.


Disclaimer: The content in this article comprises personal opinions and should not be construed as containing personal and/or other investment advice and/or an offer of and/or solicitation for any transactions in financial instruments and/or a guarantee and/or prediction of future performance. ForexTime (FXTM), its affiliates, agents, directors, officers or employees do not guarantee the accuracy, validity, timeliness or completeness, of any information or data made available and assume no liability as to any loss arising from any investment based on the same.


Forex-Time-LogoArticle by ForexTime

ForexTime Ltd (FXTM) is an award winning international online forex broker regulated by CySEC 185/12 www.forextime.com

COT Currency Futures Charts: Japanese Yen, Pound, Swiss Franc, Brazil Real, Russia Ruble

By CountingPips.comReceive our weekly COT Reports by Email

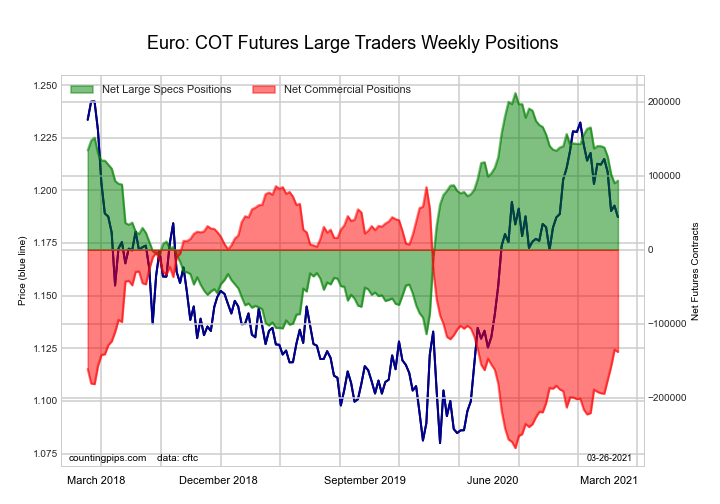
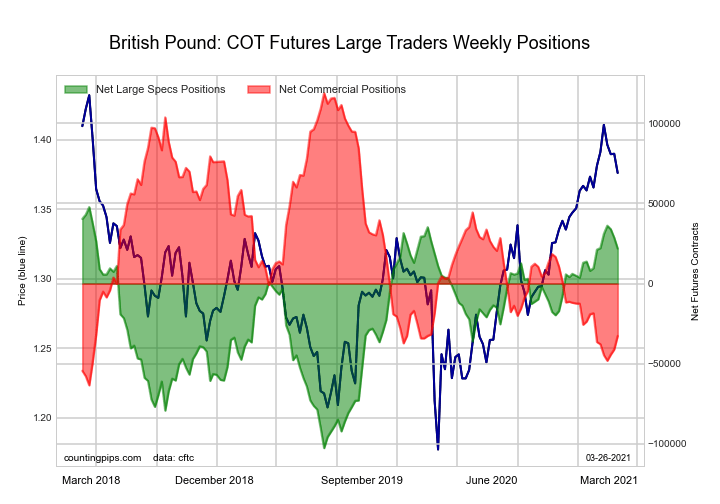
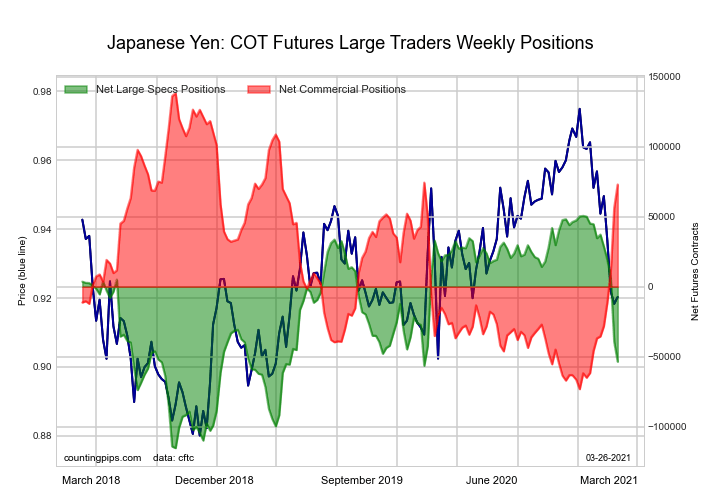
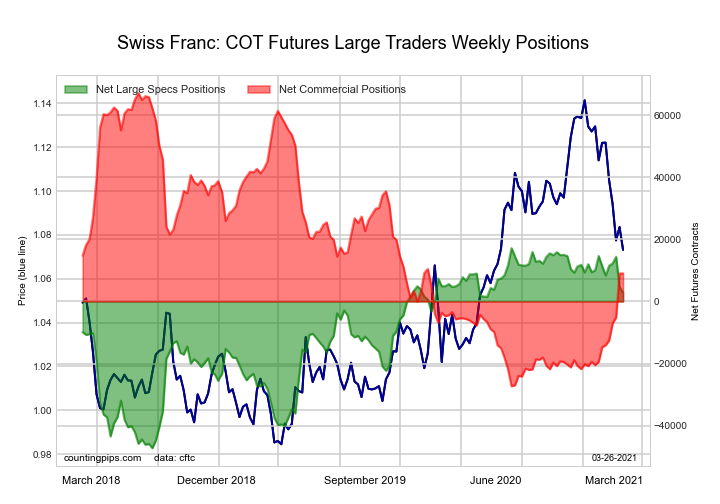
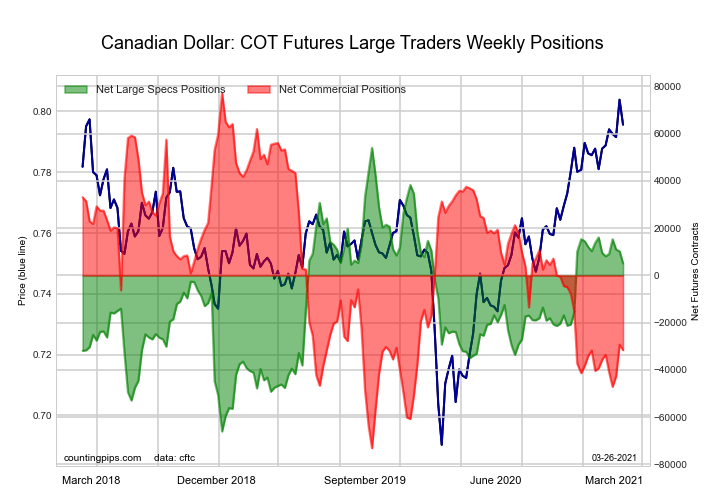
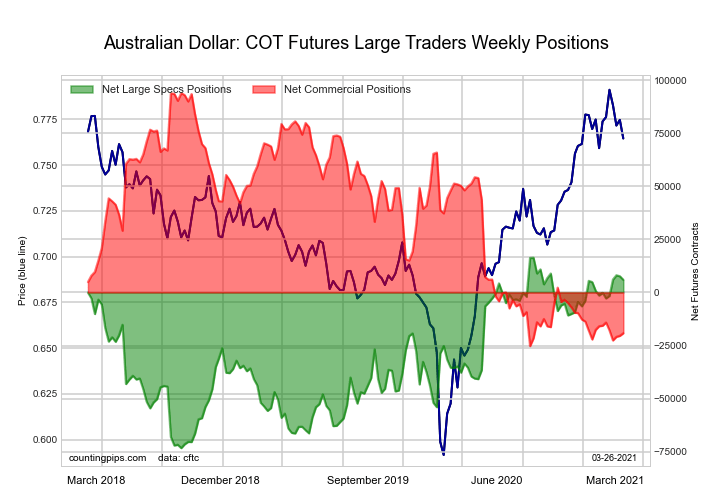
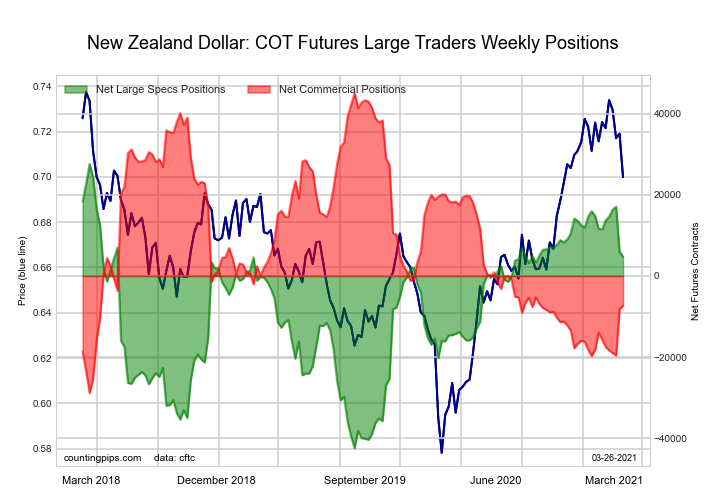
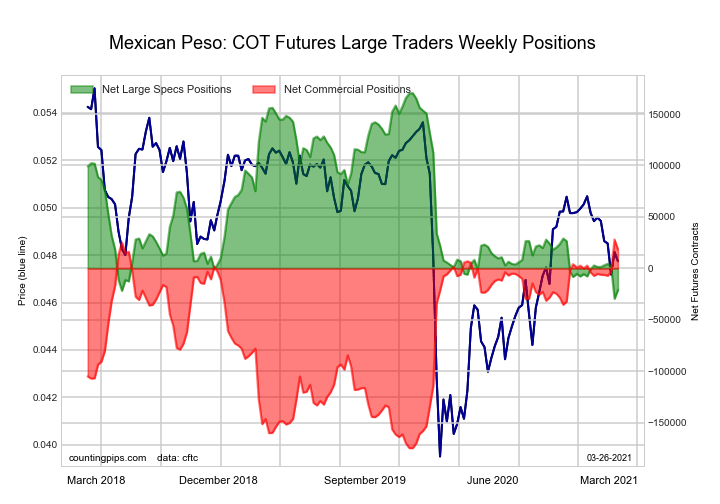
Here are the latest charts and statistics for the Commitment of Traders (COT) data published by the Commodities Futures Trading Commission (CFTC).

The latest COT data is updated through Tuesday March 16 2021 and shows a quick view of how large traders (for-profit speculators and commercial entities) were positioned in the futures markets. All currency positions are in direct relation to the US dollar where, for example, a bet for the euro is a bet that the euro will rise versus the dollar while a bet against the euro will be a bet that the euro will decline versus the dollar.


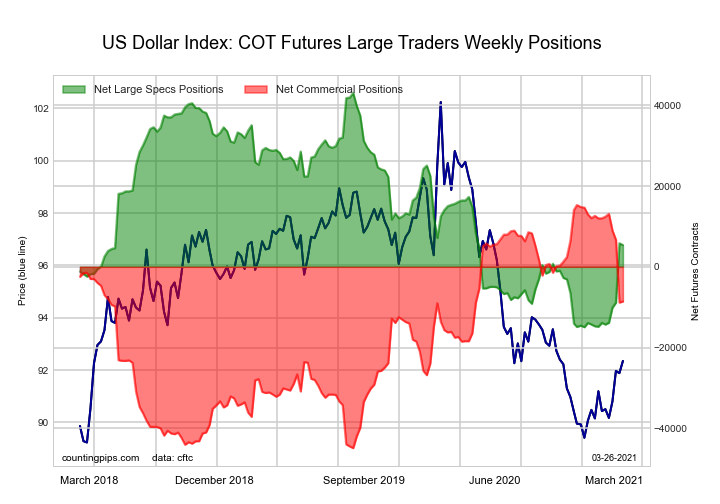
US DOLLAR INDEX:

US DOLLAR INDEX Futures

US DOLLAR INDEX StatisticsSPECULATORSCOMMERCIALSSMALL TRADERS
– Percent of Open Interest Longs:75.14.714.7
– Percent of Open Interest Shorts:58.629.76.1
– Net Position:5,837-8,8483,011
– Gross Longs:26,5751,6575,184
– Gross Shorts:20,73810,5052,173
– Long to Short Ratio:1.3 to 10.2 to 12.4 to 1
NET POSITION TREND:
– COT Index Score (3 Year Range Pct):35.959.958.4
– COT Index Reading (3 Year Range):BearishBullishBullish
NET POSITION MOVEMENT INDEX:
– 6-Week Change in Strength Index:35.6-34.62.3


EURO Currency:

EURO Currency

EURO Currency StatisticsSPECULATORSCOMMERCIALSSMALL TRADERS
– Percent of Open Interest Longs:30.754.713.7
– Percent of Open Interest Shorts:16.675.86.6
– Net Position:89,976-134,97945,003
– Gross Longs:195,857349,39587,260
– Gross Shorts:105,881484,37442,257
– Long to Short Ratio:1.8 to 10.7 to 12.1 to 1
NET POSITION TREND:
– COT Index Score (3 Year Range Pct):62.637.669.5
– COT Index Reading (3 Year Range):BullishBearishBullish
NET POSITION MOVEMENT INDEX:
– 6-Week Change in Strength Index:-14.415.2-11.9


BRITISH POUND STERLING:

BRITISH POUND STERLING

BRITISH POUND StatisticsSPECULATORSCOMMERCIALSSMALL TRADERS
– Percent of Open Interest Longs:37.337.724.5
– Percent of Open Interest Shorts:18.065.416.1
– Net Position:28,600-41,09112,491
– Gross Longs:55,19055,77136,323
– Gross Shorts:26,59096,86223,832
– Long to Short Ratio:2.1 to 10.6 to 11.5 to 1
NET POSITION TREND:
– COT Index Score (3 Year Range Pct):87.312.392.2
– COT Index Reading (3 Year Range):Bullish-ExtremeBearish-ExtremeBullish-Extreme
NET POSITION MOVEMENT INDEX:
– 6-Week Change in Strength Index:12.6-12.48.4


JAPANESE YEN:

JAPANESE YEN

JAPANESE YEN StatisticsSPECULATORSCOMMERCIALSSMALL TRADERS
– Percent of Open Interest Longs:17.868.112.6
– Percent of Open Interest Shorts:44.829.524.2
– Net Position:-39,36856,281-16,913
– Gross Longs:26,00399,38518,453
– Gross Shorts:65,37143,10435,366
– Long to Short Ratio:0.4 to 12.3 to 10.5 to 1
NET POSITION TREND:
– COT Index Score (3 Year Range Pct):45.861.223.9
– COT Index Reading (3 Year Range):BearishBullishBearish
NET POSITION MOVEMENT INDEX:
– 6-Week Change in Strength Index:-50.748.3-34.7


SWISS FRANC:

SWISS FRANC

SWISS FRANC StatisticsSPECULATORSCOMMERCIALSSMALL TRADERS
– Percent of Open Interest Longs:35.042.122.3
– Percent of Open Interest Shorts:22.718.458.3
– Net Position:4,6719,013-13,684
– Gross Longs:13,29715,9848,479
– Gross Shorts:8,6266,97122,163
– Long to Short Ratio:1.5 to 12.3 to 10.4 to 1
NET POSITION TREND:
– COT Index Score (3 Year Range Pct):80.638.428.4
– COT Index Reading (3 Year Range):Bullish-ExtremeBearishBearish
NET POSITION MOVEMENT INDEX:
– 6-Week Change in Strength Index:-15.530.1-50.4


CANADIAN DOLLAR:

CANADIAN DOLLAR

CANADIAN DOLLAR StatisticsSPECULATORSCOMMERCIALSSMALL TRADERS
– Percent of Open Interest Longs:27.244.227.0
– Percent of Open Interest Shorts:21.759.816.8
– Net Position:10,263-29,27519,012
– Gross Longs:50,90782,57550,410
– Gross Shorts:40,644111,85031,398
– Long to Short Ratio:1.3 to 10.7 to 11.6 to 1
NET POSITION TREND:
– COT Index Score (3 Year Range Pct):63.629.175.5
– COT Index Reading (3 Year Range):BullishBearishBullish
NET POSITION MOVEMENT INDEX:
– 6-Week Change in Strength Index:-4.96.6-6.3


AUSTRALIAN DOLLAR:

AUSTRALIAN DOLLAR

AUSTRALIAN DOLLAR StatisticsSPECULATORSCOMMERCIALSSMALL TRADERS
– Percent of Open Interest Longs:44.730.923.4
– Percent of Open Interest Shorts:38.846.713.5
– Net Position:7,620-20,44612,826
– Gross Longs:57,84039,96430,300
– Gross Shorts:50,22060,41017,474
– Long to Short Ratio:1.2 to 10.7 to 11.7 to 1
NET POSITION TREND:
– COT Index Score (3 Year Range Pct):90.34.085.3
– COT Index Reading (3 Year Range):Bullish-ExtremeBearish-ExtremeBullish-Extreme
NET POSITION MOVEMENT INDEX:
– 6-Week Change in Strength Index:10.1-3.8-10.0


NEW ZEALAND DOLLAR:

NEW ZEALAND DOLLAR

NEW ZEALAND DOLLAR StatisticsSPECULATORSCOMMERCIALSSMALL TRADERS
– Percent of Open Interest Longs:57.923.614.1
– Percent of Open Interest Shorts:40.447.27.9
– Net Position:6,029-8,1612,132
– Gross Longs:20,0028,1454,862
– Gross Shorts:13,97316,3062,730
– Long to Short Ratio:1.4 to 10.5 to 11.8 to 1
NET POSITION TREND:
– COT Index Score (3 Year Range Pct):69.228.077.1
– COT Index Reading (3 Year Range):BullishBearishBullish
NET POSITION MOVEMENT INDEX:
– 6-Week Change in Strength Index:-8.07.8-1.9


MEXICAN PESO:

MEXICAN PESO

MEXICAN PESO StatisticsSPECULATORSCOMMERCIALSSMALL TRADERS
– Percent of Open Interest Longs:35.259.84.5
– Percent of Open Interest Shorts:61.135.23.3
– Net Position:-29,45728,0261,431
– Gross Longs:40,13768,1415,144
– Gross Shorts:69,59440,1153,713
– Long to Short Ratio:0.6 to 11.7 to 11.4 to 1
NET POSITION TREND:
– COT Index Score (3 Year Range Pct):0.0100.049.1
– COT Index Reading (3 Year Range):Bearish-ExtremeBullish-ExtremeBearish
NET POSITION MOVEMENT INDEX:
– 6-Week Change in Strength Index:-16.217.4-12.1


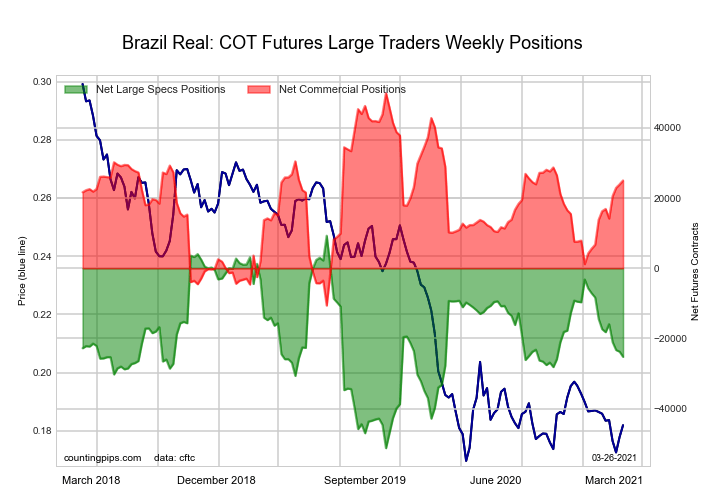
BRAZIL REAL:

BRAZIL REAL

BRAZIL REAL StatisticsSPECULATORSCOMMERCIALSSMALL TRADERS
– Percent of Open Interest Longs:30.962.25.6
– Percent of Open Interest Shorts:80.812.05.9
– Net Position:-23,76723,922-155
– Gross Longs:14,73929,6532,660
– Gross Shorts:38,5065,7312,815
– Long to Short Ratio:0.4 to 15.2 to 10.9 to 1
NET POSITION TREND:
– COT Index Score (3 Year Range Pct):45.457.069.2
– COT Index Reading (3 Year Range):BearishBullishBullish
NET POSITION MOVEMENT INDEX:
– 6-Week Change in Strength Index:-15.416.7-10.1


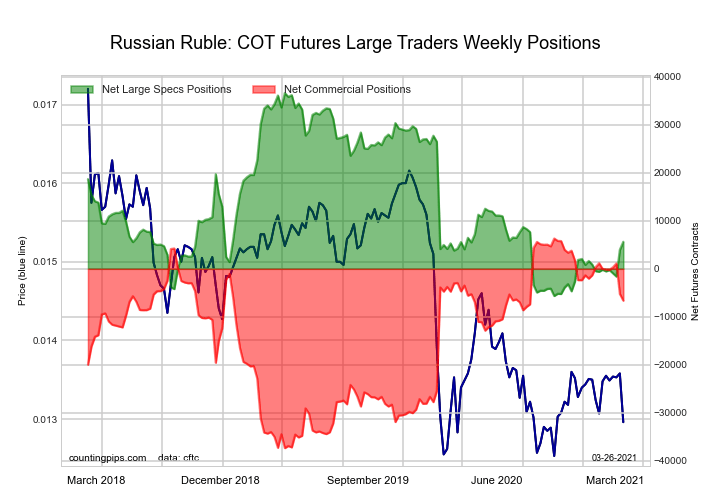
RUSSIAN RUBLE:

RUSSIAN RUBLE

RUSSIAN RUBLE StatisticsSPECULATORSCOMMERCIALSSMALL TRADERS
– Percent of Open Interest Longs:32.760.17.3
– Percent of Open Interest Shorts:20.176.53.3
– Net Position:3,973-5,2241,251
– Gross Longs:10,36919,0762,302
– Gross Shorts:6,39624,3001,051
– Long to Short Ratio:1.6 to 10.8 to 12.2 to 1
NET POSITION TREND:
– COT Index Score (3 Year Range Pct):22.873.684.4
– COT Index Reading (3 Year Range):BearishBullishBullish-Extreme
NET POSITION MOVEMENT INDEX:
– 6-Week Change in Strength Index:10.9-14.660.0


BITCOIN FUTURES:

BITCOIN FUTURES

BITCOIN StatisticsSPECULATORSCOMMERCIALSSMALL TRADERS
– Percent of Open Interest Longs:51.45.132.7
– Percent of Open Interest Shorts:79.81.87.7
– Net Position:-2,6523142,338
– Gross Longs:4,7974793,055
– Gross Shorts:7,449165717
– Long to Short Ratio:0.6 to 12.9 to 14.3 to 1
NET POSITION TREND:
– COT Index Score (3 Year Range Pct):29.378.766.7
– COT Index Reading (3 Year Range):BearishBullishBullish
NET POSITION MOVEMENT INDEX:
– 6-Week Change in Strength Index:0.67.8-2.7


Article By CountingPips.comReceive our weekly COT Reports by Email

*COT Report: The COT data, released weekly to the public each Friday, is updated through the most recent Tuesday (data is 3 days old) and shows a quick view of how large speculators or non-commercials (for-profit traders) were positioned in the futures markets.

The CFTC categorizes trader positions according to commercial hedgers (traders who use futures contracts for hedging as part of the business), non-commercials (large traders who speculate to realize trading profits) and nonreportable traders (usually small traders/speculators).

Find CFTC criteria here: (http://www.cftc.gov/MarketReports/CommitmentsofTraders/ExplanatoryNotes/index.htm).

Did You Make These Trading Mistakes During COVID?

By Orbex

No one is perfect. No trader doesn’t have losses.

We all make mistakes at some point, and it’s important to pay attention to them so we can learn to improve. Someone said, “I don’t make mistakes, I make learning experiences”.

Sometimes it’s good to review what’s happened and find some company with others who faced similar circumstances. Or maybe learn from what others did to improve our own trading.

That someone also said, “learning from your mistakes is good, learning from others’ mistakes is better.” So, let’s see what happened last year and what we can learn from it.

Business as usual

In hindsight, it’s pretty evident to see when things started to go wrong for the markets in 2020.

But at the time, that was a much more difficult proposition. And this isn’t something that’s unique to covid. Whenever a recession comes along, it’s of course hard to anticipate.

It’s also hard to identify the point at which things turn over.

Market corrections are normal, and initial reports are confusing. There tends to be an expectation that corrective action will be taken.

So, traders can find themselves holding on to a “normal” portfolio, instead of a “crisis” portfolio, longer than they should. Trading strategies that worked perhaps for years leading up to the crisis suddenly don’t work, and it’s hard to adjust to the new circumstances.

What warning signs did we miss, that we can look out for during the next recession or financial crisis?

It’s time to panic

Once the crisis became obvious, uncertainty sets in, and many traders decide to sell everything (even if it implies a loss) and just get out of the market. It’s too dangerous now!

Sure; through most of March, even the most educated immunologists didn’t know much about what was happening with the virus. That level of uncertainty made most traders incredibly nervous.

However, a recession is often a great buying opportunity in the market. Of course, you need to reorient your portfolio, and change strategy. But selling out everything and staying away until it’s recovered is missing out on a potential opportunity. And potentially, it means taking losses that were unnecessary.

In fact, many of the stocks that dropped precipitously in March and April recovered or even exceeded their prior market value in a matter of months.

I’m an expert

In a world of uncertainty, some people can become more confident in what little they do know. This can lead them to take risks they might not take otherwise since their usual instinct to listen to other, more experienced, or knowledgeable people doesn’t kick in.

This is precisely because experts are uncertain, and people with less experience often are more certain because they don’t know all the risks.

Confidence is important in trading, but there is a fine line separating it from overconfidence. It’s important to know if you are confident because you thoroughly understand the situation; or because you are unaware of all the risks.

By Orbex

Fibonacci Retracements Analysis 19.03.2021 (AUDUSD, USDCAD)

Article By RoboForex.com

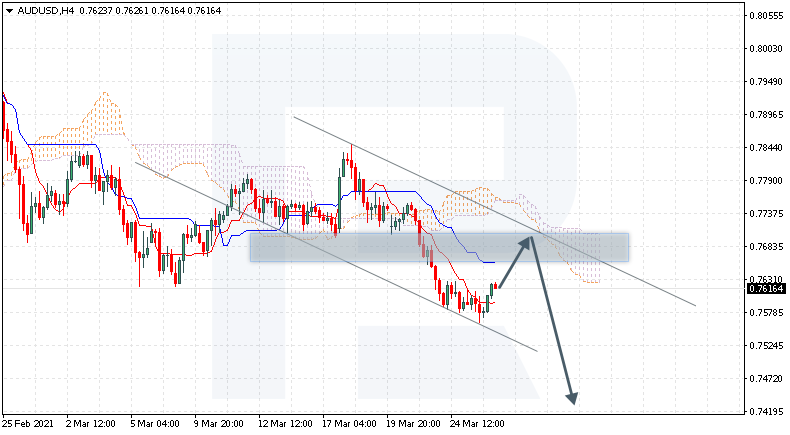
AUDUSD, “Australian Dollar vs US Dollar”

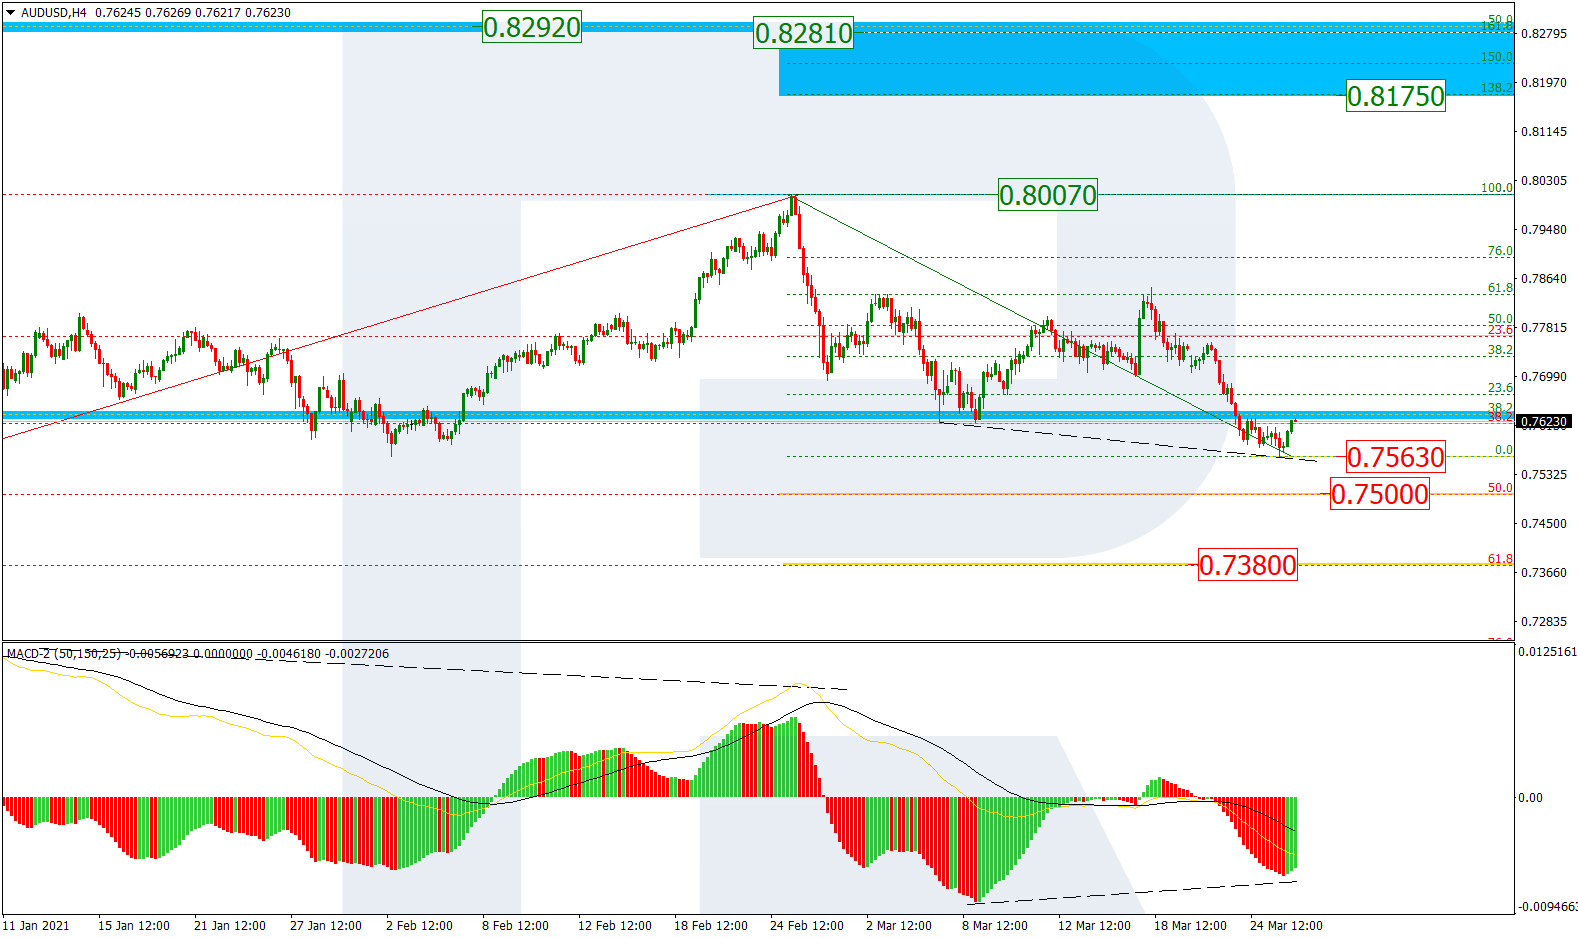
As we can see in the H4 chart, the first “bearish” wave in AUDUSD is experiencing a correction to the upside, which may be over soon. The downside targets may be 50.0% and 61.8% fibo at 0.7500 and 0.7380 respectively. At the same time, despite a divergence on MACD, one shouldn’t exclude a further uptrend to reach the high at 0.8007.

AUDUSD_H4
Risk Warning: the result of previous trading operations do not guarantee the same results in the future

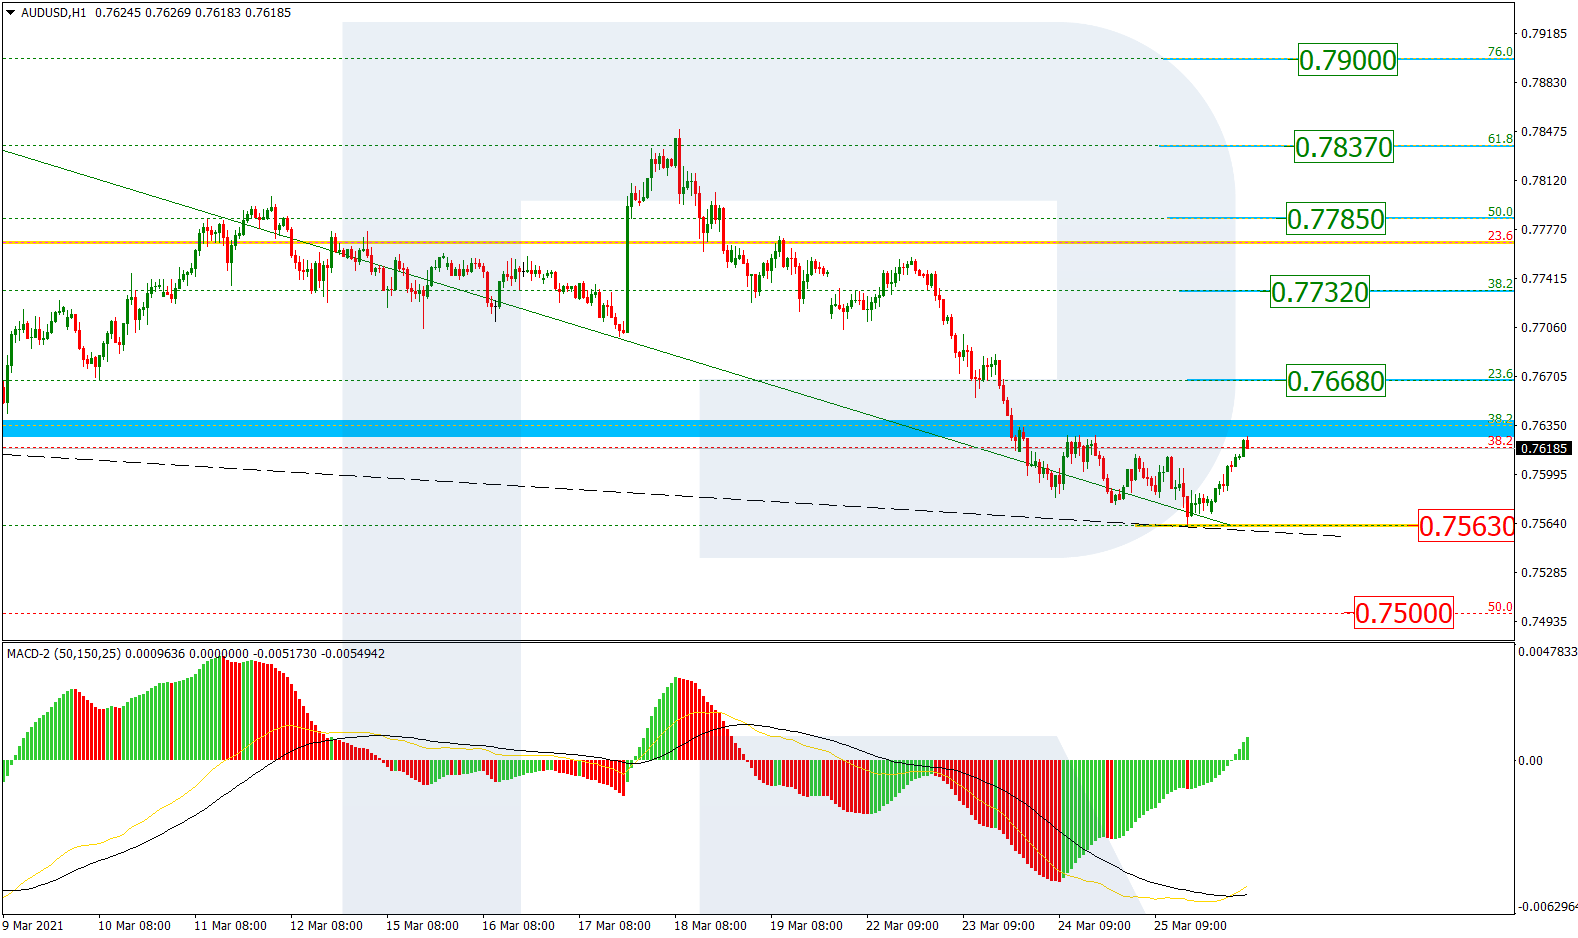
The H1 chart shows a more detailed structure of the current ascending correction, which, after reaching 50.0% fibo, failed to get to 61.8% fibo at 0.7860. Also, there is a local divergence on MACD, which helped the pair to fall towards 50.0% fibo. Later, the price may continue falling to reach 61.8% and 76.0% fibo at 0.7708 and 0.7676 respectively. The resistance is the high at 0.7849.

AUDUSD_H1
Risk Warning: the result of previous trading operations do not guarantee the same results in the future

USDCAD, “US Dollar vs Canadian Dollar”

In the daily chart, USDCAD continues forming the stable downtrend towards the fractal low at 1.2061. At the same time, there is a convergence on MACD, which may hint at a possible pullback to the upside to return to 61.8% fibo at 1.3060.

USDCAD_D1
Risk Warning: the result of previous trading operations do not guarantee the same results in the future

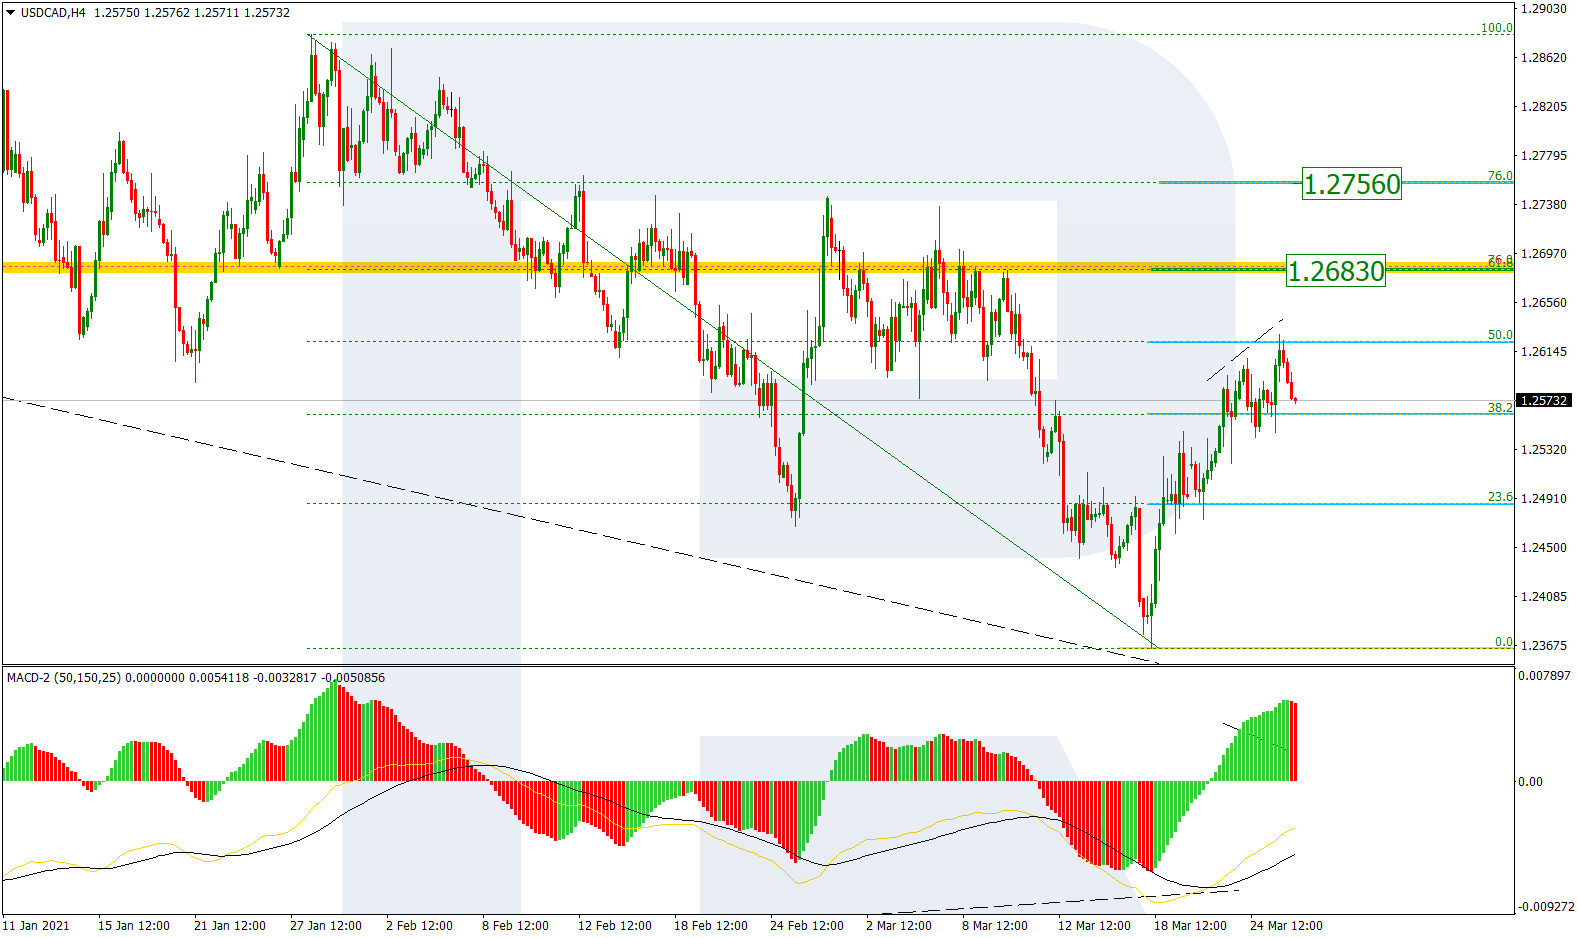
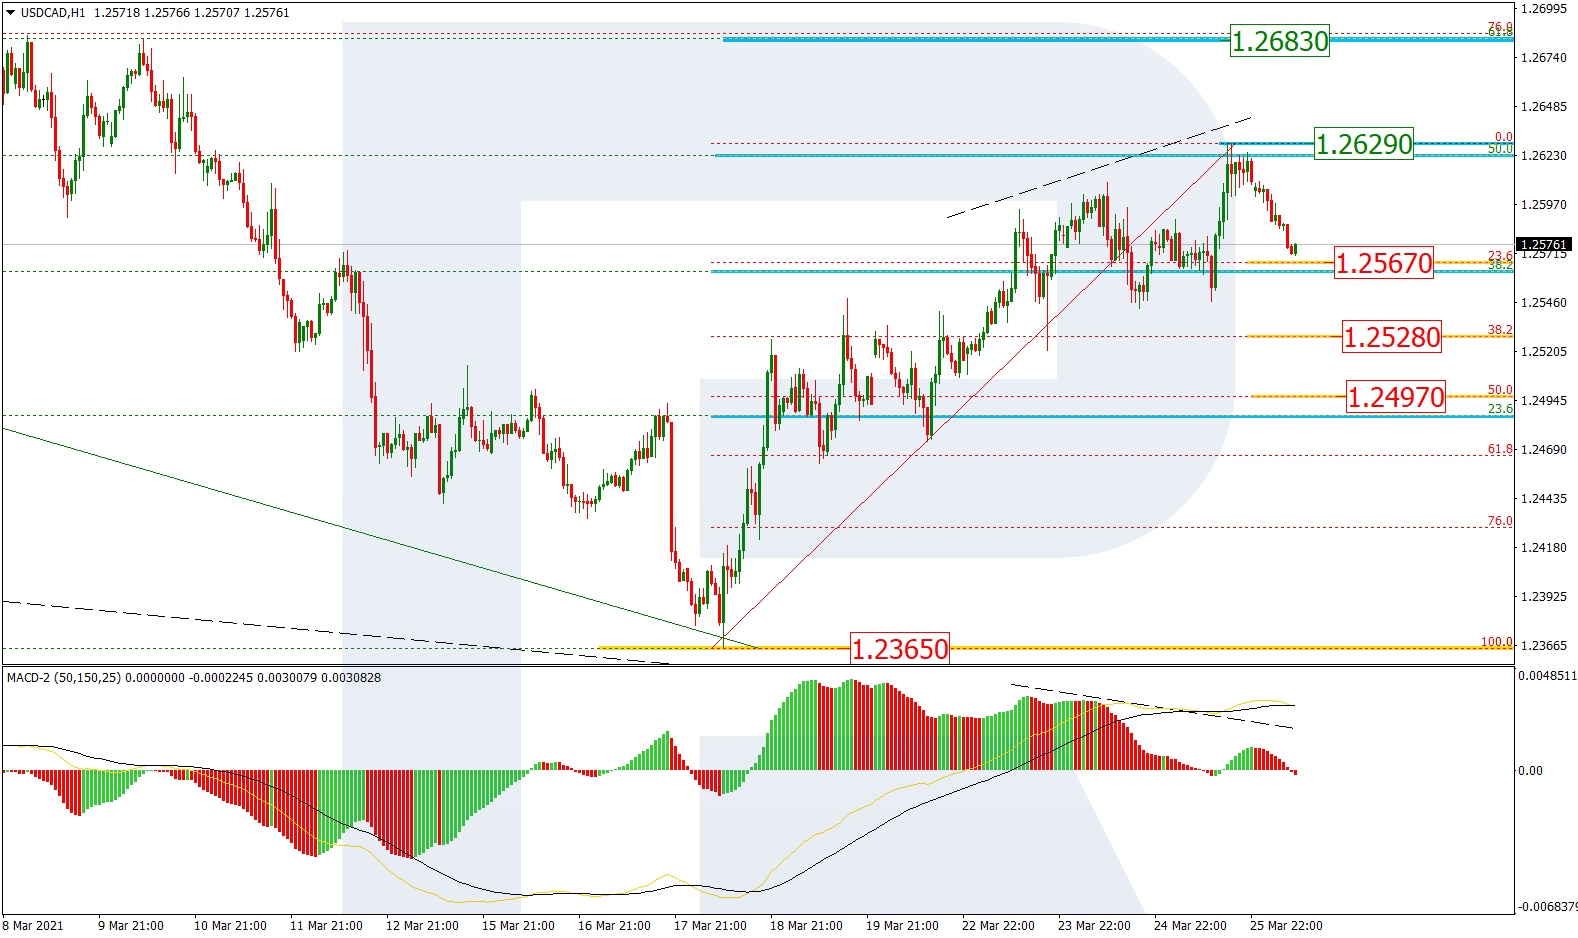
The H1 chart shows a correctional uptrend after a local convergence. The first rising impulse has reached 23.6% fibo and may continue towards 38.2%, 50.0%, and 61.8% fibo at 1.2562, 1.2623, and 1.2683 respectively. The support is the low at 1.2365.

USDCAD_H1

Article By RoboForex.com

Attention!
Forecasts presented in this section only reflect the author’s private opinion and should not be considered as guidance for trading. RoboForex LP bears no responsibility for trading results based on trading recommendations described in these analytical reviews.

Ichimoku Cloud Analysis 19.03.2021 (USDRUB, EURJPY, BRENT)

Article By RoboForex.com

USDRUB, “US Dollar vs Russian Ruble”

USDRUB is trading at 74.22; the instrument is moving above Ichimoku Cloud, thus indicating an ascending tendency. The markets could indicate that the price may test the cloud’s downside border at 73.95 and then resume moving upwards to reach 76.25. Another signal in favor of a further uptrend will be a rebound from the descending channel’s upside border. However, the bullish scenario may be canceled if the price breaks the cloud’s downside border and fixes below 73.55. In this case, the pair may continue falling towards 72.35. To confirm further growth, the asset must break the descending channel’s upside border and fix above 74.75.

USDRUB
Risk Warning: the result of previous trading operations do not guarantee the same results in the future

EURJPY, “Euro vs Japanese Yen”

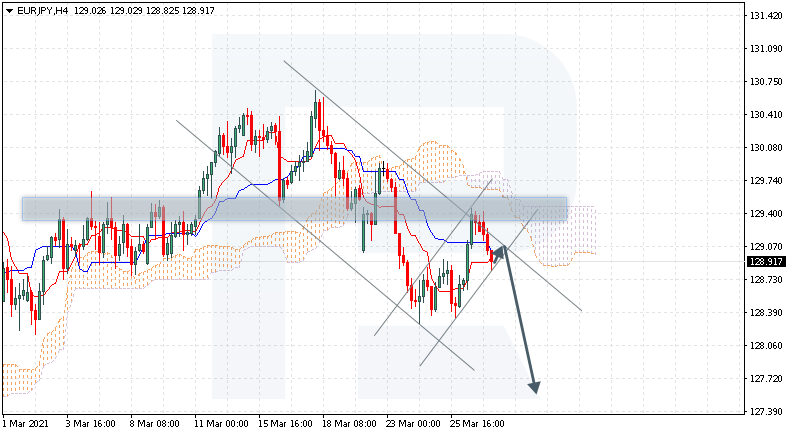
EURJPY is trading at 129.76; the instrument is moving above Ichimoku Cloud, thus indicating an ascending tendency. The markets could indicate that the price may test the cloud’s upside border at 129.55 and then resume moving upwards to reach 131.15. Another signal in favor of a further uptrend will be a rebound from the ascending trendline. However, the bullish scenario may no longer be valid if the price breaks the cloud’s downside border and fixes below 129.25. In this case, the pair may continue falling towards 128.35.

EURJPY
Risk Warning: the result of previous trading operations do not guarantee the same results in the future

BRENT

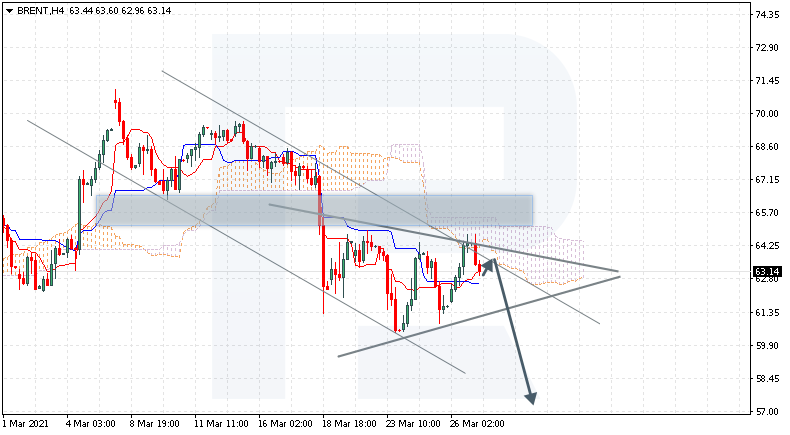
Brent is trading at 63.04; the instrument is moving below Ichimoku Cloud, thus indicating a descending tendency. The markets could indicate that the price may test the cloud’s downside border at 64.75 and then resume moving downwards to reach 54.25. Another signal in favor of a further downtrend will be a rebound from the descending channel’s upside border. However, the bearish scenario may no longer be valid if the price breaks the cloud’s upside border and fixes above 69.75. In this case, the pair may continue growing towards 74.05.

BRENT

Article By RoboForex.com

Attention!
Forecasts presented in this section only reflect the author’s private opinion and should not be considered as guidance for trading. RoboForex LP bears no responsibility for trading results based on trading recommendations described in these analytical reviews.

The Analytical Overview of the Main Currency Pairs on 2021.03.19

by JustForex

The EUR/USD currency pair

Technical indicators of the currency pair:
  • Prev Open: 1.1978
  • Prev Close: 1.1913
  • % chg. over the last day: -0.54%.

On Thursday, the euro fell against the dollar as a sell-off in shares pushed the dollar higher. Also, the market received positive data for the dollar from the manufacturing sector. The Philadelphia Manufacturing Index unexpectedly rose to 51.8 from 23.1 a month earlier, indicating a big difference in the US and Eurozone economies’ recovery.

Trading recommendations
  • Support levels: 1.1882, 1.1834
  • Resistance levels: 1.1990, 1.2113

The main scenario for EUR/USD is sideways trading between 1.1882 and 1.1990. The ADX showed a very weak reaction to Thursday’s decline. At the same time, the position of the MACD below the zero mark and the price-fixing below the moving averages indicate that the pair will continue to decline. Mixed indicators show a flat.

Alternative scenario: if the price manages to consolidate below the level of 1.1882, the pair may return to the decline to 1.1834. A breakdown of 1.1990 could send the pair towards 1.2113.

EUR/USD
There is no news feed for today.

The GBP/USD currency pair

Technical indicators of the currency pair:
  • Prev Open: 1.3958
  • Prev Close: 1.3926
  • % chg. over the last day: -0,23%

The sterling showed little reaction to the appreciation of the dollar, and at the same time, the positive background was unable to support the pair. The Bank of England comments remained unchanged, which slightly disappointed the FX market. But as the decision was not surprising, volatility remained low.

Trading recommendations
  • Support levels: 1.3857, 1.3775
  • Resistance levels: 1.3997, 1.4224

The main scenario for GBP/USD is trading sideways between 1.3857 and 1.3997. The ADX shows a low value of potential and falls on all timeframes from the H1 to the D1. It indicates a high likelihood of the pair staying in the range until the beginning of next week.

Alternative scenario: if the pair consolidates above 1.3997, it may resume growth to the year’s highs. A break at 1.3857 could send the pair towards 1.3775.

GBP/USD
There is no news feed for today.

The USD/JPY currency pair

Technical indicators of the currency pair:
  • Prev Open: 108.85
  • Prev Close: 108.92
  • % chg. over the last day: +0,06%

The dollar-yen pair is beginning to show signs of correction from both the technical and the fundamental sides. Falling stock markets could put significant pressure on the pair. Long shadows at the top of the daily candlesticks indicate strong resistance around 109.34.

Trading recommendations
  • Support levels: 108.35, 107.08
  • Resistance levels: 109.34, 109.86

The main scenario is trading in a sideways range between 109.34 and 108.35. The ADX on the hourly timeframe is kept at the minimum values. The likelihood of a quick resumption of growth in the pair has significantly decreased. The price-fixing below the moving averages more and more indicates a fall in price to the first support level.

An alternative scenario implies the price-fixing below 108.35. In this case, the pair may return to the decline to 107.08. A breakdown of 109.34 will resume growth.

USD/JPY
There is no news feed for today.

The USD/CAD currency pair

Technical indicators of the currency pair:
  • Prev Open: 1.2404
  • Prev Close: 1.2489
  • % chg. over the last day: +0.69%

The Canadian dollar showed the greatest volatility among the G10 currencies, as a result of which the pair broke through two resistance levels at once. The reason for the sharp rise in the pair was the fall in oil prices. New restrictions in Europe amid the pandemic have worsened forecasts of global energy demand.

Trading recommendations
  • Support levels: 1.2446, 1.2364
  • Resistance levels: 1.2512, 1.2589

The main scenario is buying. On Thursday’s northern impulse, the ADX showed a strong reaction. The MACD has sharply entered the positive area, and the price has consolidated above the moving averages. It may indicate a mid-term northern correction.

Alternative scenario: if the price manages to gain a foothold below 1.2466, the pair may resume its southern movement.

USD/CAD
News feed for 2021.03.19:
  • – The Core Retail Sales Index in Canada (m/m) (Jan) at 15:30 (GMT+2).

by JustForex


This article reflects a personal opinion and should not be interpreted as an investment advice, and/or offer, and/or a persistent request for carrying out financial transactions, and/or a guarantee, and/or a forecast of future events.

Oil prices decreased amid new restrictions in Europe. The negotiations between the United States and China show a deep rift

by JustForex

All hopes for better relations between China and the United States were dashed after the first talks began with mutual accusations in Anchorage, Alaska. At the meeting, each side sharply criticized the other for human rights, trade, and international relations. The Center for Strategic and International Studies points out that it is too early to conclude that this meeting is a harbinger of negative events, but it is certainly a rough start, and it shows the full depth of differences between the two countries.

The situation in the negotiations led to sales on Asian stock exchanges. The Shanghai Composite Index decreased by 1% at the beginning of trading, while the CSI 300 decreased by 1.9%. Prior to that, American stock exchanges showed a sharp decline. The Nasdaq 100 decreased by 3.1% and the S&P 500 lost 1.5%.

US Treasury bonds yield stabilized after a sharp rise in treasuries to 1.75% for the first time since January 2020. Oil prices have lost about 10%, partly due to fears of new restrictions in Europe related to the pandemic. Against this background, the US dollar rose.

Investors have begun the preparation for “Black Friday”, as in addition to the negative political background, the expiration of futures contracts and options is there to begin. This may strengthen the bearish mood in the market.

Nevertheless, hedge funds believe that this is only a short-term correction. Tribeca Investment Partners points out that the economic recovery is in full swing, and central banks around the world are supporting it, keeping monetary policy soft. The aggregate fundamental factors suggest that this is only a short-term fixation of profits, and stock market performance remains bullish.

Main market quotes:

S&P 500 (F) 3,919.62 +13.62 (+0.35%)

Dow Jones 32,862.30 -153.07 (-0.46%)

DAX 14,715.25 -60.27 (-0.41%)

FTSE 100 6,710.79 -68.89 (-1.02%)

USD Index 91.690 -0.180 (-0.20%)

Important events:
  • – Australia Retail Sales (m/m) at 02:30 (GMT+2);
  • – BoJ Press Conference at 04:30 (GMT+2);
  • – Canada Core Retail Sales (m/m) (Jan.) at 15:30 (GMT+2).

by JustForex


This article reflects a personal opinion and should not be interpreted as an investment advice, and/or offer, and/or a persistent request for carrying out financial transactions, and/or a guarantee, and/or a forecast of future events.