Archive for Forex and Currency News – Page 297

The Analytical Overview of the Main Currency Pairs on 2021.03.24

by JustForex

The EUR/USD currency pair

Technical indicators of the currency pair:
  • Prev Open: 1.1933
  • Prev Close: 1.1848
  • % chg. over the last day: -0.71%

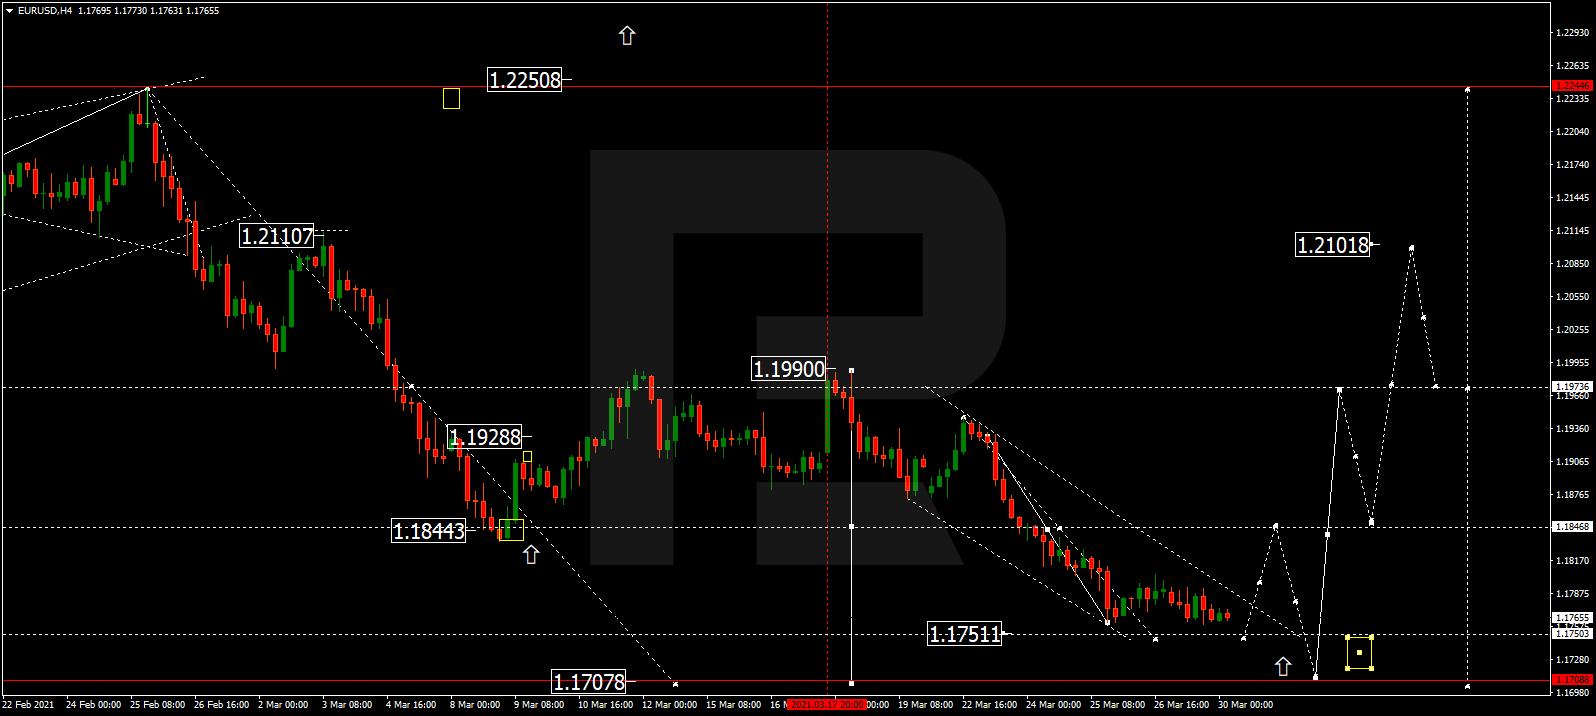
On Tuesday, the euro showed its strongest fall since March 4. The main reason was the growth of the US dollar, as demand for it increased due to the fall of risky assets. Also, traders are worried about the escalation of the trade conflict between the EU and the UK.

Trading recommendations
  • Support levels: 1.1834, 1.1746
  • Resistance levels: 1.1894, 1.1990

The main scenario for EUR/USD is selling. The ADX shows a strong rise in bearish pressure on the pair. The trend indicators are not at the maximum, which means that the pair has not reached the oversold area yet and may continue to fall. The MACD and moving average direction confirm this scenario.

Alternative scenario: if the price consolidates above the level of 1.1894, the pair may return to the previous range.

EUR/USD
News feed for 2021.03.24:
  • – The German Manufacturing Purchasing Managers’ Index (PMI) (Mar) at 10:30 (GMT+2);
  • – The Eurozone Purchasing Managers’ Index (PMI) (Mar) at 11:00 (GMT+2);
  • – The US Durable Goods Orders (m/m) (Feb) at 14:30 (GMT+2).

The GBP/USD currency pair

Technical indicators of the currency pair:
  • Prev Open: 1.3857
  • Prev Close: 1.3747
  • % chg. over the last day: -0,79%

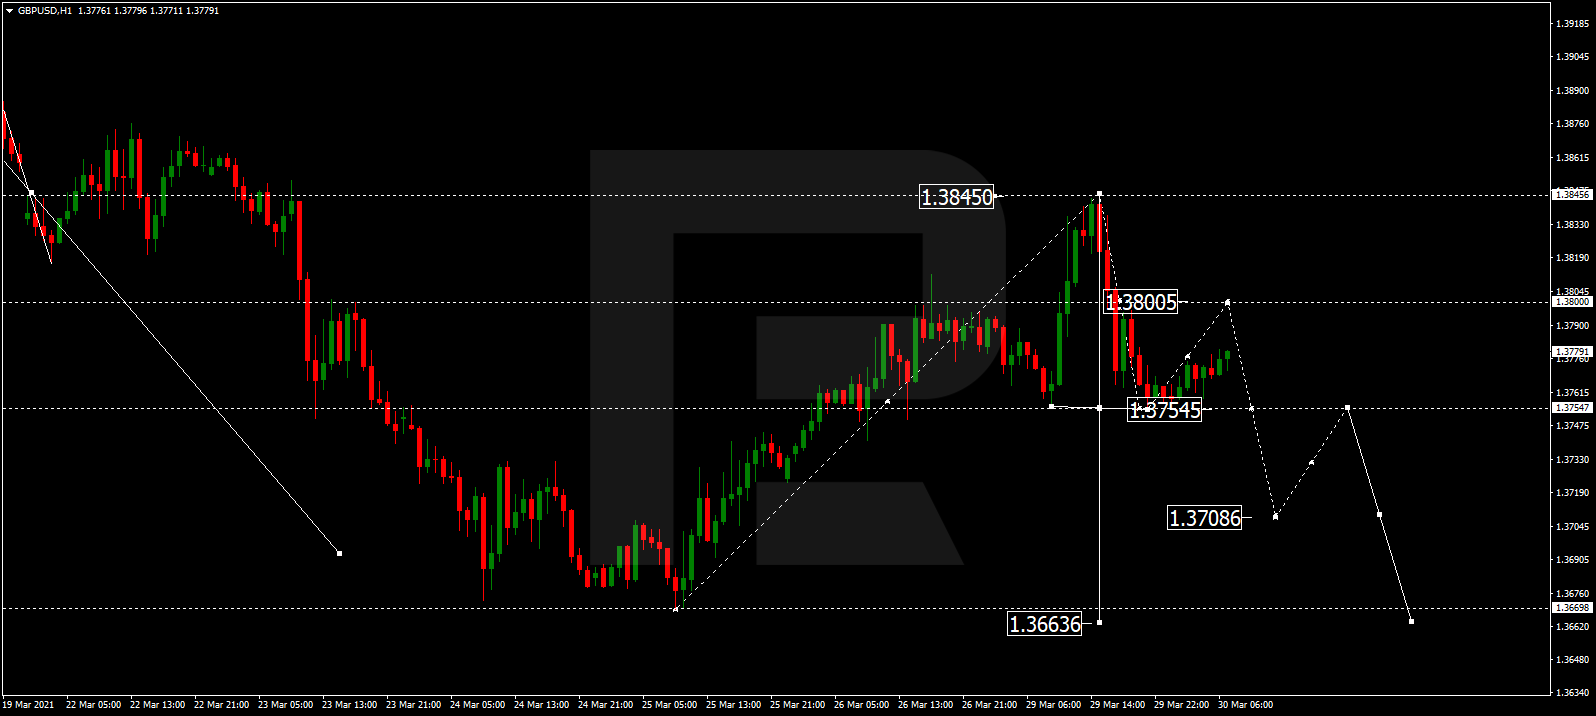
The fall of the sterling turned out to be more significant compared to the euro. In addition to the dollar growth, the pair is under pressure from the escalation of the EU-UK trade dispute. The EU authorities promise to tighten the rules for the supply of vaccines to other countries, and the UK is becoming a potential main target.

Trading recommendations
  • Support levels: 1.3680, 1.3610
  • Resistance levels: 1.3875, 1.3997

The main scenario for GBP/USD is selling. The bearish direction has strengthened not only in the short term but also in the medium term, as the ADX shows a significant rise in bearish pressure on the H1 and the H4. For the second day in a row, the pair breaks through significant support levels, which indicates a likely continuation of the steep dive.

Alternative scenario: if the pair consolidates above 1.3809, the pound may move upward to 1.3875.

GBP/USD
News feed for 2021.03.24:
  • – The UK Consumer Prices Index (CPI) (y/y) (Feb) at 09:00 (GMT +2);
  • – The UK Services Purchasing Managers’ Index (PMI) (Mar) at 11:30 (GMT +2).

The USD/JPY currency pair

Technical indicators of the currency pair:
  • Prev Open: 108.82
  • Prev Close: 108.61
  • % chg. over the last day: -0,20%

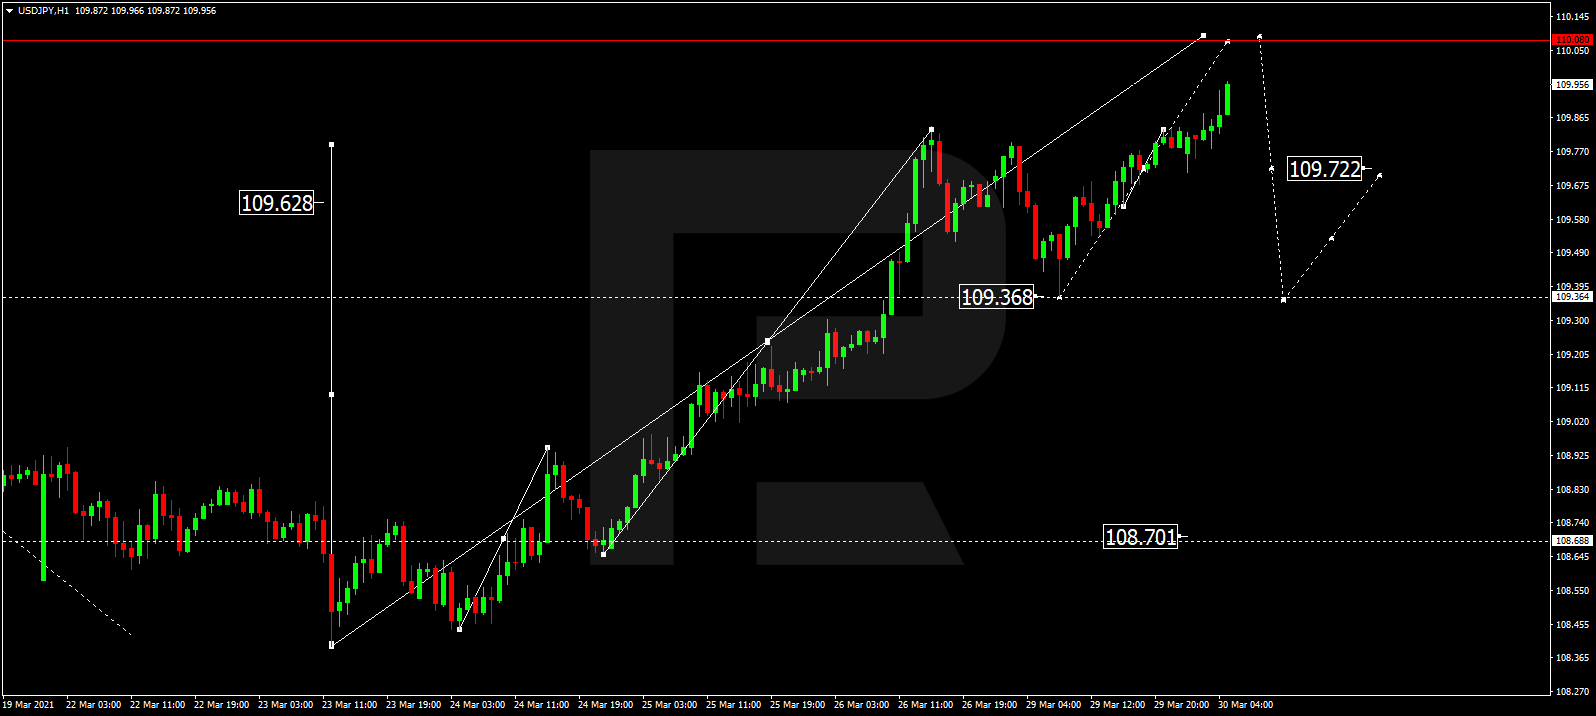
The dollar-yen pair is still showing low volatility, despite the growing anxiety in the stock markets. The dollar’s growth supports the pair, but it could not completely neutralize the effect of the fall in stock prices. As a result, the pair closed slightly in the red.

Trading recommendations
  • Support levels: 108.35, 107.08
  • Resistance levels: 109.34, 109.86

The main scenario is trading in a sideways range between 109.34 and 108.35. The ADX on the hourly timeframe is still close to the minimum values. The MACD fell into the negative area, and the price is below the moving averages. It indicates a predominance of bears, but the first support level may limit the decline.

An alternative scenario implies the price-fixing below 108.35. In this case, the pair may fall to 107.08. A breakout of 109.34 would resume growth.

USD/JPY
News feed for 2021.03.24:
  • – The US Durable Goods Orders (m/m) (Feb) at 14:30 (GMT+2).

The USD/CAD currency pair

Technical indicators of the currency pair:
  • Prev Open: 1.2519
  • Prev Close: 1.2578
  • % chg. over the last day: +0.47%

The pair continues to show strong corrective gains as oil prices plummet. WTI has lost about $ 4 in a day, which is a significant decline. Due to the growth of the dollar index, the outlook for the pair remains positive.

Trading recommendations
  • Support levels: 1.2574, 1.2446
  • Resistance levels: 1.2745, 1.2844

The main scenario is buying. The ADX declined during the Asian session, indicating the likelihood of a corrective pullback to the 100 SMA moving average at 1.2509. However, the main direction will remain north as long as the price is above this level and buying is safer.

Alternative scenario: if the price manages to gain a foothold below 1.2509, the pair may resume its southern movement.

USD/CAD
There is no news feed for today.

by JustForex


This article reflects a personal opinion and should not be interpreted as an investment advice, and/or offer, and/or a persistent request for carrying out financial transactions, and/or a guarantee, and/or a forecast of future events.


Can the EU’s tougher vaccine export rules save the euro?

By Han Tan Market Analyst, ForexTime

Today, the European Union is set to unveil new rules that govern how much of its Covid-19 vaccine is exported. The goal is to help the continent ramp up its own vaccination drive, which is somewhat ironic considering that the EU is one of the world’s largest producers of the Covid-19 vaccine.

The bloc’s vaccination rollout far lags behind other major peers. According to Bloomberg data, here’s how the EU fares against the US and the UK in administering at least one dose of the Covid-19 vaccine:

  • EU: 9.1% of its population
  • US: 25.3% of its population
  • UK: 42.4% of its population

At the current rate, the US needs just 5 more months to vaccinate 75% of its population. The UK is set to accomplish the same within 4 months.

The EU however would need 17 months before 75% of its population receives the Covid-19 vaccine.

Vaccination lag, lockdowns weigh on euro

Investors are cognizant of the rationale that economic conditions can take bigger strides towards pre-pandemic levels once enough of the population has the vaccine. The vaccine would inject the local population with more confidence to eat out, travel, and just return closer to life overall as it once was.  The slower vaccination rollout suggests that the EU economy would need a longer time to recover and lag behind other major economies.

The lockdowns and other virus-curbing measures that are still in place in major European economies are adding to the currency’s woes. Germany has announced a 5-day lockdown over Easter, while parts of France and Italy have also reimposed tighter restrictions for a month.

Economic data may offer little saving grace for euro’s near-term prospects

Also today, investors will be monitoring the Eurozone’s preliminary PMI readings for March. Although conditions in the manufacturing sector are set to keep expanding and recovering, which is PMI reading above the 50 mark, the services sector is set to continue languishing in contractionary territory.

Barring a positive surprise in the data, the bloc’s currency is unlikely to find much solace in the economic prints to be released today.

Such dampened economic prospects are not lost on euro traders. No surprise then that the euro has a year-to-date decline against most of its G10 peers:

While greater access to Covid-19 vaccines could alleviate some of the immediate selling pressure on the euro, more positive news is needed to restore the optimism surrounding the shared currency.

EURUSD woes to continue following ‘death cross’

From a technical perspective, it is also difficult to argue for euro strength over the near-term.

EURUSD’s 50-day simple moving average (SMA) has now crossed below its 100-day counterpart. Exactly a week ago, its 30 SMA had crossed below the 100 SMA, forming a ‘death cross’ – a technical event which indicates that more pain for the bloc’s currency could be on its way.

With spot prices on the world’s most-traded currency pair also testing its 200-day SMA and threatening to set a new 2021 low, a significant break below this key support level around 1.184 could mark 1.1750 as the next port of call for Euro bears. Note that the 1.1750 region was also the lower bound for the currency pair’s trading range back in August.

With momentum still pointing south, coupled with the fact that its 14-day relative strength index has yet to hit the 30 line which is the threshold for oversold territory, it suggests that the Euro has more downside to explore over the immediate term.

As for the euro index, which is an equally-weighted index comparing the euro’s performance versus the:

… its downward trend also appears firmly intact, with this index having the tendency to hug the lower bound of its Bollinger band for much of this year.


Disclaimer: The content in this article comprises personal opinions and should not be construed as containing personal and/or other investment advice and/or an offer of and/or solicitation for any transactions in financial instruments and/or a guarantee and/or prediction of future performance. ForexTime (FXTM), its affiliates, agents, directors, officers or employees do not guarantee the accuracy, validity, timeliness or completeness, of any information or data made available and assume no liability as to any loss arising from any investment based on the same.


Forex-Time-LogoArticle by ForexTime

ForexTime Ltd (FXTM) is an award winning international online forex broker regulated by CySEC 185/12 www.forextime.com

Intraday Market Analysis – Awaiting A Breakout

By Orbex

EURUSD consolidates near the support area

eurusd

The US dollar stayed subdued as Treasury yields retreated on Monday, relieving pressure on its European counterpart.

The pair has fallen back from the double top at 1.1990 after it went into an overbought situation. The euro is looking for support while hovering above the major demand area around 1.1830.

The current consolidation is an opportunity to build up momentum. The resistance at 1.1990 is a tough nut to crack but a bullish breakout could send the price towards 1.2050.

GER 30 retreats after being overbought

ger30

Equity markets are treading water at the start of the week as investors remain cautious about the inflation outlook.

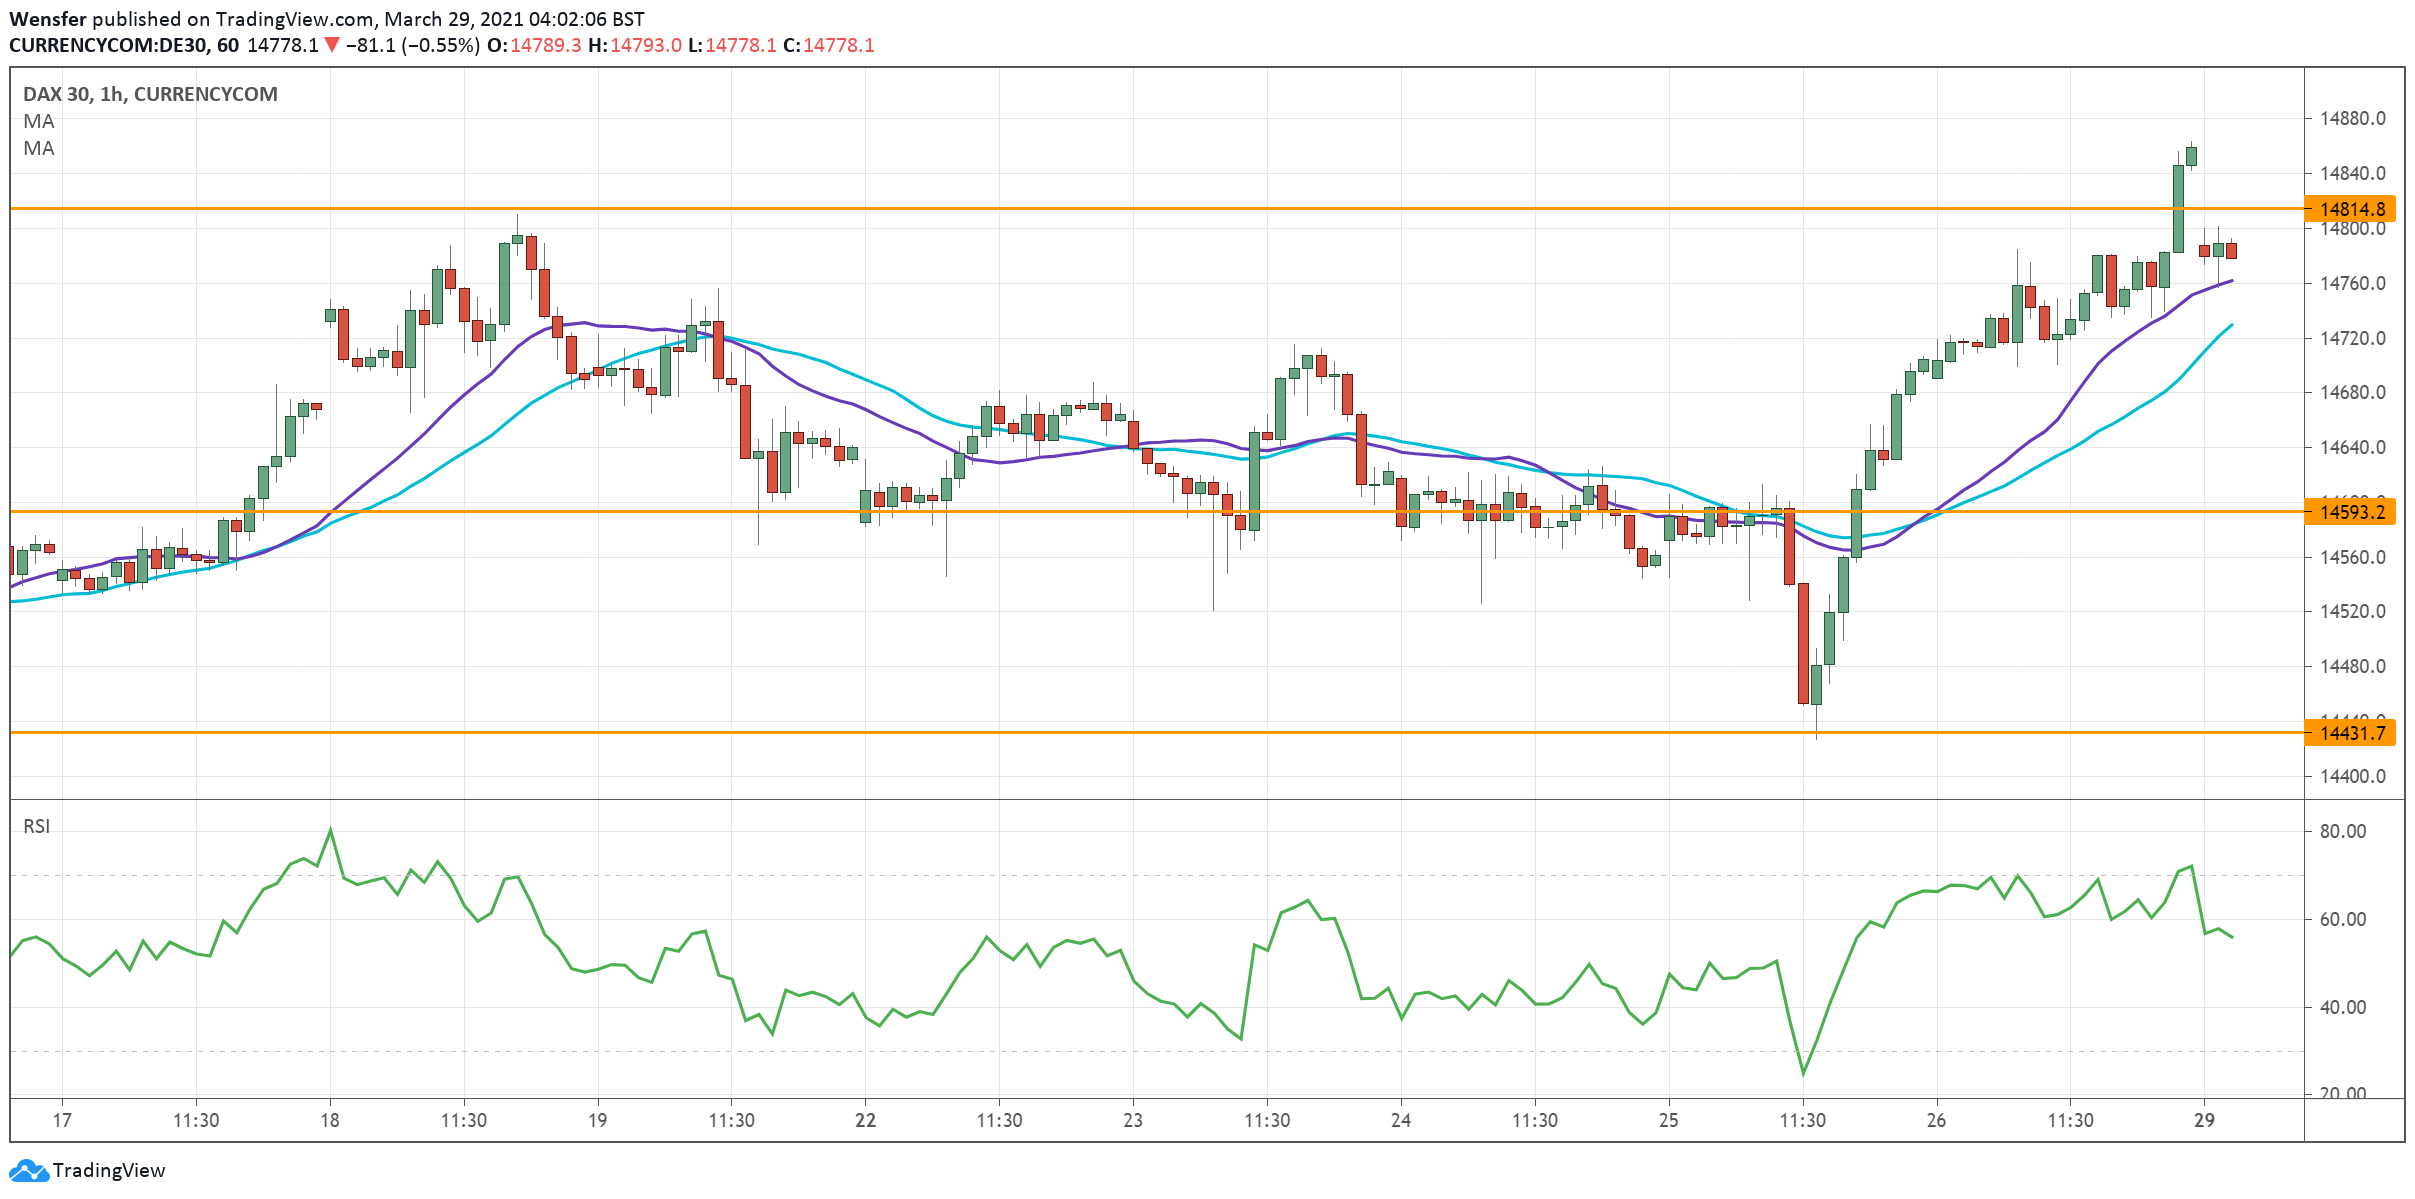
The DAX 30 has pulled back from the all-time high at 14810 after the RSI continuously ventured into the overbought area. Instead of chasing the momentum buyers may likely wait for a discount before jumping on the trend.

The previous low at 14400 coincides with the rising trendline and could be a key zone of congestion where trend-followers would bid up the index.

USOIL recovers from daily support

usoil

The oil price has recouped some losses from concerns about vaccine rollouts and new lockdowns in parts of Europe.

The RSI has recovered into the neutral zone as the price found support in the demand area around 58.50 on the daily chart. WTI is now at a crossroad as a deeper retracement could trigger a reversal.

Otherwise, what is happening could be a mere three-wave correction. As for now, the 38.2% Fibonacci level (62.00) is the next resistance.

The uptrend may only resume if buyers can push through 64.80 once again.

By Orbex

Ichimoku Cloud Analysis 23.03.2021 (EURGBP, GBPUSD, AUDUSD)

Article By RoboForex.com

EURGBP, “Euro vs Great Britain Pound”

EURGBP is trading at 0.8623; the instrument is moving above Ichimoku Cloud, thus indicating an ascending tendency. The markets could indicate that the price may test the cloud’s upside border at 0.8575 and then resume moving upwards to reach 0.8720. Another signal in favor of a further uptrend will be a rebound from the descending channel’s upside border. However, the bullish scenario may no longer be valid if the price breaks the cloud’s downside border and fixes below 0.8530. In this case, the pair may continue falling towards 0.8440. To confirm further growth, the asset must break the upside border of a Double Bottom reversal pattern and fix above 0.8765.

EURGBP
Risk Warning: the result of previous trading operations do not guarantee the same results in the future

GBPUSD, “Great Britain Pound vs US Dollar”

GBPUSD is trading at 1.3820; the instrument is moving below Ichimoku Cloud, thus indicating a descending tendency. The markets could indicate that the price may test Tenkan-Sen and Kijun-Sen at 1.3835 and then resume moving downwards to reach 1.3645. Another signal in favor of a further downtrend will be a rebound from the downside border of the Triangle pattern. However, the bearish scenario may no longer be valid if the price breaks the cloud’s upside border and fixes above 1.3965. In this case, the pair may continue growing towards 1.4055. To confirm further decline, the asset must break the support level and fix below 1.3755.

GBPUSD
Risk Warning: the result of previous trading operations do not guarantee the same results in the future

AUDUSD, “Australian Dollar vs US Dollar”

AUDUSD is trading at 0.7673; the instrument is moving below Ichimoku Cloud, thus indicating a descending tendency. The markets could indicate that the price may test the cloud’s downside border at 0.7710 and then resume moving downwards to reach 0.7620. Another signal in favor of a further downtrend will be a rebound from the rising channel’s downside border. However, the bearish scenario may no longer be valid if the price breaks the cloud’s upside border and fixes above 0.7810. In this case, the pair may continue growing towards 0.7915.

AUDUSD

Article By RoboForex.com

Attention!
Forecasts presented in this section only reflect the author’s private opinion and should not be considered as guidance for trading. RoboForex LP bears no responsibility for trading results based on trading recommendations described in these analytical reviews.

Fibonacci Retracements Analysis 23.03.2021 (EURUSD, USDJPY)

Article By RoboForex.com

EURUSD, “Euro vs US Dollar”

As we can see in the daily chart, the asset continues the “bearish” phase after a divergence on MACD. After falling and reaching 23.6% fibo, the pair has started consolidating but may soon resume falling towards 38.2%, 50.0%, and 61.8% fibo at 1.1695, 1.1493, and 1.1292 respectively. The key resistance remains at the high at 1.2350.

EURUSD_D1
Risk Warning: the result of previous trading operations do not guarantee the same results in the future

The H4 chart shows a more detailed structure of the current short-term correction after the previous descending impulse, which has already tested 38.2% fibo twice and may yet continue towards 50.0% fibo at 1.2040. After finishing the correction, the asset may resume falling to reach and break the low at 1.1835. Later, the asset may continue its decline towards the mid-term targets. The key resistance is the fractal high at 1.2243.

EURUSD_H4
Risk Warning: the result of previous trading operations do not guarantee the same results in the future

USDJPY, “US Dollar vs. Japanese Yen”

The H4 chart shows a slow descending correction after a divergence on MACD. At the same time, one should note that after breaking 61.8% fibo, the previous uptrend has failed to reach 76.0% fibo at 109.53. The long-term upside target is the fractal high at 111.71. The key correctional target right now is the support at 50.0% fibo at 107.15.

USDJPY_H4
Risk Warning: the result of previous trading operations do not guarantee the same results in the future

In the H1 chart, USDJPY is correcting to the downside and may reach 23.6, 38.2%, and 50.0% fibo at 108.31, 107.67, and 107.15 respectively. A breakout of the current high at 109.36 may complete the correction.

USDJPY_H1

Article By RoboForex.com

Attention!
Forecasts presented in this section only reflect the author’s private opinion and should not be considered as guidance for trading. RoboForex LP bears no responsibility for trading results based on trading recommendations described in these analytical reviews.

The Analytical Overview of the Main Currency Pairs on 2021.03.23

by JustForex

The EUR/USD currency pair

Technical indicators of the currency pair:
  • Prev Open: 1.1880
  • Prev Close: 1.1933
  • % chg. over the last day: +0.45%

On Friday, the euro rose slightly. The pair continues to trade in a narrow range, showing no signs of exiting it. No important economic events are expected. Jerome Powell will address Congress with a report on monetary policy. The market expects no changes in it.

Trading recommendations
  • Support levels: 1.1882, 1.1834
  • Resistance levels: 1.1990, 1.2113

The main scenario for EUR/USD is trading in the lateral range between 1.1882 and 1.1990. The ADX is at a minimum, which indicates no pressure in either direction. Only the position of the MACD and moving averages indicates a slight increase. But growth may be limited by the first resistance level.

Alternative scenario: if the price manages to consolidate below the level of 1.1882, the pair may return to the decline to 1.1834. A breakout of 1.1990 could send the pair towards 1.2113.

EUR/USD
News feed for 2021.03.23:
  • – Federal Reserve Chairman Jerome Powell’s Speech at 16:00 (GMT+2);
  • – The US New Home Sales (Feb) at 16:00 (GMT+2);
  • – FOMC Member Lael Brainard’s Speech at 16:00 (GMT+2).

The GBP/USD currency pair

Technical indicators of the currency pair:
  • Prev Open: 1.3834
  • Prev Close: 1.3856
  • % chg. over the last day: +0,16%

The volatility in the sterling has dropped significantly. The pair is trading near the moving averages on the daily chart. These are important levels where the issue of further growth or the beginning of a deep correction is decided. Important data on wages in the UK is planned for today, but it is unlikely to cause strong movements.

Trading recommendations
  • Support levels: 1.3775, 1.3680
  • Resistance levels: 1.3875, 1.3997

The main scenario for GBP/USD is selling. The bearish direction remains a priority in the short term as the ADX begins to show signs of increasing bearish strength. The support level was broken, and the price firmly consolidated below.

Alternative scenario: if the pair consolidates above 1.3895, the pair may resume growth to 1.3997.

GBP/USD
News feed for 2021.03.23:
  • – Average Salary Including bonuses in the UK (Jan) at 09:00 (GMT+2);
  • – The UK Jobless Claims (Feb) at 09:00 (GMT+2);
  • – The UK industrial Orders Index (CBI) (Mar) at 13:00 (GMT+2).

The USD/JPY currency pair

Technical indicators of the currency pair:
  • Prev Open: 108.62
  • Prev Close: 108.83
  • % chg. over the last day: +0,11%

In the dollar-yen pair, volatility has been declining for the sixth session in a row. Stock markets were up slightly on Monday. But they have been declining in the Asian session on Tuesday. Bond yields have stabilized. Treasuries are in the area of 1.68%.

Trading recommendations
  • Support levels: 108.35, 107.08
  • Resistance levels: 109.34, 109.86

The main scenario is trading in a sideways range between 109.34 and 108.35. The ADX on the hourly timeframe fell to the minimum values. The MACD is near zero, and the price is near the moving averages. The instrument has lost all signs of correction.

An alternative scenario implies the price-fixing below 108.35. In this case, the pair may return to the decline to 107.08. A breakout of 109.34 will resume growth.

USD/JPY
News feed for 2021.03.23:
  • – Federal Reserve Chairman Jerome Powell’s Speech at 16:00 (GMT+2);
  • – The US New Home Sales (Feb) at 16:00 (GMT+2);
  • – FOMC Member Lael Brainard’s Speech at 16:00 (GMT+2).

The USD/CAD currency pair

Technical indicators of the currency pair:
  • Prev Open: 1.2518
  • Prev Close: 1.2520
  • % chg. over the last day: +0.02%

The Canadian dollar will continue its correctional growth in light of the continuing decline in oil prices. The outlook for commodity markets remains negative in the medium term, as European countries such as Germany and France are expanding quarantine measures.

Trading recommendations
  • Support levels: 1.2446, 1.2364
  • Resistance levels: 1.2546, 1.2589

The main scenario is buying. The slight northern impulse on Tuesday triggered a strong ADX reaction. This is a sign that the price may break the first resistance level. The MACD is above zero, and the price is above the moving averages. By a combination of factors, there is an increasing northern signal.

Alternative scenario: if the price manages to gain a foothold below 1.2477, the pair may resume its southern movement.

USD/CAD
There is no news feed for today.

by JustForex


This article reflects a personal opinion and should not be interpreted as an investment advice, and/or offer, and/or a persistent request for carrying out financial transactions, and/or a guarantee, and/or a forecast of future events.

In the UK, the unemployment rate rose less than expected

by JustForex

On Monday, share prices rose slightly amid stabilization of government bonds yield. US Treasuries retreated from the 1.70% level and are 2 basis points lower. Today, the attention of investors will be fixed on the joint speech of Janet Yellen and Jerome Powell in the US Congress. As expected, politicians will express their previous opinion on the need to support the economy by maintaining a soft monetary policy.

This morning, the Office for National Statistics reported that UK unemployment rose less-than-expected during the quarantine as the government’s dismissal program saved workplaces. The number of people looking for job opportunities rose from 11,000 to 1.7 million, bringing the unemployment rate to 5%. Economists had expected the rate to be 5.2%. The number of employed people decreased by 147 000 people.

The forecast for the growth of unemployment has changed. The fourth-quarter unemployment rate is now expected to be 6.5%, but not 7.5% as it was specified in the November forecast. This is also well below the peak of recessions in previous decades, despite the fact that the economy experienced its deepest recession in three centuries last year.

Meanwhile, new restrictions are being introduced in Germany. Chancellor Angela Merkel and regional leaders have agreed to introduce a new lockdown during Easter celebrations to try to counter the third wave of Covid-19.

According to the plan, all stores will be closed from April 1 for five days, with the exception of grocery stores, which will open on April 3. Citizens will be encouraged to stay at home, private gatherings are limited to one household and a maximum of five people. Public gatherings are prohibited.

Against this background, oil prices continue to remain under pressure, losing just over 1% at the opening of trading in the Asian session. S P 500 futures decreased after a slight increase on Monday.

Main market quotes:

S&P 500 (F) 3,921.38 -8.62 (-0,22%)

Dow Jones 32,731.20 +103.23 (+0,32%)

DAX 14,657.21 +36.21 (+0,25%)

FTSE 100 6,726.10 +17.39 (+0,26%)

USD Index 91.983 +0.242 (+0,26%)

Important events:
  • – UK Average Salary Level including bonuses (Jan) at 09:00 (GMT+2);
  • – United Kingdom Claimant Count Change (Feb) at 09:00 (GMT+2);
  • – United Kingdom CBI Industrial Trends Orders (Mar) at 13:00 (GMT+2);
  • – Federal Reserve Chair Jerome Powell’s speech at 16:00 (GMT+2);
  • – US New Home Sales (Feb) at 16:00 (GMT+2);
  • – FOMC Member Brainard’s speech at 16:00 (GMT+2).

by JustForex


This article reflects a personal opinion and should not be interpreted as an investment advice, and/or offer, and/or a persistent request for carrying out financial transactions, and/or a guarantee, and/or a forecast of future events.

Dollar Firms Ahead Of Powell-Yellen Testimony

By Lukman Otunuga Research Analyst, ForexTime

Fasten your seatbelts folks, the next few days could be volatile for the Dollar.

This week is jampacked with a host of speeches from US Fed officials, including the joint congressional testimony by Fed Chair Jerome Powell and Treasury Secretary Yellen later today. Normally non-events for the market, these speeches could become real shakers if fresh insight is offered on monetary policy and the health of the US economy.

Powell is widely expected to reiterate the central bank’s plan to support the recovery “for as long as it takes” during his testimony to Congress. Given the market sensitivity to the developments in the bond markets, Powell and Fed officials may be forced to choose their words wisely.

What about the Dollar?

The Dollar entered Tuesday on a positive note, almost clawing back all the losses from the previous session. Prices are approaching the 92.10 resistance level as of writing with a breakout on the horizon.

The upside could face obstacles in the short term if Powell reiterates a dovish tone during his testimony. However, bulls are likely to remain supported by rising bond yields in the medium term. Appetite towards the Dollar has been sweetened by the speedy rollouts of Covid-19 vaccines while Biden’s $1.9 trillion stimulus continues to brighten the growth outlook, driving up bond yields.

Focusing on the technicals, prices are trading above the 20 Simple Moving Average while the MACD trades above the 0 level. A solid breakout above 92.10 could open the doors towards 92.50 and 93.00, respectively. Should prices sink back below 91.70, the DXY could re-test the 91.35 support and 90.75.


Disclaimer: The content in this article comprises personal opinions and should not be construed as containing personal and/or other investment advice and/or an offer of and/or solicitation for any transactions in financial instruments and/or a guarantee and/or prediction of future performance. ForexTime (FXTM), its affiliates, agents, directors, officers or employees do not guarantee the accuracy, validity, timeliness or completeness, of any information or data made available and assume no liability as to any loss arising from any investment based on the same.


Forex-Time-LogoArticle by ForexTime

ForexTime Ltd (FXTM) is an award winning international online forex broker regulated by CySEC 185/12 www.forextime.com

Forex Technical Analysis & Forecast 22.03.2021

Article By RoboForex.com

EURUSD, “Euro vs US Dollar”

EURUSD is still consolidating around 1.1944; right now, it is trading close to the downside border. Possibly, the pair may grow to break 1.1944 and then continue trading upwards with the first target at 1.2020.

EURUSD
Risk Warning: the result of previous trading operations do not guarantee the same results in the future

GBPUSD, “Great Britain Pound vs US Dollar”

GBPUSD is consolidating around 1.3862. The main scenario implies that the pair may grow to break 1.4000 and then continue trading upwards with the short-term target at 1.4217.

GBPUSD
Risk Warning: the result of previous trading operations do not guarantee the same results in the future

USDRUB, “US Dollar vs Russian Ruble”

USDRUB continues consolidating around 74.00. Possibly, today the pair may expand the range up to 74.45 and then start a new descending correction with the target at 73.50.

USDRUB
Risk Warning: the result of previous trading operations do not guarantee the same results in the future

USDJPY, “US Dollar vs Japanese Yen”

USDJPY is still consolidating around 108.77. Today, the pair may fall to reach 108.50 and then grow to return to 108.77. Later, the market may start another decline with the target at 107.55.

USDJPY
Risk Warning: the result of previous trading operations do not guarantee the same results in the future

USDCHF, “US Dollar vs Swiss Franc”

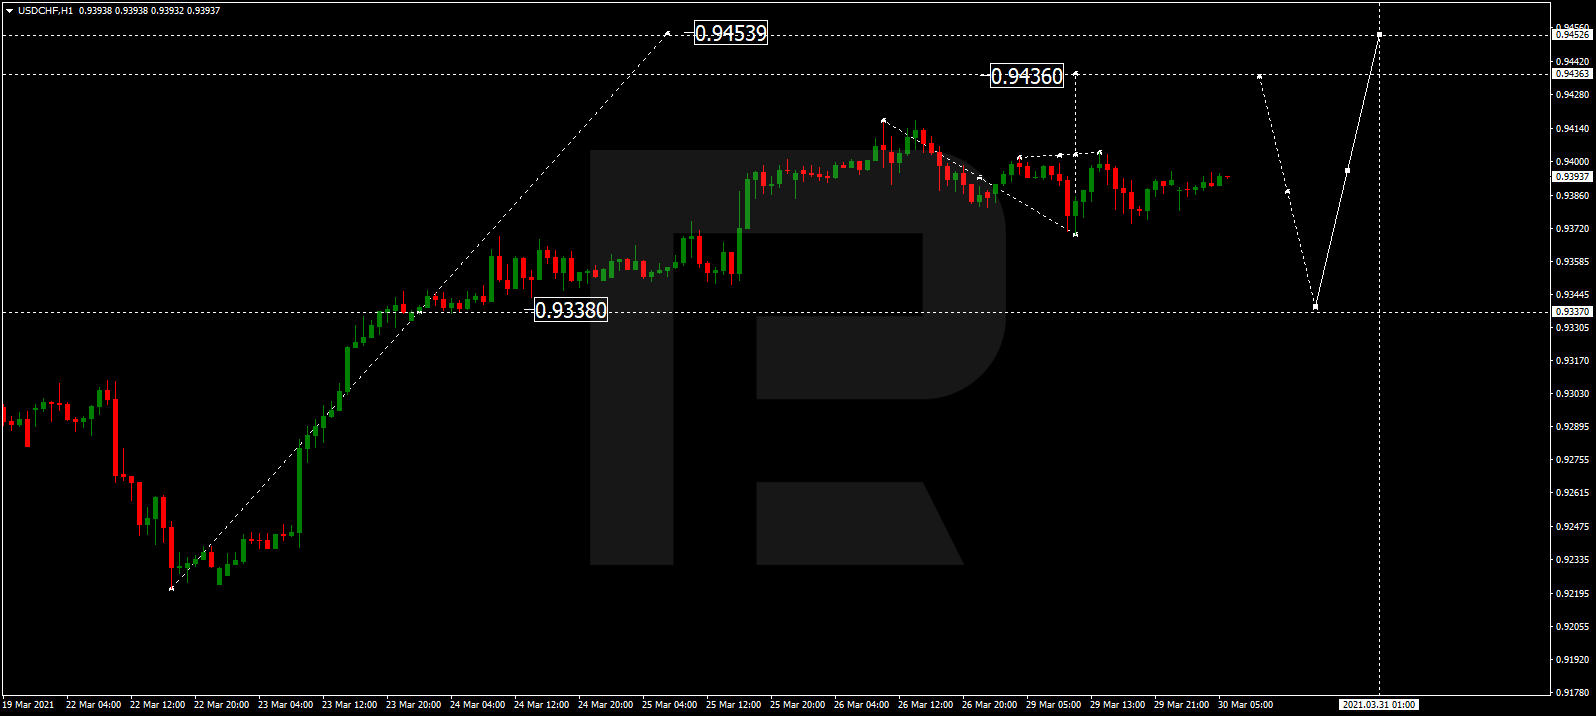
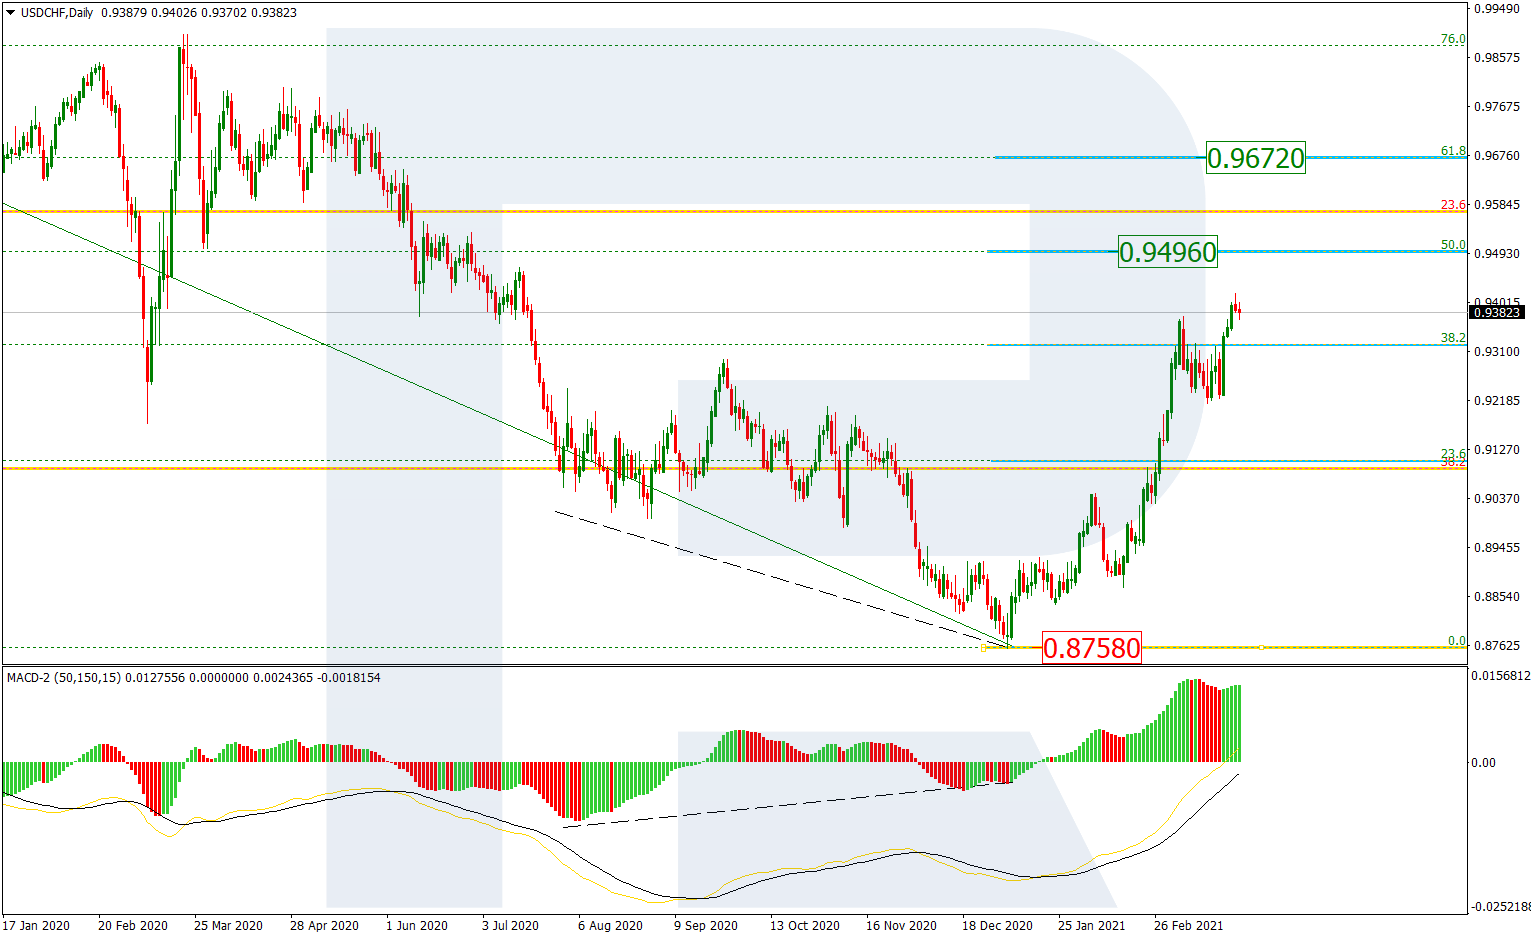
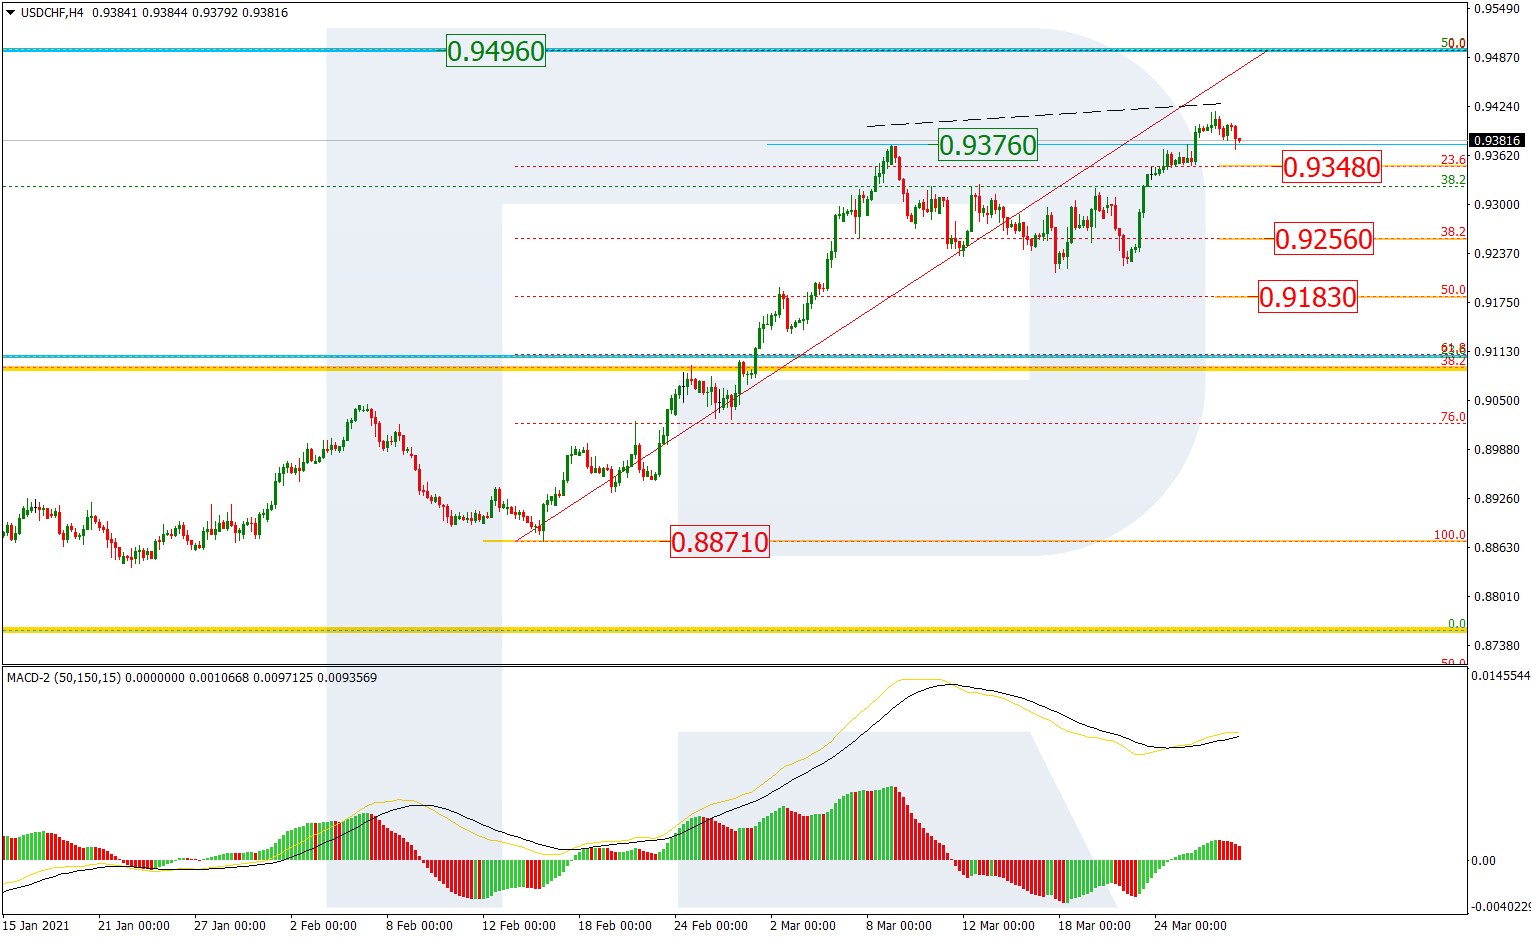
USDCHF is still consolidating around 0.9260 without any particular direction. Possibly, today the pair may fall towards 0.9186 and then form one more ascending structure to reach 0.9250. After that, the instrument may break the range to the downside and resume trading downwards with the target at 0.9050.

USDCHF
Risk Warning: the result of previous trading operations do not guarantee the same results in the future

AUDUSD, “Australian Dollar vs US Dollar”

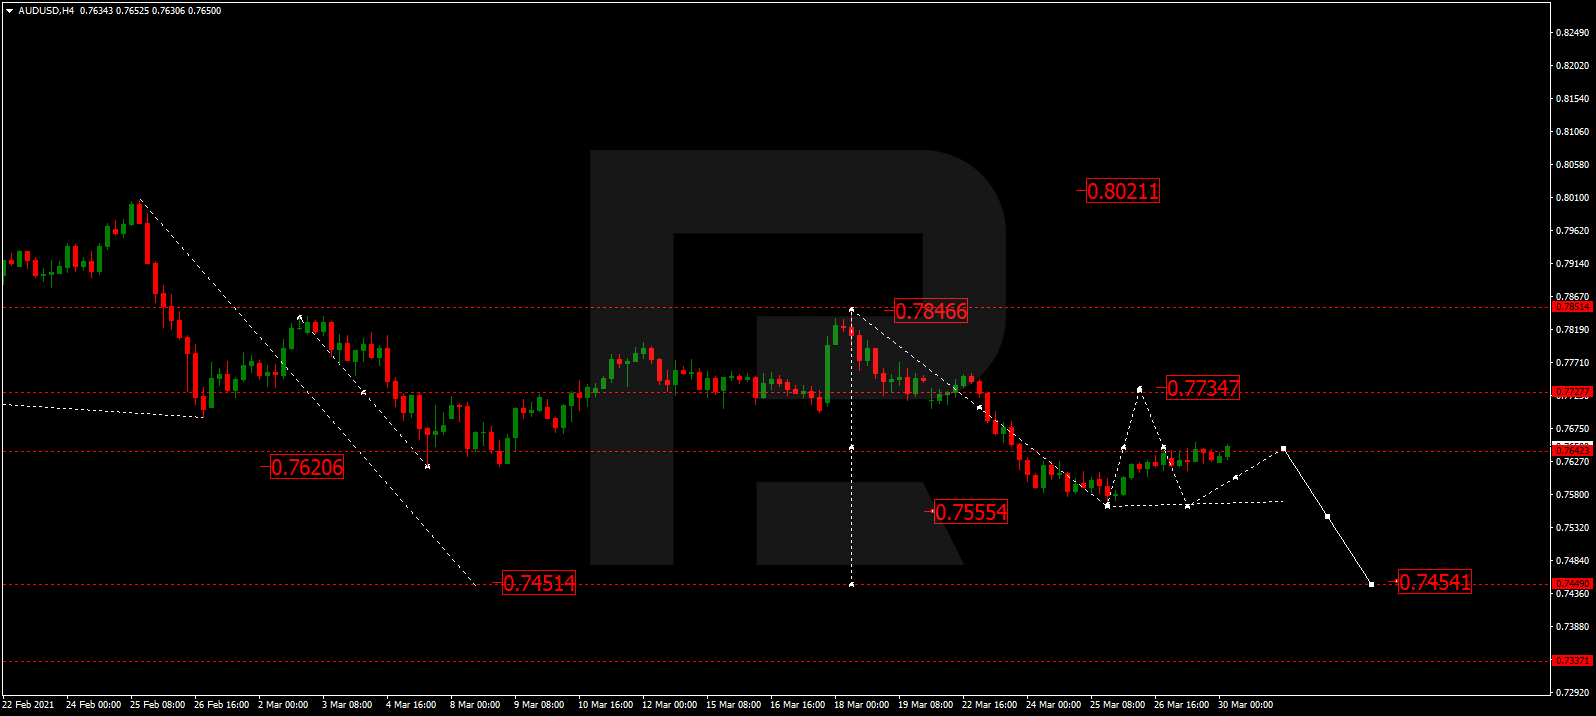
After completing the ascending wave at 0.7844, AUDUSD has finished the correction towards 0.7729. Possibly, today the pair may grow to break 0.7844 and then continue trading upwards with the short-term target at 0.7989.

AUDUSD
Risk Warning: the result of previous trading operations do not guarantee the same results in the future

BRENT

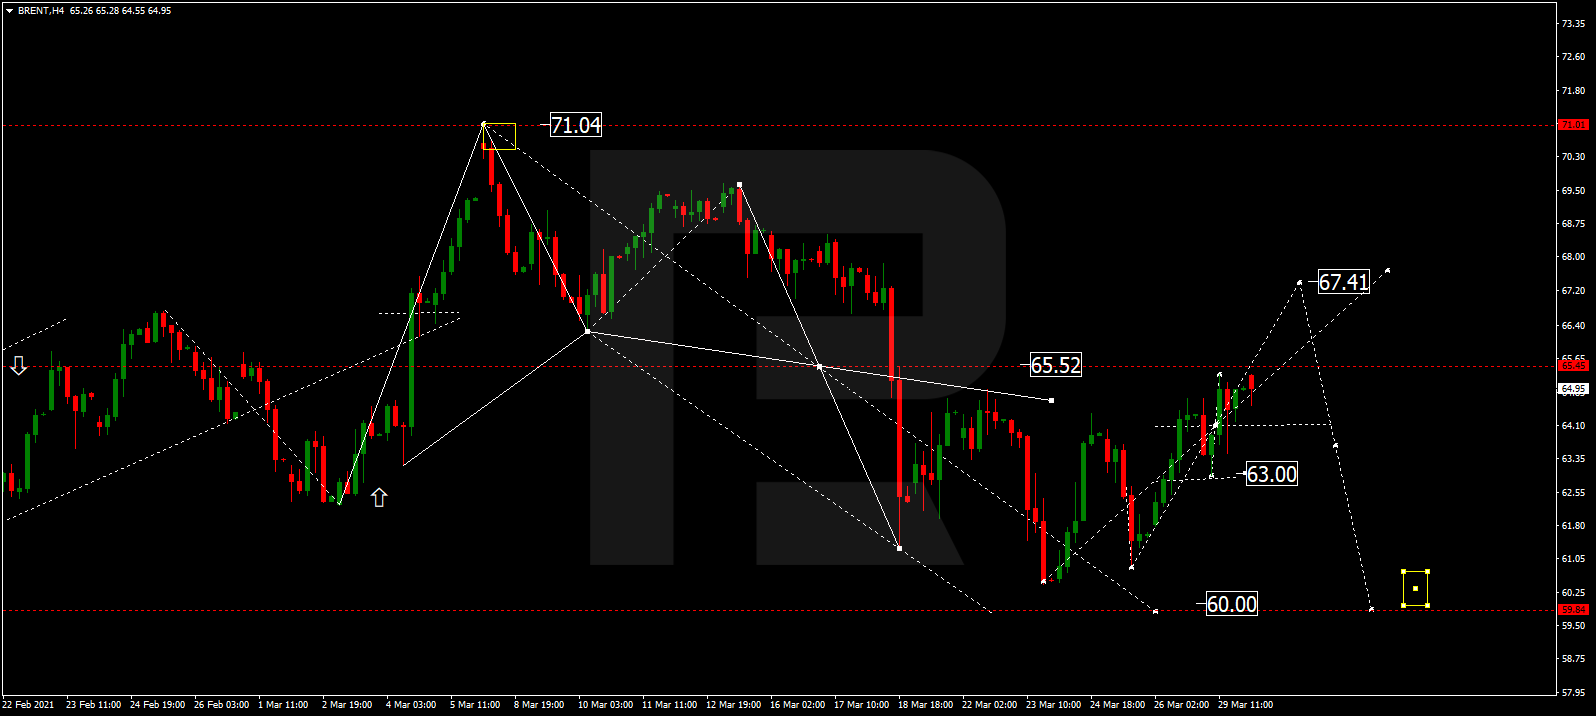
Brent is growing to test 65.50 from below. Later, the market may resume falling to reach the first target at 60.00 and then start a new correction to the upside to return to 65.50.

BRENT
Risk Warning: the result of previous trading operations do not guarantee the same results in the future

XAUUSD, “Gold vs US Dollar”

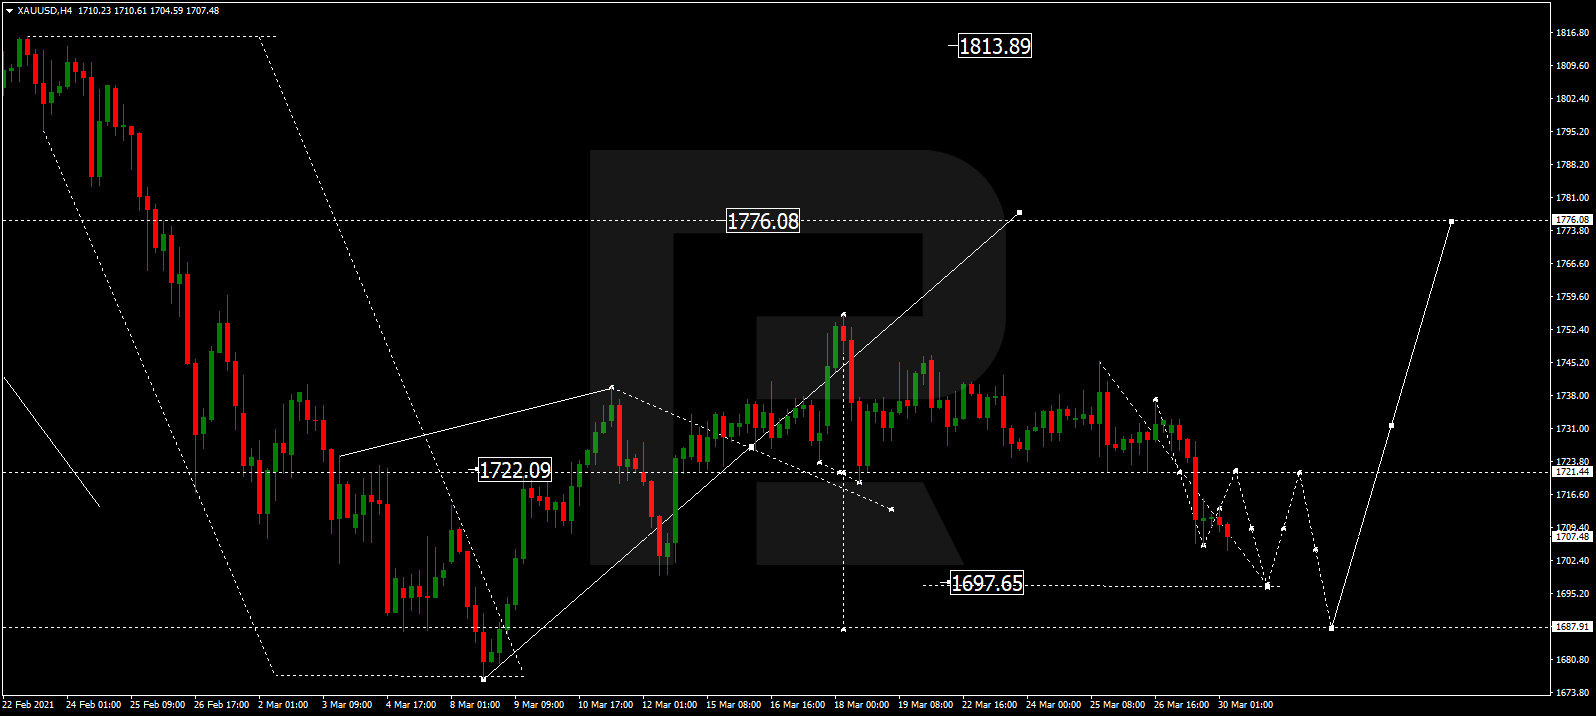
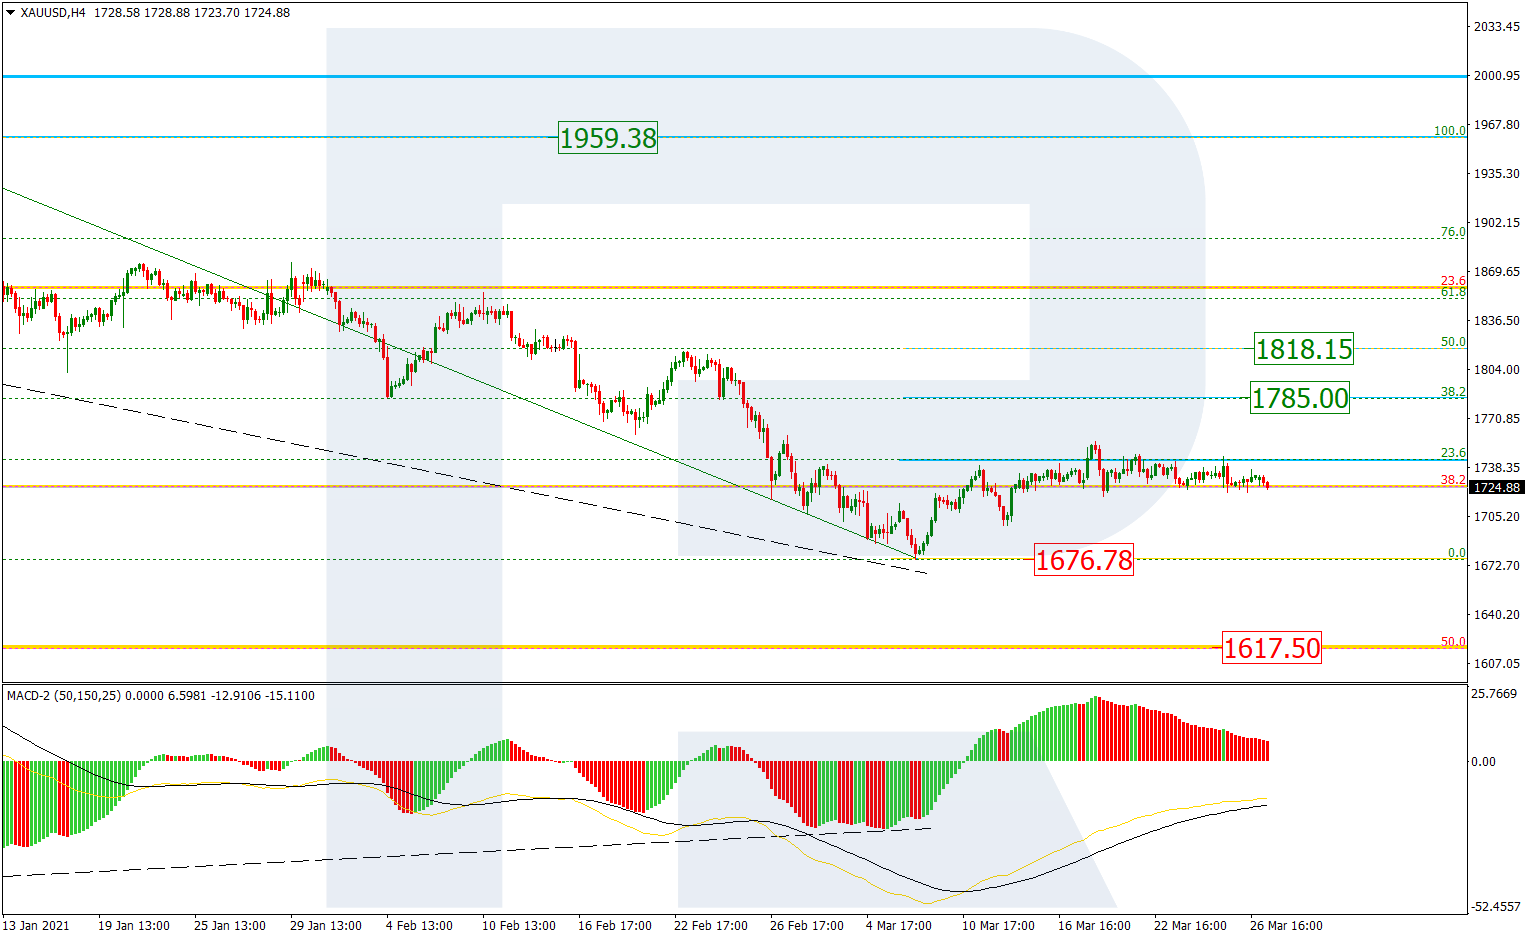
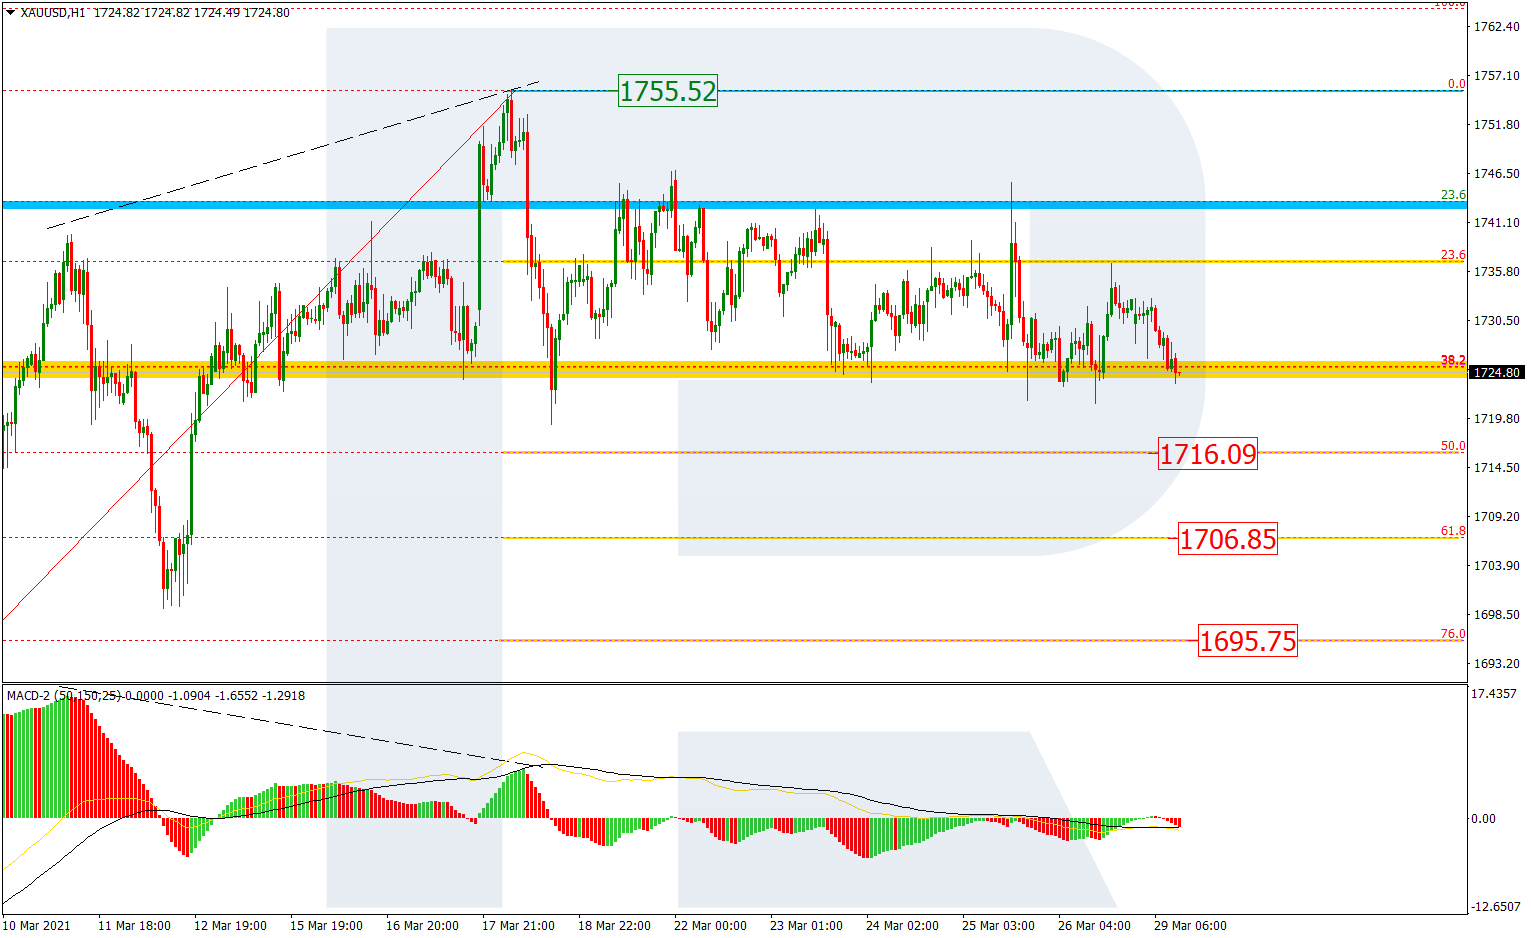
Gold is consolidating around 1741.30. Possibly, today the metal may form one more ascending structure towards 1763.30 and then start a new correction to reach 1741.44. Later, the market may resume growing with the short-term target at 1783.96.

GOLD
Risk Warning: the result of previous trading operations do not guarantee the same results in the future

S&P 500

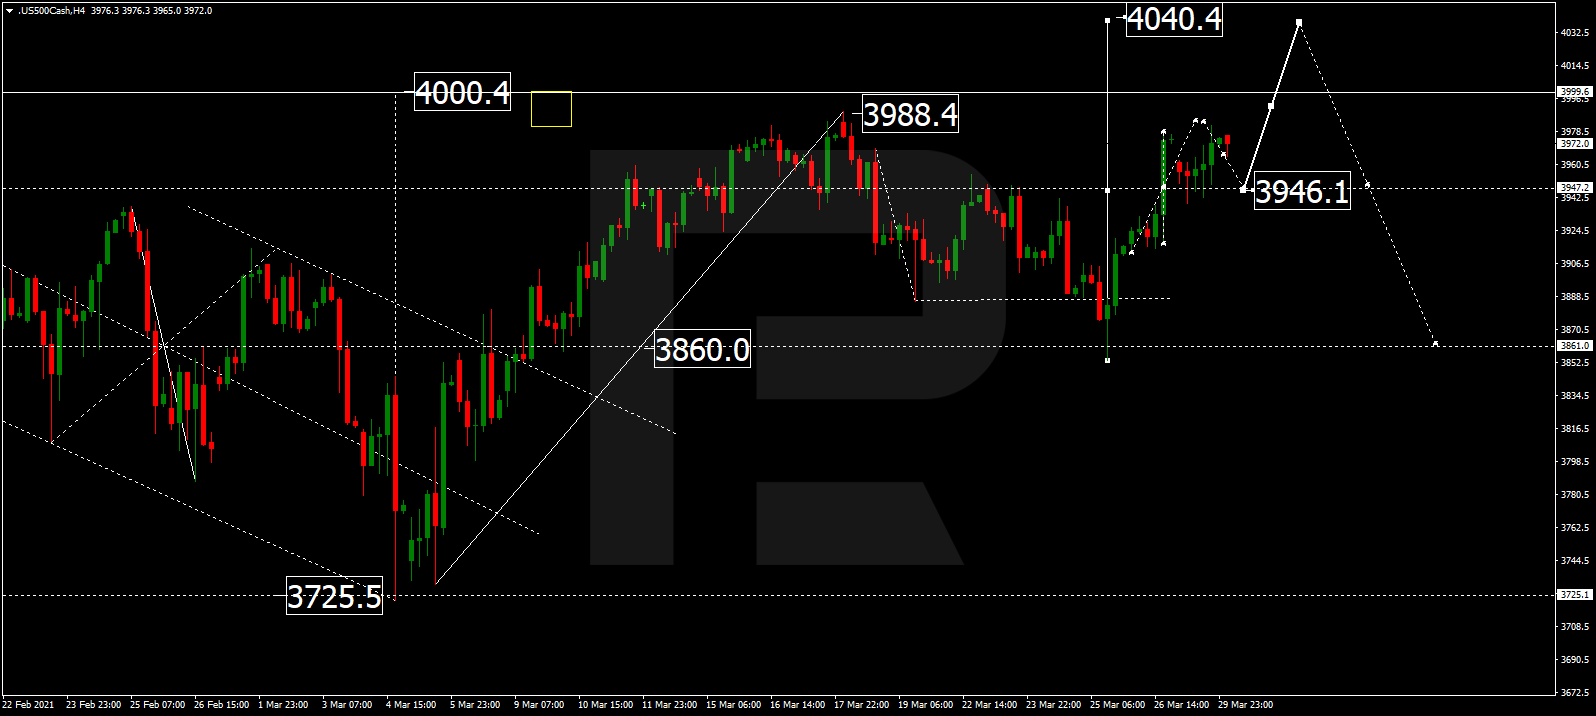
After finishing the descending wave at 3888.0, the S&P index is growing towards 3940.4 and may later form a new consolidation range there. If the price breaks this range to the upside, the market may resume growing to reach 4000.0; if to the downside – start a new correction with the target at 3777.0.

S&P 500

Article By RoboForex.com

Attention!
Forecasts presented in this section only reflect the author’s private opinion and should not be considered as guidance for trading. RoboForex LP bears no responsibility for trading results based on trading recommendations described in these analytical reviews.

Murrey Math Lines 22.03.2021 (EURUSD, GBPUSD)

Article By RoboForex.com

EURUSD, “Euro vs. US Dollar”

In the H4 chart, EURUSD is trading below the 200-day Moving Average, thus indicating a descending tendency. In this case, the price is expected to rebound from 3/8 and resume falling to reach the support at 2/8. Still, this scenario may no longer be valid if the price breaks the resistance at 3/8 to the upside. After that, the instrument may continue growing towards 5/8.

EURUSD_H4
Risk Warning: the result of previous trading operations do not guarantee the same results in the future

As we can see in the M15 chart, the pair has broken the downside line of the VoltyChannel indicator and, as a result, may continue its decline.

EURUSD_M15
Risk Warning: the result of previous trading operations do not guarantee the same results in the future

GBPUSD, “Great Britain Pound vs US Dollar”

In the H4 chart of GBPUSD, the price is also trading below the 200-day Moving Average, thus indicating a descending tendency. In this case, the asset is expected to test 3/8, rebound from it, and then resume falling towards the support at 1/8. However, this scenario may no longer be valid if the price breaks the resistance at 3/8 to the upside. After that, the instrument may reverse and grow to reach 5/8.

GBPUSD_H4
Risk Warning: the result of previous trading operations do not guarantee the same results in the future

As we can see in the M15 chart, the price has broken the downside line of the VoltyChannel indicator and, as a result, continue trading downwards.

GBPUSD_M15

Article By RoboForex.com

Attention!
Forecasts presented in this section only reflect the author’s private opinion and should not be considered as guidance for trading. RoboForex LP bears no responsibility for trading results based on trading recommendations described in these analytical reviews.