Archive for Forex and Currency News – Page 295

Ichimoku Cloud Analysis 29.03.2021 (EURJPY, BRENT, NZDCAD)

Article By RoboForex.com

EURJPY, “Euro vs Japanese Yen”

EURJPY is trading at 128.91; the instrument is moving below Ichimoku Cloud, thus indicating a descending tendency. The markets could indicate that the price may test Tenkan-Sen and Kijun-Sen at 129.10 and then resume moving downwards to reach 127.55. Another signal in favor of a further downtrend will be a rebound from the descending channel’s upside border. However, the bearish scenario may no longer be valid if the price breaks the cloud’s upside border and fixes above 129.95. In this case, the pair may continue growing towards 130.85. To confirm further decline, the asset must break the rising channel’s downside border and fix below 128.55.

EURJPY
Risk Warning: the result of previous trading operations do not guarantee the same results in the future

BRENT

Brent is trading at 63.14; the instrument is moving below Ichimoku Cloud, thus indicating a descending tendency. The markets could indicate that the price may test the cloud’s downside border at 64.35 and then resume moving downwards to reach 57.05. Another signal in favor of a further downtrend will be a rebound from the upside border of the Triangle pattern. However, the bearish scenario may no longer be valid if the price breaks the cloud’s upside border and fixes above 66.25. In this case, the pair may continue growing towards 69.55. To confirm further decline, the asset must break the pattern’s downside border and fix below 61.05.

BRENT
Risk Warning: the result of previous trading operations do not guarantee the same results in the future

NZDCAD, “New Zealand Dollar vs Canadian Dollar”

NZDCAD is trading at 0.8803; the instrument is moving below Ichimoku Cloud, thus indicating a descending tendency. The markets could indicate that the price may test Tenkan-Sen and Kijun-Sen at 0.8825 and then resume moving downwards to reach 0.8625. Another signal in favor of a further downtrend will be a rebound from the descending channel’s upside border. However, the bearish scenario may no longer be valid if the price breaks the cloud’s upside border and fixes above 0.8925. In this case, the pair may continue growing towards 0.9005. To confirm further decline, the asset must break the rising channel’s downside border and fix below 0.8745.

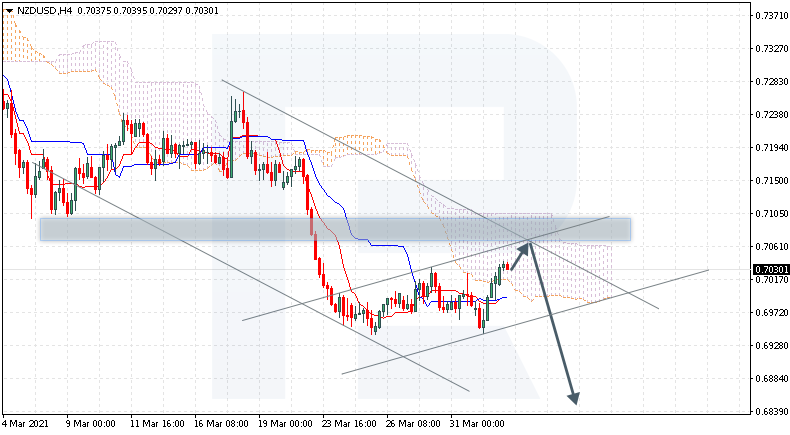
NZDCAD

Article By RoboForex.com

Attention!
Forecasts presented in this section only reflect the author’s private opinion and should not be considered as guidance for trading. RoboForex LP bears no responsibility for trading results based on trading recommendations described in these analytical reviews.

The Analytical Overview of the Main Currency Pairs on 2021.03.29

by JustForex

The EUR/USD currency pair

Technical indicators of the currency pair:
  • Prev Open: 1.1769
  • Prev Close: 1.1795
  • % chg. over the last day: +0.22%

A report from the IFO Institute for Germany allowed the euro to rise slightly against the dollar. Business climate indices continue to grow. In March, this figure has exceeded the values of July 2019, which indicates the business community’s confidence in the rapid recovery of the economy after the pandemic, despite the new restrictions. However, the US statistics are positive as well, which limits the growth of the euro.

Trading recommendations
  • Support levels: 1.1746, 1.1688
  • Resistance levels: 1.1889, 1.1990

The main scenario for EUR/USD is selling. No important events are scheduled for today, so calm trading is expected. However, technical indicators show that bears are stronger than bulls. The ADX has risen at the minimum price decrease in the Asian session, while the price remains below the moving averages.

Alternative scenario: if the price manages to gain a foothold above the level of 1.1851, the pair may start a corrective rise to 1.1889 or higher.

EUR/USD
There is no news feed for today.

The GBP/USD currency pair

Technical indicators of the currency pair:
  • Prev Open: 1.3736
  • Prev Close: 1.3785
  • % chg. over the last day: +0.36%

The sterling is correcting after falling in the first half of last week. Growth in retail sales supported sterling bulls. However, the market may be wary of buying as the yield spread between the UK Gilts and US Treasuries continues to narrow, indicating the dollar bulls’ strength.

Trading recommendations
  • Support levels: 1.3680, 1.3610
  • Resistance levels: 1.3875, 1.3997

The main scenario for trading GBP/USD is buying. Technical indicators remain on the side of the bulls. The ADX shows decreasing upside potential. But the price remains above the moving averages, and the MACD is in the positive area. It indicates an increase in the pair, but the first resistance level may limit growth.

Alternative scenario: if the pair consolidates below 1.3680, the pound may resume decline.

GBP/USD
There is no news feed for today.

The USD/JPY currency pair

Technical indicators of the currency pair:
  • Prev Open: 109.17
  • Prev Close: 109.67
  • % chg. over the last day: +0.48%

In the dollar-yen pair, volatility continues to rise amid a rebound in the stock market. The pair managed to get out of its range, consolidating above the resistance level of 109.34. The rise in share prices after the publication of positive consumer confidence data supported the pair and the dollar. In this light, medium-term growth expectations have straightened.

Trading recommendations
  • Support levels: 108.35, 107.08
  • Resistance levels: 109.86, 110.32

The main scenario is buying. The ADX on the H1, the H4, and the D1 timeframes shows increased bullish pressure. Convergence has formed on the MACD. Considering that the moving averages are directed steeply upward, the probability of a breakdown of the resistance level at 109.67 is high.

An alternative scenario implies the price-fixing below 109.05. In this case, the pair could drop to 108.35.

USD/JPY
There is no news feed for today.

The USD/CAD currency pair

Technical indicators of the currency pair:
  • Prev Open: 1.2603
  • Prev Close: 1.2577
  • % chg. over the last day: -0.21%

The pair fell slightly on the back of rising oil prices. However, most of the decline can be attributed to bearish sentiment in the US dollar within the day. As the news that the container ship has been refloated has put pressure on oil quotes, we can expect the pair to resume growth in the medium term.

Trading recommendations
  • Support levels: 1.2574, 1.2446
  • Resistance levels: 1.2629, 1.2745

The main scenario is buying. The ADX showed growth in bullish pressure in the Asian session. The MACD is above zero, and the price has consolidated above the moving averages. It indicates a high likelihood of a resumption of northern movement.

Alternative scenario: if the price manages to gain a foothold below 1.2580, the pair may resume its southern movement to 1.2466.

USD/CAD
There is no news feed for today.

by JustForex


This article reflects a personal opinion and should not be interpreted as an investment advice, and/or offer, and/or a persistent request for carrying out financial transactions, and/or a guarantee, and/or a forecast of future events.

In the United States, the consumer confidence index is growing, supporting the dollar

by JustForex

On Friday, data from the University of Michigan showed the highest growth in consumer confidence since May 2013. Households gained support in the form of a third payment from the government for assistance during the pandemic. Higher-than-expected progress in vaccination also influenced sentiments.

The consumer sentiment index rose to 79.7 in March from 70.7 in February. The index of current conditions rose to 93, which is above the preliminary estimate of 91.5 and above the February one of 86.2. The inflation expectations for the year in advance fell to 3.1% from 3.3%, in line with preliminary data, but the five-year forecast rose to 2.8% from 2.7%.

At the same time, household spending declined and the core price index for personal consumption expenditure slowed down. Household spending decreased by 1.0% due to a 7.3% drop in income. According to the BEA, this is the largest drop in history, reflecting a decrease in government welfare benefits for people. Within the framework of state social allowance, “other” ones were reduced, in particular, payments to households that have an impact on the economy.

The core PCE price index in the United States, which excludes food and energy prices, decreased by 0.1% in comparison to the previous month. On an annualized basis, prices for basic commodities fell to 1.4%. This lowered expectations for the imminent curtailment of the Fed’s ultra-soft policy in some way, and against this background, the Treasury yield fell to 1.64%.

Oil prices declined amid news around the container ship Ever Given. According to the latest reports, the ship has been partially refloated which is the first step towards the unblocking of the Suez Canal. Brent oil decreased by 0.40% to $64.16 p/b. WTI decreased by 0.80% to $60.45 p/b.

Main market quotes:

S&P 500 (F) 3,940.12 -24.63 (-0.62%)

Dow Jones 33,072.88 +453.40 (+1.39%)

DAX 14,770.10 +21.16 (+0.14%)

FTSE 100 6,713.45 -27.14 (-0.40%)

USD Index 92.875 +0.100 (+0.11%)

by JustForex


This article reflects a personal opinion and should not be interpreted as an investment advice, and/or offer, and/or a persistent request for carrying out financial transactions, and/or a guarantee, and/or a forecast of future events.

Markets cautious ahead of holiday-shortened week

By Lukman Otunuga Research Analyst, ForexTime

Asian shares turned mixed on Monday while US equity futures slipped despite Wall Street ending Friday on a strong note.

Investors seem to have entered the holiday-shortened week in a cautious mood, ahead of key economic releases, President Biden’s infrastructure spending plans and the monthly US non-farm payrolls report. Nevertheless, the overall mood across financial markets remains positive thanks to the success of vaccine rollouts in the US and UK with the growing optimism around a global economic recovery continuing to fuel the risk-on sentiment. This continues to be reflected in equity markets, with the Dow and S&P 500 ending at all-time highs last week.

Given how there is so much confidence priced into markets, this could turn out to be a key week for equity bulls. Should the pending data releases fail to meet expectations, the risk-on sentiment could take a hit. Another negative theme to watch out for is the rising coronavirus cases in Europe and renewed lockdown restrictions across the continent. If things get even uglier in Europe with the outlook darkening, risk-off may engulf financial markets.

Dollar poised to extend gains?

The dollar has entered the week on a firm note, appreciating against every single G10 currency excluding the Japanese yen. Enthusiasm over the US economic recovery and rising Treasury yields have pushed investors towards the dollar’s safe embrace, while progress on the vaccine front has sweetened appetite for the currency. Given how the euro has been punished by spiking coronavirus cases in Europe and its faltering vaccination campaign, this could push the Dollar Index higher – especially when considering the euro’s weighing.

Looking at the technical picture, the Dollar Index is bullish on the daily timeframe. Prices are trading back above the 200-day moving average while the MACD is above 0. However, the Relative Strength Index is slowly approaching overbought territory. Should 92.50 prove to be reliable support, the DXY could make a move on 93.20. This technical setup is very much likely to be influenced by the US jobs data on Friday.

Commodity spotlight – Gold

Gold ended last week lower despite the concerning developments revolving around Covid-19 in Europe.

Even as the rally in bond yields took a breather, this offered little support to zero-yielding gold. It is becoming clear that the mighty dollar is the culprit behind gold’s decline. The encouraging developments on the vaccine front in the US have fuelled hopes for a faster US economic recovery consequently boosting appetite for the greenback. Should the dollar extend gains in the week ahead, this is likely to drag gold prices lower.

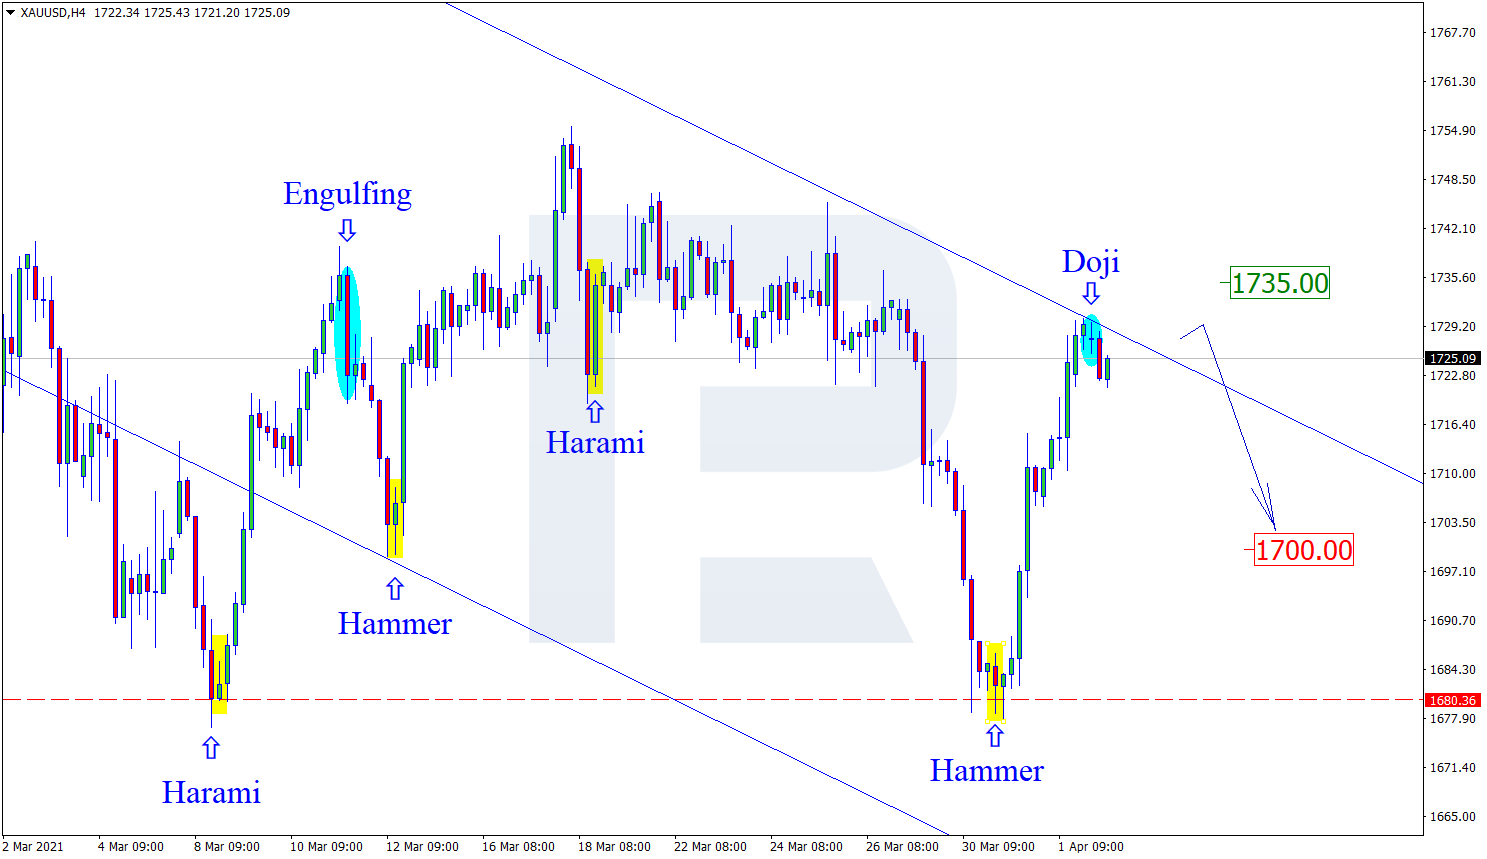
Gold could still rebound if Covid-related concerns from Europe fuel risk aversion. At this point, the technicals favour the bears with a weekly close below $1730 sealing the deal for a decline towards $1700 and the cycle lows.

Disclaimer: The content in this article comprises personal opinions and should not be construed as containing personal and/or other investment advice and/or an offer of and/or solicitation for any transactions in financial instruments and/or a guarantee and/or prediction of future performance. ForexTime (FXTM), its affiliates, agents, directors, officers or employees do not guarantee the accuracy, validity, timeliness or completeness, of any information or data made available and assume no liability as to any loss arising from any investment based on the same.


Forex-Time-LogoArticle by ForexTime

ForexTime Ltd (FXTM) is an award winning international online forex broker regulated by CySEC 185/12 www.forextime.com

The Yen Updated Its Yearly Lows

By Dmitriy Gurkovskiy, Chief Analyst at RoboForex

On Monday, March 29th, the Japanese Yen is slightly correcting against the USD after updating its 12-month lows earlier. At the moment, the pair is mostly trading at 109.53.

Prior to that, the Japanese government approved the country’s budget for the next fiscal year, which starts on April 1st. The budget is $1 trillion and rumored that the coronavirus pandemic constantly requires increases in expenses.

The Japanese economy is still suffering from internal problems coming from restricted consumption, deflation, and the coronavirus crisis. Capital markets are still waiting for the Bank of Japan and the country’s government to announce additional expenditures and stimulus programs because it will be difficult to revive the domestic demand without them.

The Japanese Ministry of Finance makes a serious stand against increases in state expenses because the institution is also planning to replenish its reserves.

As we can see in the H4 chart, after completing the ascending wave at 109.80, USD/JPY has formed a new consolidation range below this level. Possibly, the pair may reach 109.90 and then start a new decline to break 109.05. After that, the instrument may continue trading downwards with the first target at 108.30. From the technical point of view, this scenario is confirmed by MACD Oscillator: after breaking 0 to the upside, its signal line is moving within the histogram area so far, thus implying that the asset may update its highs on the price chart. After the line leaves the area, it may continue falling to break 0 and the pair may boost its decline.

In the H1 chart, after completing the first descending structure at 109.63 along with the correction towards 109.74, USD/JPY is moving downwards. Possibly, the asset may break the downside border or this range to continue the correction towards 109.05 and then start a new growth to reach 109.45. If later the price breaks this level, the market may continue growing with the target at 109.90. On the other hand, if the asset rebounds from 109.45 and then breaks 109.05, the instrument may continue trading downwards with the short-term target at 108.70. From the technical point of view, this scenario is confirmed by the Stochastic Oscillator: its signal line is moving not far from 20 and may grow to break 50. Later, the line may continue growing towards 80. However, if the line rebounds from 50, it may resume falling to reach 20.

Disclaimer

Any forecasts contained herein are based on the author’s particular opinion. This analysis may not be treated as trading advice. RoboForex bears no responsibility for trading results based on trading recommendations and reviews contained herein.

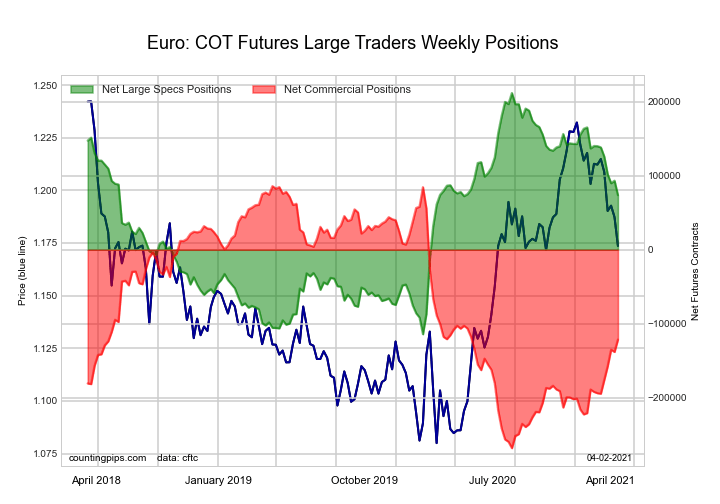
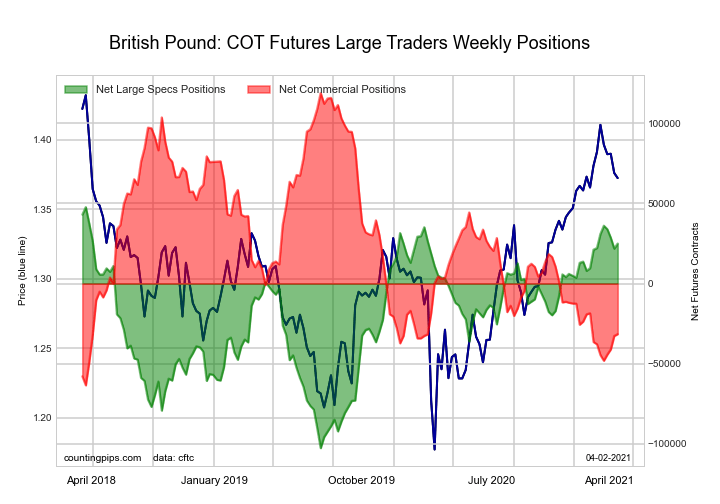
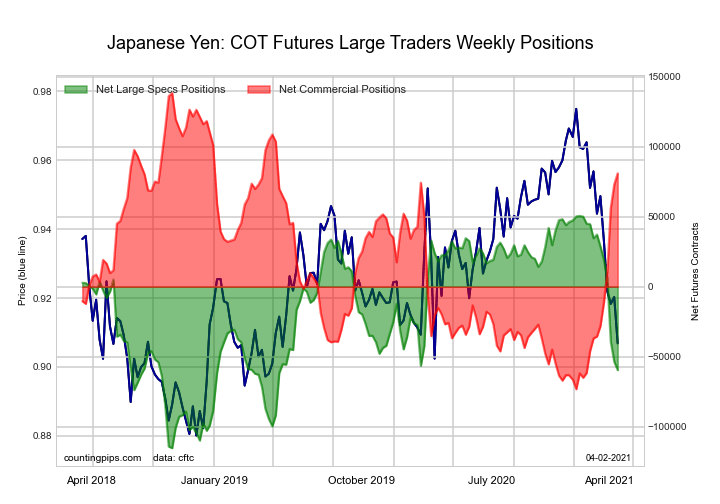
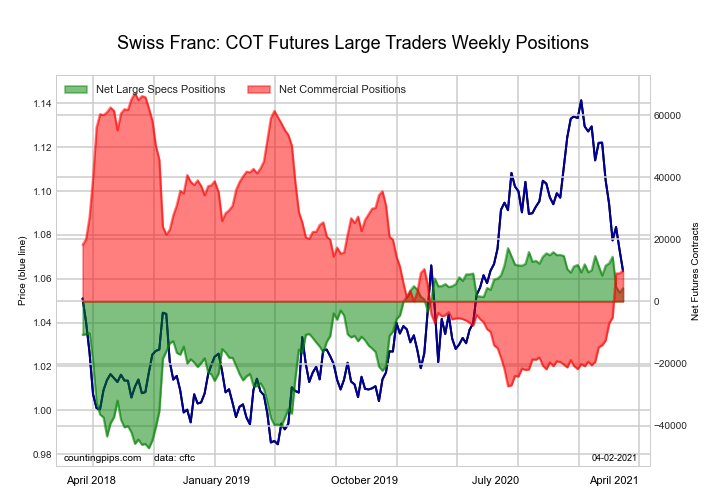
COT Forex Futures Charts: Mexican Peso, Bitcoin, Swiss Franc, US Dollar, Euro, Yen

Here are the latest charts and statistics for the Commitment of Traders (COT) data published by the Commodities Futures Trading Commission (CFTC).

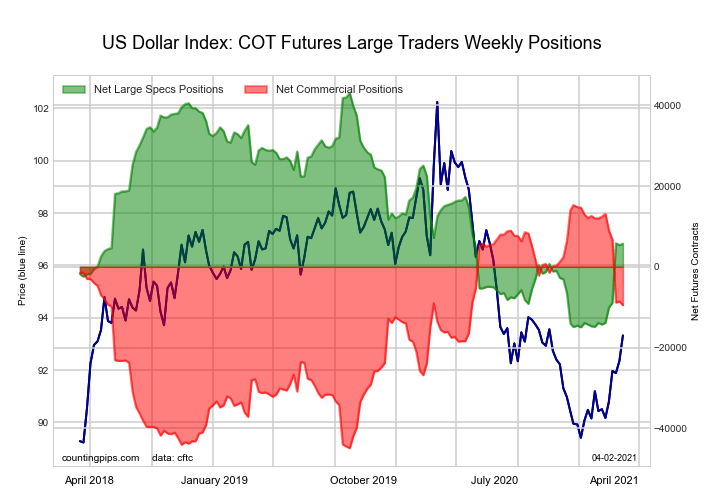
The latest COT data is updated through Tuesday March 23 2021 and shows a quick view of how large traders (for-profit speculators and commercial entities) were positioned in the futures markets. All currency positions are in direct relation to the US dollar where, for example, a bet for the euro is a bet that the euro will rise versus the dollar while a bet against the euro will be a bet that the euro will decline versus the dollar.


US DOLLAR INDEX:

COT Forex Futures Charts

US DOLLAR INDEX StatisticsSPECULATORSCOMMERCIALSSMALL TRADERS
– Percent of Open Interest Longs:75.85.214.1
– Percent of Open Interest Shorts:61.228.65.4
– Net Position:5,383-8,5683,185
– Gross Longs:27,8461,9275,177
– Gross Shorts:22,46310,4951,992
– Long to Short Ratio:1.2 to 10.2 to 12.6 to 1
NET POSITION TREND:
– COT Index Score (3 Year Range Pct):35.160.460.6
– COT Index Reading (3 Year Range):BearishBullishBullish
NET POSITION MOVEMENT INDEX:
– 6-Week Change in Strength Index:33.2-34.217.2


EURO Currency:

COT Forex Futures Charts

EURO Currency StatisticsSPECULATORSCOMMERCIALSSMALL TRADERS
– Percent of Open Interest Longs:30.554.613.8
– Percent of Open Interest Shorts:15.976.26.8
– Net Position:93,322-138,03344,711
– Gross Longs:195,500350,52088,274
– Gross Shorts:102,178488,55343,563
– Long to Short Ratio:1.9 to 10.7 to 12.0 to 1
NET POSITION TREND:
– COT Index Score (3 Year Range Pct):63.636.769.0
– COT Index Reading (3 Year Range):BullishBearishBullish
NET POSITION MOVEMENT INDEX:
– 6-Week Change in Strength Index:-14.415.2-12.4


BRITISH POUND STERLING:

COT Forex Futures Charts

BRITISH POUND StatisticsSPECULATORSCOMMERCIALSSMALL TRADERS
– Percent of Open Interest Longs:35.539.324.6
– Percent of Open Interest Shorts:20.561.717.1
– Net Position:21,819-32,71410,895
– Gross Longs:51,84357,49235,919
– Gross Shorts:30,02490,20625,024
– Long to Short Ratio:1.7 to 10.6 to 11.4 to 1
NET POSITION TREND:
– COT Index Score (3 Year Range Pct):82.816.988.5
– COT Index Reading (3 Year Range):Bullish-ExtremeBearish-ExtremeBullish-Extreme
NET POSITION MOVEMENT INDEX:
– 6-Week Change in Strength Index:0.52.1-10.5


JAPANESE YEN:

COT Forex Futures Charts

JAPANESE YEN StatisticsSPECULATORSCOMMERCIALSSMALL TRADERS
– Percent of Open Interest Longs:17.169.812.1
– Percent of Open Interest Shorts:50.524.424.2
– Net Position:-53,52572,912-19,387
– Gross Longs:27,524112,09819,405
– Gross Shorts:81,04939,18638,792
– Long to Short Ratio:0.3 to 12.9 to 10.5 to 1
NET POSITION TREND:
– COT Index Score (3 Year Range Pct):37.269.119.2
– COT Index Reading (3 Year Range):BearishBullishBearish-Extreme
NET POSITION MOVEMENT INDEX:
– 6-Week Change in Strength Index:-53.252.0-41.3


SWISS FRANC:

COT Forex Futures Charts

SWISS FRANC StatisticsSPECULATORSCOMMERCIALSSMALL TRADERS
– Percent of Open Interest Longs:32.542.324.7
– Percent of Open Interest Shorts:25.018.755.9
– Net Position:2,8729,049-11,921
– Gross Longs:12,45816,2119,474
– Gross Shorts:9,5867,16221,395
– Long to Short Ratio:1.3 to 12.3 to 10.4 to 1
NET POSITION TREND:
– COT Index Score (3 Year Range Pct):77.838.533.2
– COT Index Reading (3 Year Range):BullishBearishBearish
NET POSITION MOVEMENT INDEX:
– 6-Week Change in Strength Index:-13.325.2-41.6


CANADIAN DOLLAR:

COT Forex Futures Charts

CANADIAN DOLLAR StatisticsSPECULATORSCOMMERCIALSSMALL TRADERS
– Percent of Open Interest Longs:28.841.528.7
– Percent of Open Interest Shorts:25.761.012.3
– Net Position:5,103-31,61926,516
– Gross Longs:46,78667,36746,479
– Gross Shorts:41,68398,98619,963
– Long to Short Ratio:1.1 to 10.7 to 12.3 to 1
NET POSITION TREND:
– COT Index Score (3 Year Range Pct):59.327.686.8
– COT Index Reading (3 Year Range):BullishBearishBullish-Extreme
NET POSITION MOVEMENT INDEX:
– 6-Week Change in Strength Index:-3.72.70.6


AUSTRALIAN DOLLAR:

COT Forex Futures Charts

AUSTRALIAN DOLLAR StatisticsSPECULATORSCOMMERCIALSSMALL TRADERS
– Percent of Open Interest Longs:44.330.724.3
– Percent of Open Interest Shorts:39.845.114.3
– Net Position:5,942-19,22113,279
– Gross Longs:59,03240,90332,392
– Gross Shorts:53,09060,12419,113
– Long to Short Ratio:1.1 to 10.7 to 11.7 to 1
NET POSITION TREND:
– COT Index Score (3 Year Range Pct):88.45.186.3
– COT Index Reading (3 Year Range):Bullish-ExtremeBearish-ExtremeBullish-Extreme
NET POSITION MOVEMENT INDEX:
– 6-Week Change in Strength Index:6.9-3.0-5.8


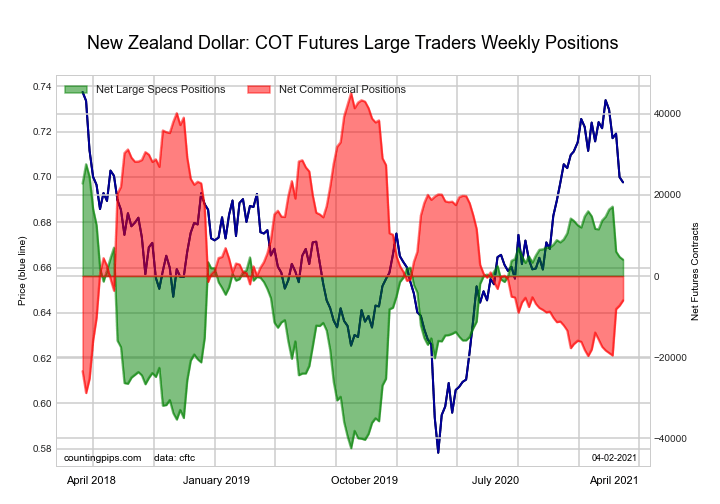
NEW ZEALAND DOLLAR:

COT Forex Futures Charts

NEW ZEALAND DOLLAR StatisticsSPECULATORSCOMMERCIALSSMALL TRADERS
– Percent of Open Interest Longs:53.226.315.3
– Percent of Open Interest Shorts:40.945.38.6
– Net Position:4,724-7,2912,567
– Gross Longs:20,35410,0515,865
– Gross Shorts:15,63017,3423,298
– Long to Short Ratio:1.3 to 10.6 to 11.8 to 1
NET POSITION TREND:
– COT Index Score (3 Year Range Pct):67.429.281.9
– COT Index Reading (3 Year Range):BullishBearishBullish-Extreme
NET POSITION MOVEMENT INDEX:
– 6-Week Change in Strength Index:-9.711.3-17.3


MEXICAN PESO:

COT Forex Futures Charts

MEXICAN PESO StatisticsSPECULATORSCOMMERCIALSSMALL TRADERS
– Percent of Open Interest Longs:40.354.84.6
– Percent of Open Interest Shorts:56.340.72.6
– Net Position:-20,89418,3922,502
– Gross Longs:52,41271,3325,930
– Gross Shorts:73,30652,9403,428
– Long to Short Ratio:0.7 to 11.3 to 11.7 to 1
NET POSITION TREND:
– COT Index Score (3 Year Range Pct):4.395.253.6
– COT Index Reading (3 Year Range):Bearish-ExtremeBullish-ExtremeBullish
NET POSITION MOVEMENT INDEX:
– 6-Week Change in Strength Index:-11.211.7-5.6


BRAZIL REAL:

COT Forex Futures Charts

BRAZIL REAL StatisticsSPECULATORSCOMMERCIALSSMALL TRADERS
– Percent of Open Interest Longs:26.066.05.2
– Percent of Open Interest Shorts:79.513.14.8
– Net Position:-25,24925,019230
– Gross Longs:12,29131,2042,477
– Gross Shorts:37,5406,1852,247
– Long to Short Ratio:0.3 to 15.0 to 11.1 to 1
NET POSITION TREND:
– COT Index Score (3 Year Range Pct):43.058.874.1
– COT Index Reading (3 Year Range):BearishBullishBullish
NET POSITION MOVEMENT INDEX:
– 6-Week Change in Strength Index:-13.014.5-11.5


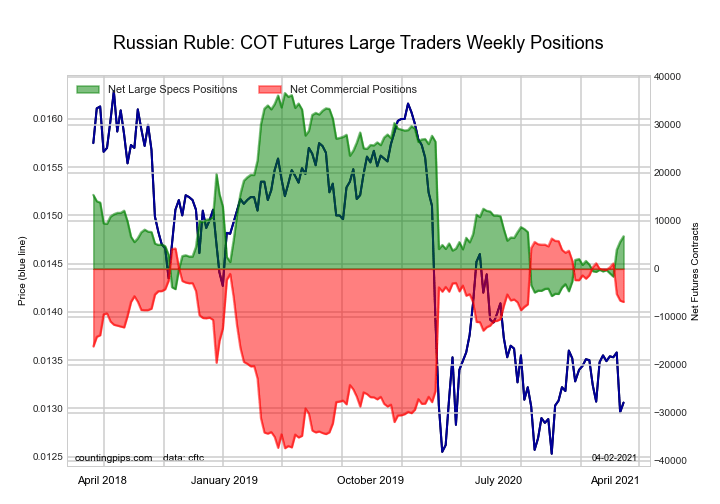
RUSSIAN RUBLE:

COT Forex Futures Charts

RUSSIAN RUBLE StatisticsSPECULATORSCOMMERCIALSSMALL TRADERS
– Percent of Open Interest Longs:34.058.57.5
– Percent of Open Interest Shorts:15.880.04.3
– Net Position:5,625-6,615990
– Gross Longs:10,49218,0442,303
– Gross Shorts:4,86724,6591,313
– Long to Short Ratio:2.2 to 10.7 to 11.8 to 1
NET POSITION TREND:
– COT Index Score (3 Year Range Pct):26.770.475.7
– COT Index Reading (3 Year Range):BearishBullishBullish
NET POSITION MOVEMENT INDEX:
– 6-Week Change in Strength Index:13.8-15.126.3


BITCOIN FUTURES:

COT Forex Futures Charts

BITCOIN StatisticsSPECULATORSCOMMERCIALSSMALL TRADERS
– Percent of Open Interest Longs:56.05.528.6
– Percent of Open Interest Shorts:80.31.88.0
– Net Position:-2,4053712,034
– Gross Longs:5,5415492,828
– Gross Shorts:7,946178794
– Long to Short Ratio:0.7 to 13.1 to 13.6 to 1
NET POSITION TREND:
– COT Index Score (3 Year Range Pct):36.286.256.6
– COT Index Reading (3 Year Range):BearishBullish-ExtremeBullish
NET POSITION MOVEMENT INDEX:
– 6-Week Change in Strength Index:12.425.8-20.9


Article By CountingPips.comReceive our weekly COT Reports by Email

*COT Report: The COT data, released weekly to the public each Friday, is updated through the most recent Tuesday (data is 3 days old) and shows a quick view of how large speculators or non-commercials (for-profit traders) were positioned in the futures markets.

The CFTC categorizes trader positions according to commercial hedgers (traders who use futures contracts for hedging as part of the business), non-commercials (large traders who speculate to realize trading profits) and nonreportable traders (usually small traders/speculators).

Find CFTC criteria here: (http://www.cftc.gov/MarketReports/CommitmentsofTraders/ExplanatoryNotes/index.htm).

Ichimoku Cloud Analysis 26.03.2021 (AUDUSD, GBPUSD, USDCHF)

Article By RoboForex.com

AUDUSD, “Australian Dollar vs US Dollar”

AUDUSD is trading at 0.7616; the instrument is moving below Ichimoku Cloud, thus indicating a descending tendency. The markets could indicate that the price may test Tenkan-Sen and Kijun-Sen at 0.7685 and then resume moving downwards to reach 0.7425. Another signal in favor of a further downtrend will be a rebound from the upside border of the “5-0” pattern. However, the bearish scenario may no longer be valid if the price breaks the cloud’s upside border and fixes above 0.7745. In this case, the pair may continue growing towards 0.7835.

AUDUSD
Risk Warning: the result of previous trading operations do not guarantee the same results in the future

GBPUSD, “Great Britain Pound vs US Dollar”

GBPUSD is trading at 1.3757; the instrument is moving below Ichimoku Cloud, thus indicating a descending tendency. The markets could indicate that the price may test Tenkan-Sen and Kijun-Sen at 1.3765 and then resume moving downwards to reach 1.3465. Another signal in favor of a further downtrend will be a rebound from the descending channel’s upside border. However, the bearish scenario may no longer be valid if the price breaks the cloud’s upside border and fixes above 1.3925. In this case, the pair may continue growing towards 1.4015.

GBPUSD
Risk Warning: the result of previous trading operations do not guarantee the same results in the future

USDCHF, “US Dollar vs Swiss Franc”

USDCHF is trading at 0.9398; the instrument is moving above Ichimoku Cloud, thus indicating an ascending tendency. The markets could indicate that the price may test Tenkan-Sen and Kijun-Sen at 0.9325 and then resume moving upwards to reach 0.9545. Another signal in favor of a further uptrend will be a rebound from the descending channel’s upside border. However, the bullish scenario may no longer be valid if the price breaks the cloud’s downside border and fixes below 0.9245. In this case, the pair may continue falling towards 0.9155.

USDCHF

Article By RoboForex.com

Attention!
Forecasts presented in this section only reflect the author’s private opinion and should not be considered as guidance for trading. RoboForex LP bears no responsibility for trading results based on trading recommendations described in these analytical reviews.

Fibonacci Retracements Analysis 26.03.2021 (AUDUSD, USDCAD)

Article By RoboForex.com

AUDUSD, “Australian Dollar vs US Dollar”

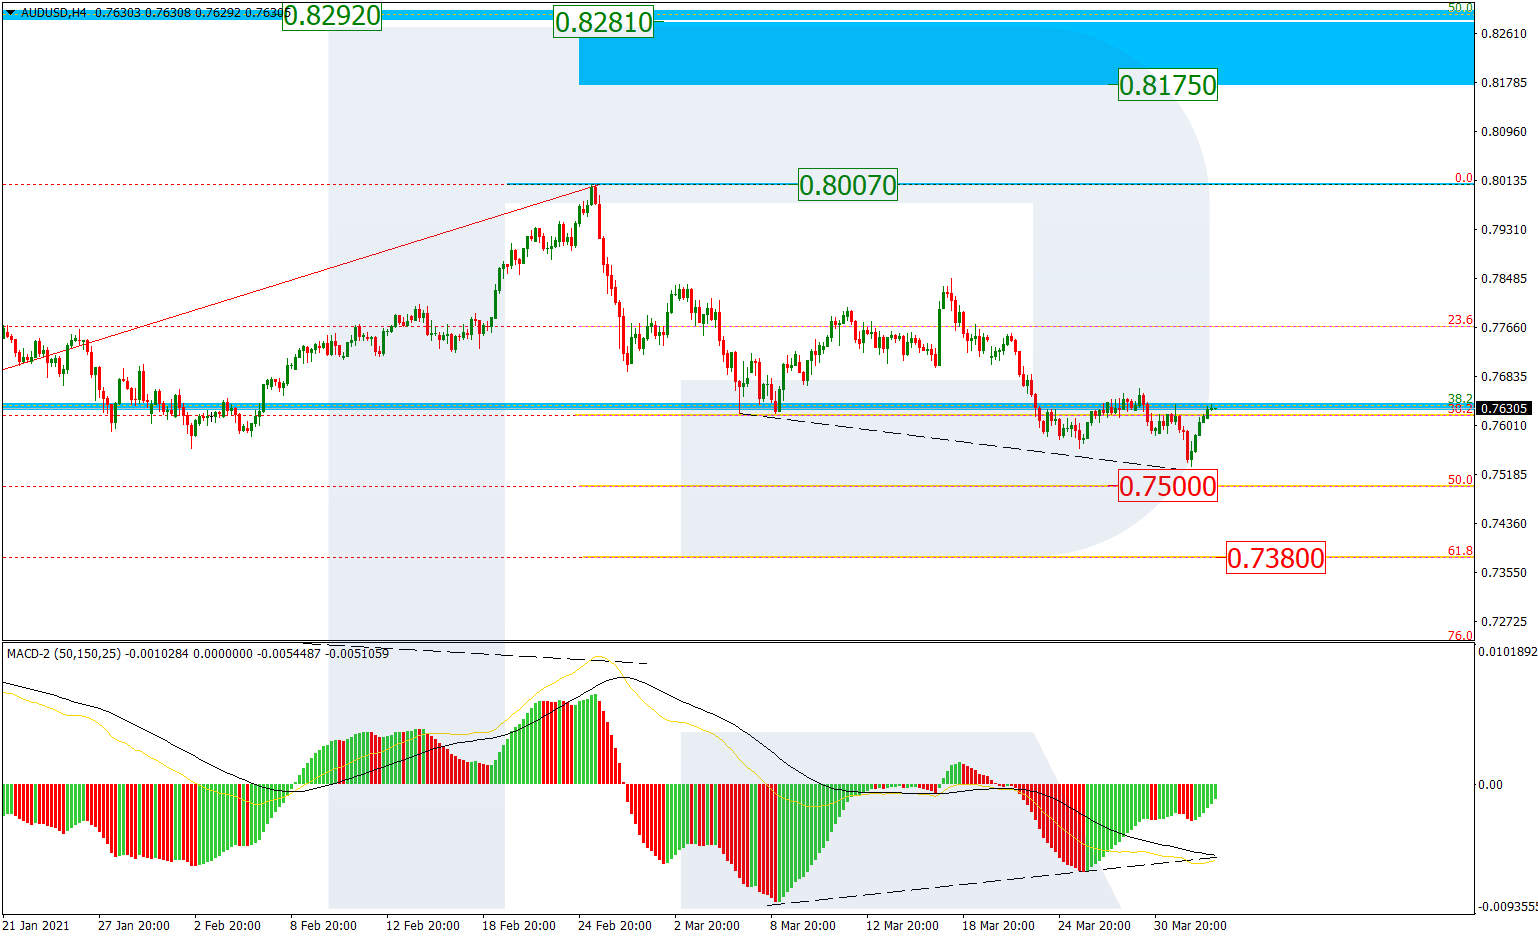
As we can see in the H4 chart, after breaking 38.2% fibo, the “bearish” correctional wave has failed to reach 50.0% fibo at 0.7500. At the same time, there is a local divergence on MACD, which may indicate a possible reversal and a new ascending movement towards the high at 0.8007 and the post-correctional extension area between 138.2% and 161.8% fibo at 0.8175 and 0.8281 respectively. On the other hand, if the price fails to break the high, the instrument may start a new descending wave to reach 50.0% and 61.8% fibo at 0.7500 and 0.7380 respectively.

AUDUSD_H4
Risk Warning: the result of previous trading operations do not guarantee the same results in the future

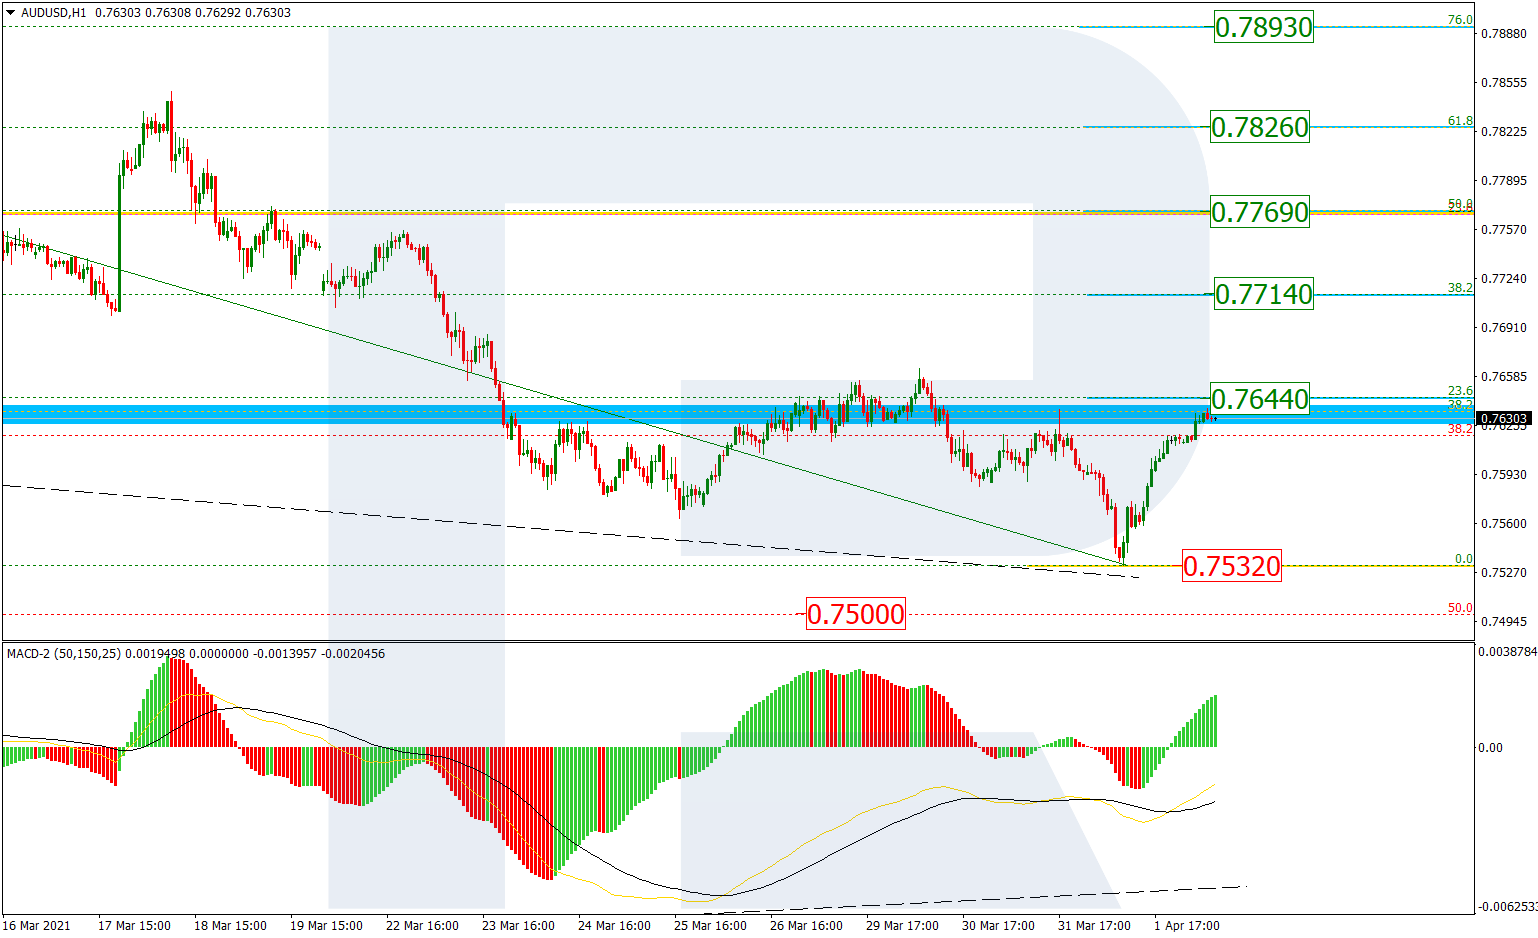
The H1 chart shows a more detailed structure of the current ascending correction after a convergence with the targets at 23.6%, 38.2%, 50.0%, 61.8%, an 76.0% fibo at 0.7668, 0.7732, 0.7785, 0.7837, and 0.7900 respectively. A breakout of the support at 0.7563 will lead to a further mid-term downtrend.

AUDUSD_H1
Risk Warning: the result of previous trading operations do not guarantee the same results in the future

USDCAD, “US Dollar vs Canadian Dollar”

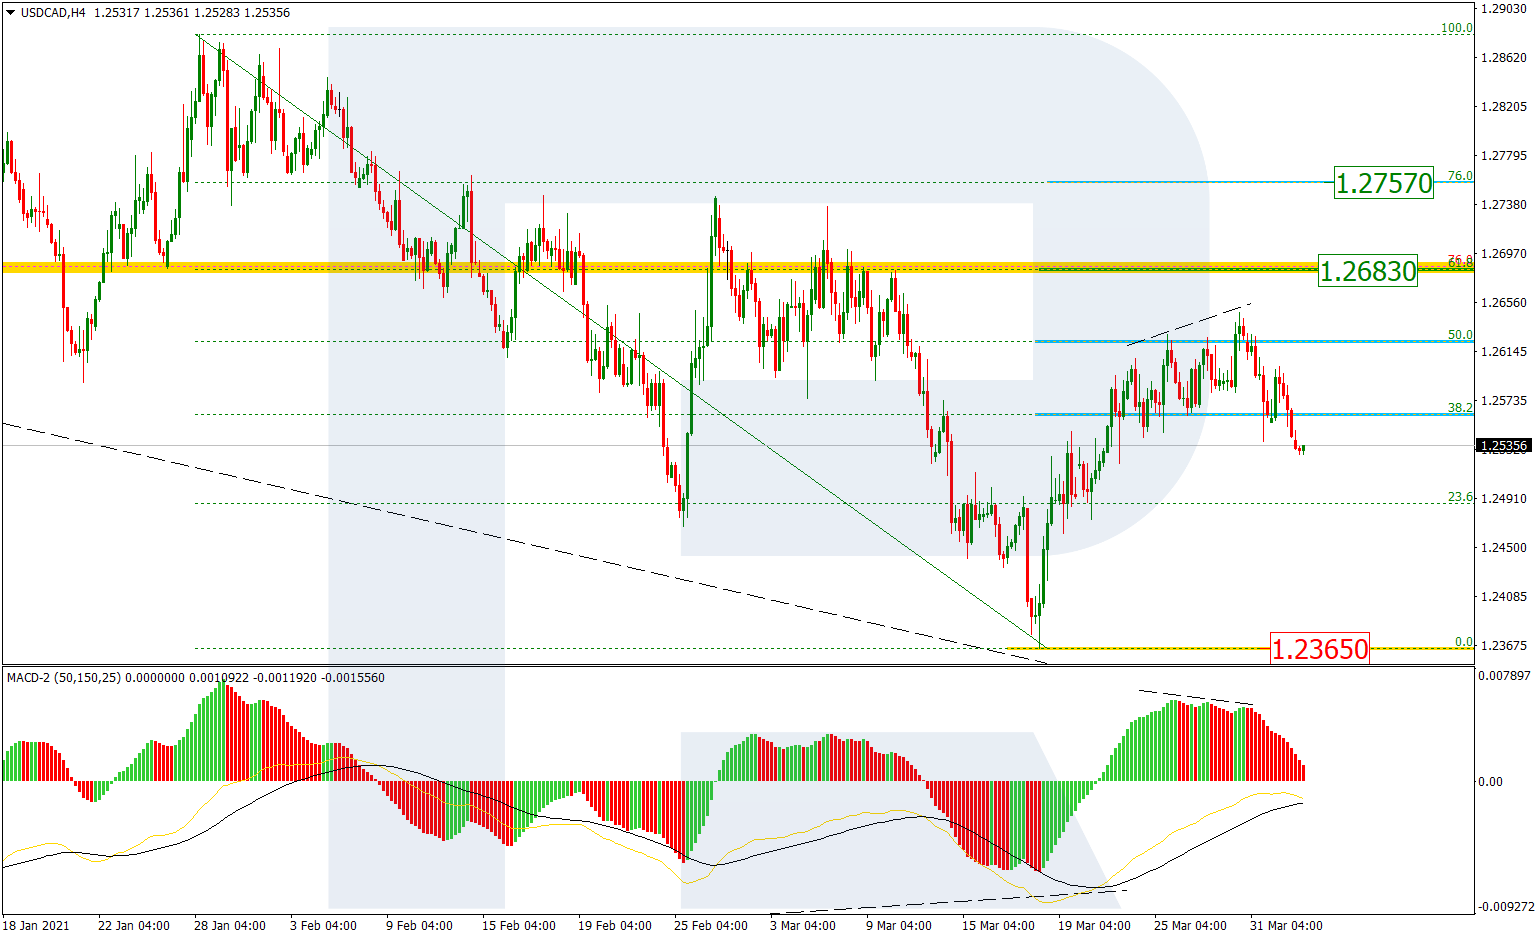
In the H4 chart, USDCAD is correcting upwards after completing another wave to the downside. After reaching 50.0% fibo, the pair has reversed but may soon resume growing towards 50.0% and 61.8% fibo at 1.2683 and 1.2756. respectively.

USDCAD_H4
Risk Warning: the result of previous trading operations do not guarantee the same results in the future

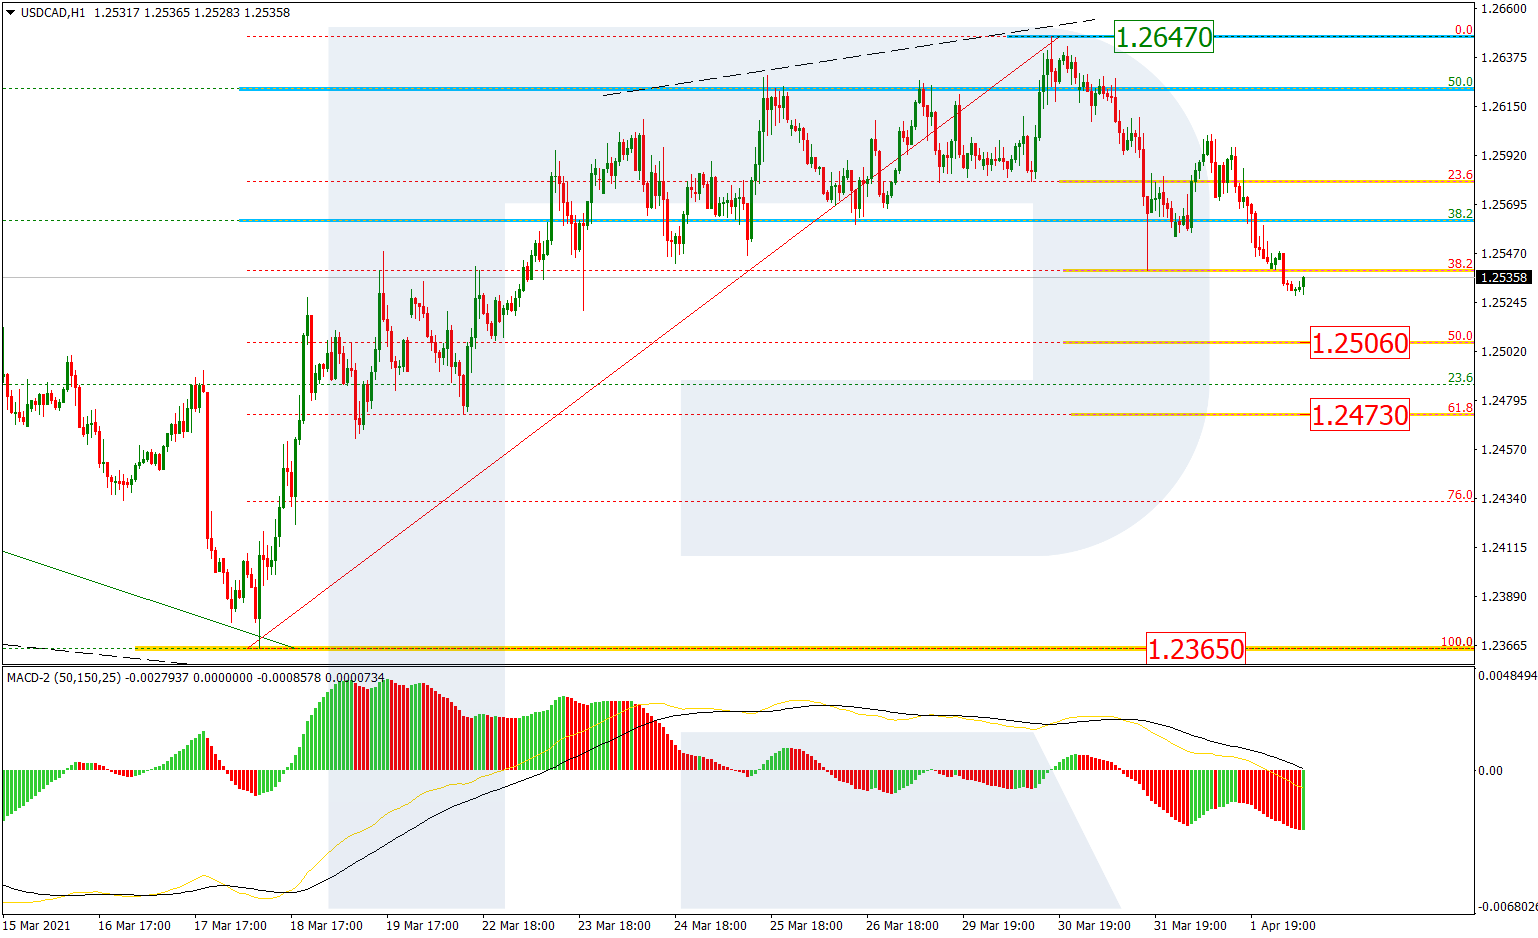
The H1 chart shows a short-term correctional downtrend after the rising wave, which is approaching 23.6% fibo at 1.2567 and may later continue towards 38.2% and 50.0% fibo at 1.2528 and 1.2497 respectively. The key support is the low at 1.2365, while the resistance is the high at 1.2629.

USDCAD_H1

Article By RoboForex.com

Attention!
Forecasts presented in this section only reflect the author’s private opinion and should not be considered as guidance for trading. RoboForex LP bears no responsibility for trading results based on trading recommendations described in these analytical reviews.

The Analytical Overview of the Main Currency Pairs on 2021.03.26

by JustForex

The EUR/USD currency pair

Technical indicators of the currency pair:
  • Prev Open: 1.1813
  • Prev Close: 1.1768
  • % chg. over the last day: -0.38%

Higher-than-expected US GDP data pushed the euro down even further. The yield spread between German Gilts and US Treasuries narrowed sharply by almost 40 basis points to -200.9%. It indicates the likely continuation of the pair’s fall in the medium term.

Trading recommendations
  • Support levels: 1.1746, 1.1688
  • Resistance levels: 1.1889, 1.1990

The main scenario for EUR/USD is selling. The ADX shows strong bearish pressure on the H4 timeframe. On the D1, the trend potential index shows a change in direction from north to south. But the H1 readings indicated an impending pullback, as the ADX declined during the last downward impulse, and a divergence formed on the MACD.

Alternative scenario: if the price manages to gain a foothold above the level of 1.1851, the pair may start a corrective rise to 1.1889 or higher.

EUR/USD
News feed for 2021.03.26:
  • – The German Ifo Business Climate Index (Mar) at 11:00 (GMT+2);
  • – The US University of Michigan Consumer Sentiment Index (Mar) at 16:00 (GMT+2).

The GBP/USD currency pair

Technical indicators of the currency pair:
  • Prev Open: 1.3685
  • Prev Close: 1.3737
  • % chg. over the last day: +0,38%

The sterling stood out from all the group 10 currency pairs that declined against the dollar. The beginning of negotiations between the EU and the UK for the market is a signal for the warming of the relationship between the two sides, as a result of which the British currency is again showing signs of developing growth.

Trading recommendations
  • Support levels: 1.3680, 1.3610
  • Resistance levels: 1.3875, 1.3997

The main scenario for GBP/USD is buying. The ADX has changed direction abruptly and now shows significant bullish pressure. The price was able to break through the SMA 100 moving average, and the MACD entered the positive area, which indicated at least a stop of the fall.

Alternative scenario: if the pair consolidates below 1.3680, the pound may resume its decline.

GBP/USD
News feed for 2021.03.26:
  • – UK Retail Sales (m/m) (Feb) at 09:00 (GMT+2).

The USD/JPY currency pair

Technical indicators of the currency pair:
  • Prev Open: 108.73
  • Prev Close: 109.16
  • % chg. over the last day: -0,40%

In the dollar-yen pair, volatility increased on the back of a rebound in the stock market, but the pair could not get out of its range. After the publication of positive data on US GDP, the rise in share prices supported the pair and the dollar. In this light, medium-term growth expectations have increased.

Trading recommendations
  • Support levels: 108.35, 107.08
  • Resistance levels: 109.34, 109.86

The main scenario is buying. The ADX on the hourly timeframe shows increased bullish pressure, while convergence has formed on the MACD. Considering that the moving averages turned up, the probability of a breakdown of the resistance level at 109.34 increased.

An alternative scenario implies the price-fixing below 108.35. In this case, the pair may fall to 107.08.

USD/JPY
News feed for 2021.03.26:
  • – The US University of Michigan Consumer Sentiment Index (Mar) at 16:00 (GMT+2).

The USD/CAD currency pair

Technical indicators of the currency pair:
  • Prev Open: 1.2576
  • Prev Close: 1.2604
  • % chg. over the last day: +0.22%

The pair resumed its growth amid renewed fall in oil prices. The rise in the dollar index is an additional bullish driver for the pair. Since the news about the blocked Suez Canal only managed to raise oil quotes in the short term, the pair’s outlook in the medium term became positive.

Trading recommendations
  • Support levels: 1.2574, 1.2446
  • Resistance levels: 1.2629, 1.2745

The main scenario is trading in a sideways range between 1.2629 and 1.2530. The ADX showed a substantial increase in bearish pressure in the Asian session. But at the same time, the MACD is near zero, and the price is between the moving averages. Mixed signals indicate a short-term flat.

Alternative scenario: If the price consolidates below 1.2530, the pair may resume its southern movement. A breakout of 1.2629 will indicate a continuation of corrective growth.

USD/CAD
There is no news feed for today.

by JustForex


This article reflects a personal opinion and should not be interpreted as an investment advice, and/or offer, and/or a persistent request for carrying out financial transactions, and/or a guarantee, and/or a forecast of future events.

Markets set to end week on positive note

By Han Tan Market Analyst, ForexTime

Asian stocks are in the green, while US and European equity futures are pushing higher. The dollar index is easing slightly, allowing some reprieve for gold and oil prices.

Although Thursday’s 7-year Treasury auction was met with a dull response again, yields are still some 10 basis points below last week’s peak. Moderating Treasury yields for the week has contributed to the relative calm in equity markets, with the VIX index now back in line with its long-term average around 20.

Steps to normality

Market risk sentiment was buoyed by the lower-than-expected US weekly initial jobs claims, while continuing claims dropped below the 4 million mark for the first time since the pandemic broke out. US stocks also reacted positively Thursday to President Biden’s upward revision to his ambitious vaccination target, which now aims to administer 200 million doses by the end of April.

Markets have shown that investors’ optimism is predicated on the vaccine’s rollout reaching more of the population, forming the basis for the expected economic recovery.

The rotation into cyclically-sensitive counters are testament to such hopes, while the euro’s declines against its major peers are testament to persisting concerns over the snags in the EU’s vaccination efforts.

Financial stocks are set to see another boost when US markets open today, having been the best-performing sector on the S&P 500 on Thursday, after the Fed announced plans to ease up on the pandemic-induced restrictions over US banks’ dividend raises and share buybacks. This presents yet another sign that the worst of the pandemic is behind us, as the financial sector takes another significant stride back towards the world we once knew.

Barring any negative surprises, the Dow Jones index is set to erase its mid-week declines and avoid posting back-to-back weekly declines for the first time this year.

US personal income and spending prints to influence risk appetite

Investors will be monitoring the February US personal income and spending data due to be released later today. Noting that this print is sandwiched between late December’s $600 stimulus checks and the $1400 payments just approved this month, both personal income and spending levels for February are expected to register declines.

A better-than-expected reading may help ensure that US equities go into the weekend on a positive note.

Market participants must stay on their toes

Still, a fresh major catalyst is needed in order for risk assets to roar higher.

In the interim, market participants will just have to continue contending with major cross-currents affecting risk appetite. From signs that Covid-19 cases are making a resurgence globally, to simmering US-China tensions, amid the shifting expectations for the Fed’s policy outlook, the relative calm in markets could yet be upended by the realization of such risks.


Disclaimer: The content in this article comprises personal opinions and should not be construed as containing personal and/or other investment advice and/or an offer of and/or solicitation for any transactions in financial instruments and/or a guarantee and/or prediction of future performance. ForexTime (FXTM), its affiliates, agents, directors, officers or employees do not guarantee the accuracy, validity, timeliness or completeness, of any information or data made available and assume no liability as to any loss arising from any investment based on the same.


Forex-Time-LogoArticle by ForexTime

ForexTime Ltd (FXTM) is an award winning international online forex broker regulated by CySEC 185/12 www.forextime.com