Archive for Forex and Currency News – Page 294

New problems with vaccinations in Europe have stopped the growth of the stock market and put pressure on the euro

by JustForex

On Tuesday, Chancellor Angela Merkel said that Germany will stop using the AstraZeneca Covid-19 vaccine for people under 60 starting from Wednesday, after the appearance of several new cases of blood clots. There was a policy change after the publication of new data on potential side effects approved by regional ministers of health. This is another situation that will impact the imports of Astra and another threat to Europe’s vaccination program, which is already hampered by supply delays, controversy, and political struggles.

Germany’s Independent Vaccination Committee has announced that only older people should be vaccinated with Astra, as rare blood clotting occurs predominantly in recipients who are younger than 60 years.

Against this background, the growth of the stock market stalled, bonds yield retreated from their highs and the euro demonstrated the largest decline among all major currencies. Investors are assessing the possible economic disturbance from a further slowdown in vaccination rates. Nevertheless, benchmark US Treasuries are above 1.70%, still indicating confidence that the global economy will recover soon.

An additional driver of the dollar’s growth was the publication of data on consumer confidence in the United States. The Conference Board index rose to 109.7 from the revised value of 90.4 in February, according to a report that was released on Tuesday. It was the strongest monthly gain in nearly 18 years and surpassed the most optimistic forecasts in the survey.

Household prospects have improved as millions of people have been vaccinated against Covid-19 and restrictions on doing business are recalling. Against this background, the dollar index exceeded the highs on November 12, 2020, while gold fell to the lows of the current month and is trading around $1,680 per troy ounce.

Main market quotes:

S&P 500 (F) 3,944.12 -3.63 (-0.09%)

Dow Jones 33,066.96 -104.41 (-0.31%)

DAX 15,008.61 +190.89 (+1.29%)

FTSE 100 6,772.12 +35.95 (+0.53%)

USD Index 93.332 +0.011 (+0.01%)

Important events:
  • – China Manufacturing PMI (Mar) at 04:00 (GMT+3);
  • – UK GDP (q/q) (4q) at 09:00 (GMT+3);
  • – Germany Unemployment Change (Mar) at 10:55 (GMT+3);
  • – Eurozone CPI (y/y) (Mar) at 12:00 (GMT+3);
  • – ADP Nonfarm Employment Change (Mar) at 15:15 (GMT+3);
  • – US Crude Oil Reserves at 17:30 (GMT+3).

by JustForex


This article reflects a personal opinion and should not be interpreted as an investment advice, and/or offer, and/or a persistent request for carrying out financial transactions, and/or a guarantee, and/or a forecast of future events.

Canadian January GDP: Has CAD Strength Come To An End?

By Orbex

For over a year now, the CAD has been gaining against its southern neighbor.

Part of that has been because the USD got weaker as safe-haven flows diminished. But it seems that the CAD reached its best performance back in mid-March.

Since then, it has been somewhat weaker, and is poised to leave the month with little changed.

Has the CAD touched the bottom?

Another factor in the mix is that oil reached its most recent peak back on March 5th. And it has been on the backfoot through most of the month.

That is even including the disruption in the Suez Canal. (Though most crude transport in that region is mainly for Europe, and represents around 3% of global transportation.)

Another problem facing Canada is the return of Covid cases. While infection rates have gone down in the US, the world is facing a resurgence of cases in a potential “third wave”.

Canada is facing a similar problem, with total case numbers nearly double what they were at the start of the month (though still off the winter highs).

Canada following Europe?

Some experts have suggested a pattern.

Strick lockdowns slow the spread of the virus, which reduces the strain on medical facilities and deaths in the short term. But, the country then can’t come out of the lockdown without a spike in cases, because there isn’t much immunity in the population to slow the spread.

The solution, of course, is to secure immunity through vaccination.

But many countries that have opted for strict lockdowns have been slow to roll out vaccinations, and that includes Canada. So far, less than 10% of the population has been vaccinated, putting the country in the same situation as continental Europe.

Or, sort of. Europe has domestic production of vaccines. Canada, on the other hand, has to import all of its doses. With the US focusing on vaccinating its own population first, Canada has tried to import vaccines from elsewhere.

Expectations are for the US to reach its primary vaccination goal by May. And, presumably, more vaccines would become available for export to Canada from June.

What we are looking for

With lagging vaccination roll-out, expectations are for Canada to remain behind the UK and US in its reopening. In fact, there is potential for a re-application of lockdowns in the near future.

The lack of economic liftoff could keep the CAD under pressure as the situation in March and April might be more similar to the start of the year.

Projections for the January Canadian Monthly GDP indicate a further acceleration to 0.5% monthly, compared to 0.1% recorded in December.

We should remember that was still when the country had lockdowns, which have been eased since then. Therefore, Q1 GDP might show faster growth.

By Orbex

Intraday Market Analysis – Fading Sell-Off

By Orbex

USOIL sees bearish momentum stalling

usoil

WTI climbed back in anticipation of extended production cuts by OPEC+ in their upcoming meeting in April. The pullback would be temporary as an RSI divergence showed a loss in the sell-off.

Following a rebound from the support at 57.20, an RSI double top in the overbought area suggests that the US crude has been consolidating in search of momentum.

The latest breakout above the psychological level at 62.00 is a confirmation that buyers have regained control and the price could be on its way to 65.

USDCAD recovers towards supply area

usdcad

The recent retreat in oil prices has weighed on the loonie while the US dollar kept the high ground across the board. The pair is grinding higher towards the supply zone near 1.27.

However, selling pressure is likely to intensify as the US dollar tests the 20 and 30-day moving averages on the daily chart, within a year-long downtrend.

1.2540 is the immediate support and a bearish breakout could further depress the price action.

To the upside, 1.2680 is the hurdle to lift before the bulls could press for a reversal.

US 30 tests a record high

us30

Stock markets recouped losses from previous choppy sessions as investors saw the dip as an opportunity.

After rallying above the former resistance at 32500, the Dow Jones is making an attempt at the previous high at 33250. A bullish breakout could extend the rally to new record highs.

While market sentiment remains positive, an overbought RSI could prompt a pullback driven by profit takings.

The demand area between 32500 and 32700 could see strong buying interest if the index cools off.

By Orbex

Japanese Candlesticks Analysis 30.03.2021 (EURUSD, USDJPY, EURGBP)

Article By RoboForex.com

EURUSD, “Euro vs. US Dollar”

As we can see in the H4 chart, the asset continues moving downwards. While testing the support area, the pair has formed several reversal patterns, including Doji and Hammer. At the moment, EURUSD may reverse and form a pullback towards the resistance area. In this case, the correctional target may be at 1.1825. However, an alternative scenario implies that the price may continue falling to reach 1.1717 without reversing and correcting.

EURUSD
Risk Warning: the result of previous trading operations do not guarantee the same results in the future

USDJPY, “US Dollar vs. Japanese Yen”

As we can see in the H4 chart, USDJPY has formed several reversal patterns, such as Harami, while testing the support level. Judging by the previous movements, one may assume that the asset may reverse and resume moving upwards. In this case, the upside target is the resistance area at 110.60. At the same time, an opposite scenario implies that the price may fall to return to 109.25 before resuming the ascending tendency.

USDJPY
Risk Warning: the result of previous trading operations do not guarantee the same results in the future

EURGBP, “Euro vs. Great Britain Pound”

As we can see in the H4 chart, the asset continues trading close to the support level. After forming several reversal patterns there, such as Hammer, EURGBP may rebound from the support level and form a slight pullback. In this case, the correctional target may be the resistance area at 0.8600. Still, there might be an alternative scenario, according to which the asset may return to 0.8500 without reversing and correcting.

EURGBP

Article By RoboForex.com

Attention!
Forecasts presented in this section only reflect the author’s private opinion and should not be considered as guidance for trading. RoboForex LP bears no responsibility for trading results based on trading recommendations described in these analytical reviews.

Forex Technical Analysis & Forecast 30.03.2021

Article By RoboForex.com

EURUSD, “Euro vs US Dollar”

EURUSD continues consolidating above 1.1761 without any particular direction. Possibly, today the pair may expand the range down to 1.1751 and then start another correction towards 1.1846. Later, the market may form a new descending structure with the target at 1.1707.

EURUSD
Risk Warning: the result of previous trading operations do not guarantee the same results in the future

GBPUSD, “Great Britain Pound vs US Dollar”

After completing the descending structure at 1.3754, GBPUSD is expected to resume growing and reach 1.3800. After that, the instrument may start another decline with the target at 1.3708 or even 1.3664.

GBPUSD
Risk Warning: the result of previous trading operations do not guarantee the same results in the future

USDRUB, “US Dollar vs Russian Ruble”

After rebounding from 76.12, USDRUB is still falling towards 75.00 and may later grow to reach 75.70, thus forming a new consolidation range around the latter level. According to the main scenario, the price may break the range to the downside and resume falling with the target at 74.50.

USDRUB
Risk Warning: the result of previous trading operations do not guarantee the same results in the future

USDJPY, “US Dollar vs Japanese Yen”

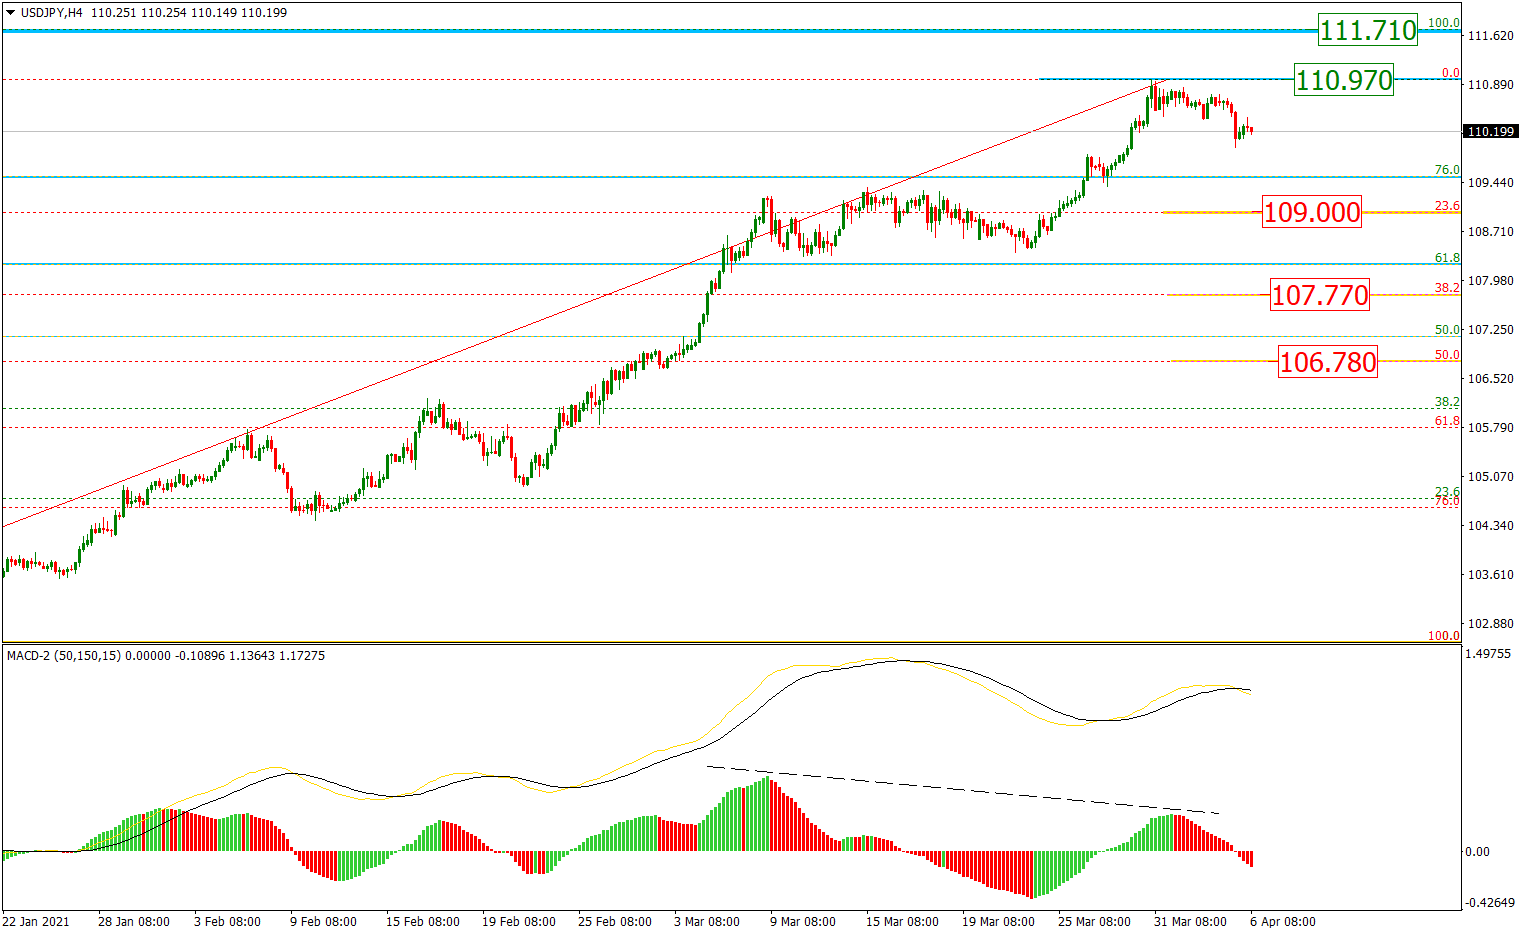
After breaking the consolidation range to the upside, USDJPY is still moving upwards. Possibly, the pair may extend this wave up to 110.08 and then resume trading downwards to break 109.40. After that, the instrument may continue falling with the first target at 108.70.

USDJPY
Risk Warning: the result of previous trading operations do not guarantee the same results in the future

USDCHF, “US Dollar vs Swiss Franc”

After completing the correction at 0.9370, USDCHF is is expected to form one more ascending structure to reach 0.9436 and then start a new decline with the target at 0.9340.

USDCHF
Risk Warning: the result of previous trading operations do not guarantee the same results in the future

AUDUSD, “Australian Dollar vs US Dollar”

AUDUSD has completed the correction to test 0.7644 from below. Possibly, today the pair may grow to reach 0.7700 and then fall towards 0.7515. After that, the instrument may start a new correction to return to 0.7644 and then resume trading downwards with the target at 0.7450.

AUDUSD
Risk Warning: the result of previous trading operations do not guarantee the same results in the future

BRENT

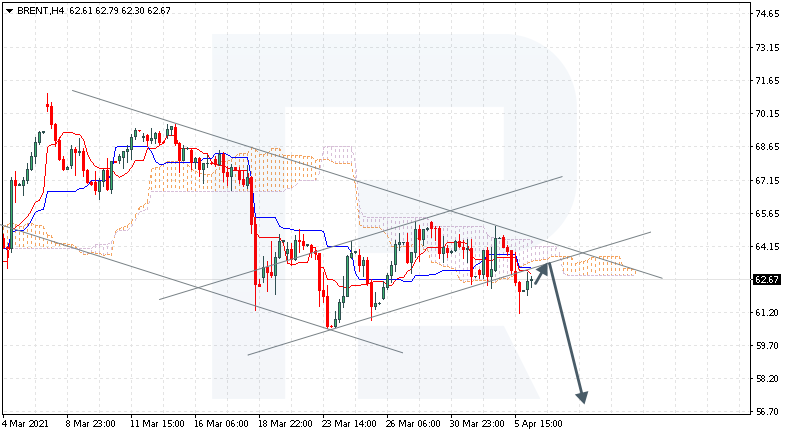
Brent is still consolidating around 64.00. Possibly, the asset may expand the range up to 65.50 to test this level from below or even extend this correction towards 67.40. Later, the market may form a new descending wave with the target at 60.00.

BRENT
Risk Warning: the result of previous trading operations do not guarantee the same results in the future

XAUUSD, “Gold vs US Dollar”

After breaking 1721.44, Gold is still falling. Possibly, today the metal may reach 1697.65 and then form one more ascending structure to return to 1721.44. Later, the market may start a new correction towards 1687.90 and then resume growing with the short-term target at 1776.08.

GOLD
Risk Warning: the result of previous trading operations do not guarantee the same results in the future

S&P 500

The S&P index is still moving upwards. Possibly, the asset may reach 4000.0 and then extend this structure up to 4040.0. After that, the instrument may resume falling to break 3946.1 and then continue the correction with the target at 3861.0.

S&P 500

Article By RoboForex.com

Attention!
Forecasts presented in this section only reflect the author’s private opinion and should not be considered as guidance for trading. RoboForex LP bears no responsibility for trading results based on trading recommendations described in these analytical reviews.

The Analytical Overview of the Main Currency Pairs on 2021.03.30

by JustForex

The EUR/USD currency pair

Technical indicators of the currency pair:
  • Prev Open: 1.1792
  • Prev Close: 1.1764
  • % chg. over the last day: -0.24%

On Monday, the euro completely leveled the entire Friday growth. The price closed at last week’s lows, which indicated the likelihood of further decline. Positive expectations for the US labor market and negative sentiment in Europe due to new quarantine measures put pressure on the pair.

Trading recommendations
  • Support levels: 1.1746, 1.1688
  • Resistance levels: 1.1889, 1.1990

The main scenario for trading EUR/USD is selling. There are few important events on the economic calendar today, so low volatility is expected. Technical indicators still show the likelihood of the continuation of the smooth downtrend. The ADX continues to show a subtle reaction at the minimum price decline.

Alternative scenario: if the price gains a foothold above the level of 1.1795, the pair may start a corrective rise to 1.1889 or higher.

EUR/USD
News feed for 2021.03.30:
  • – The German Consumer Price Index (CPI) (m/m) (Mar) at 15:00 (GMT+3);
  • – The US CB Consumer Confidence Index (Mar) at 17:00 (GMT+3).

The GBP/USD currency pair

Technical indicators of the currency pair:
  • Prev Open: 1.3782
  • Prev Close: 1.3758
  • % chg. over the last day: -0.17%

The sterling showed higher volatility than the euro on Monday. The growth that took place during the European session completely vanished later in the American session. The price bounced off the moving average on the daily chart, and a bearish engulfing candlestick formed, indicating strong bearish pressure.

Trading recommendations
  • Support levels: 1.3680, 1.3610
  • Resistance levels: 1.3812, 1.3846

The main scenario for trading GBP/USD is selling. The technical indicators have changed completely. The ADX has shown a strong reaction to the decline. But the price stays between the moving averages, which may indicate the development of a sideways trend. Based on a combination of factors, there is a moderate southern signal.

Alternative scenario: if the pair consolidates above 1.3812, the pound may resume its growth.

GBP/USD
News feed for 2021.03.30:
  • – The US CB Consumer Confidence Index (Mar) at 17:00 (GMT+3).

The USD/JPY currency pair

Technical indicators of the currency pair:
  • Prev Open: 109.74
  • Prev Close: 109.80
  • % chg. over the last day: +0.05%

In the dollar-yen pair, volatility has eased slightly, but the bullish sentiment remains strong. The fundamentals of the stock market’s growth are still solid, and the dollar is supported by rising bond yields and the expectation of faster economic growth.

Trading recommendations
  • Support levels: 109.38, 108.35
  • Resistance levels: 110.32, 110.71

The main scenario is buying. The ADX on the H1, the H4, and the D1 timeframes shows the growth of bullish pressure, but the upside potential is slightly reduced. A divergence has formed on the MACD, and this is the first signal for an impending correction. But as long as the price is above the moving averages, buying is safe.

An alternative scenario implies price fixing below 109.38. In this case, the pair could drop to 108.35.

USD/JPY
News feed for 2021.03.30:
  • – The US CB Consumer Confidence Index (Mar) at 17:00 (GMT+3).

The USD/CAD currency pair

Technical indicators of the currency pair:
  • Prev Open: 1.2571
  • Prev Close: 1.2587
  • % chg. over the last day: +0.13%

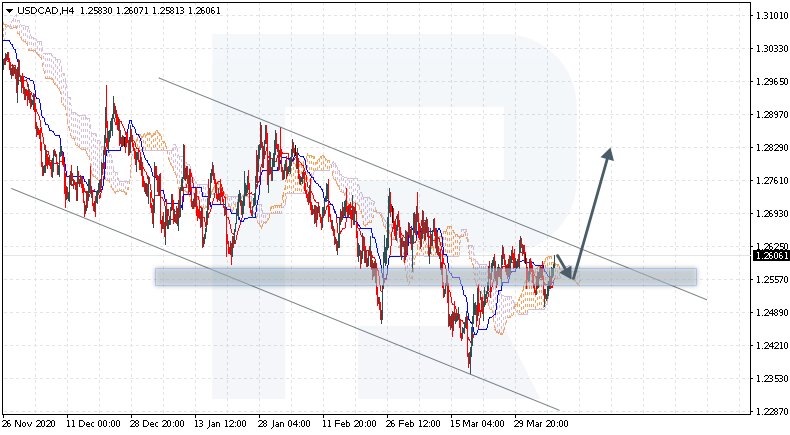
The Canadian dollar lost the least among the G10 currencies against the US dollar. Continued growth in oil prices ahead of the OPEC + meeting puts pressure on the pair. The daily chart shows that strong resistance has formed, which could trigger a southern pullback or a renewed decline.

Trading recommendations
  • Support levels: 1.2574, 1.2446
  • Resistance levels: 1.2629, 1.2745

The main scenario is trading in a sideways range between 1.2546 and 1.2629. The ADX fell to its minimum values, and the MACD is at the zero level, which indicates the development of a sideways movement. Since the price bounced twice from the resistance of 1.2629, the likelihood of a correction increased.

Alternative scenario: if the price consolidates below 1.2546, the pair may resume its southern movement to 1.2466.

USD/CAD
There is no news feed for today.

by JustForex


This article reflects a personal opinion and should not be interpreted as an investment advice, and/or offer, and/or a persistent request for carrying out financial transactions, and/or a guarantee, and/or a forecast of future events.

Technical Outlook: G10 Currencies Under The Spotlight

By Lukman Otunuga Research Analyst, ForexTime 

– The next few days promise to be eventful as investors juggle with key economic data from major economies, Joe Biden’s speech on infrastructure spending, and US jobs report on Friday. Given how these events could spark volatility and result in potential opportunities across markets, it may be wise to fasten your seatbelts.

Our focus today will revolve around the G10 space with the weapon of choice none other than technical analysis.

Dollar solid as a rock?

Dollar bulls seem to be on a roll this morning. Prices are advancing towards the 93.20 resistance level while the MACD is well above the 0 mark. However, the Relative Strength Index is blinking overbought! A solid breakout above 93.20 may inspire an incline towards 93.70.

Pound depressed below 1.3800 

After punching above the 1.3800 level yesterday, bears immediately returned to the scene. Prices are trading around 1.3750 as of writing with the next key level of interest at 1.3669. Should 1.3800 prove to be unreliable resistance, prices could charge towards 1.4000.

EURUSD sulks under 1.1800 

The EURUSD remains in a downtrend on the daily charts. There have been consistently lower lows and lower highs while the MACD trades below 0. Sustained weakness below 1.1800 could encourage a decline towards 1.1740. If prices end up breaking above 1.1800, this may trigger a technical rebound towards 1.1900.

USDJPY higher highs and higher lows 

The chart says it all. Prices are heavily bullish on the daily timeframe. The solid breakout above the 109.30 resistance may open the doors towards 110.60.

GBPJPY: the trend is your friend 

It is safe to say that the GBPJPY is heavily bullish on the daily charts. Prices are trading above the 20 SMA while the MACD trades above 0. A solid daily close above 152.50 may inspire an incline towards 154.00 which is 150 pips away! Should 152.50 prove to be reliable resistance, the currency pair may slip back towards 150.00 and 148.50, respectively.

AUDUSD waits for catalyst 

It looks like the AUDUSD remains trapped in a wide range. Although the candlesticks are trading below the 50-day simple moving average, the RSI is near oversold territory. If 0.7580 proves to be reliable support, a rebound back towards 0.7700 and 0.7820 could be on the table.

What’s going on with Gold?

The precious metal extended losses this morning thanks to an appreciating Dollar and jump in real yields. Given how prices are trading below the $1700 psychological level, further downside could be on the cards with the next key point of interest around $1680.

Disclaimer: The content in this article comprises personal opinions and should not be construed as containing personal and/or other investment advice and/or an offer of and/or solicitation for any transactions in financial instruments and/or a guarantee and/or prediction of future performance. ForexTime (FXTM), its affiliates, agents, directors, officers or employees do not guarantee the accuracy, validity, timeliness or completeness, of any information or data made available and assume no liability as to any loss arising from any investment based on the same.


Forex-Time-LogoArticle by ForexTime

ForexTime Ltd (FXTM) is an award winning international online forex broker regulated by CySEC 185/12 www.forextime.com

Hedge fund blow-up and cargo ship removal…it’s a funny old world!

By Lukman Otunuga Research Analyst, ForexTime

As traders, we have to deal with many varied and obscure headlines whilst sitting at our screens. And today is no exception with the Suez Canal potentially getting back to normal while some huge investment banks count the cost of lending to an opaque family office. US stocks have opened lower on the day as markets continue to trade in quiet risk-off fashion.

The dollar is generally mixed to slightly better bid against its major peers with GBP leading the charts and rebounding from rather “cheap” levels in the upper 1.36s in cable.

Whodunnit selling

The liquidation of a large hedge fund managed by a family office is souring the mood with the chance of more forced selling after the investment fund failed a margin call – essentially a demand to put up more collateral against its trades or face a forced liquidation. There are several questions being asked about how a fund manager with a chequered past could wrack up such large leverage to fund speculative stock purchases, with the unwinding of assets causing major pain to some household banking names. Nomura and Credit Suisse have been hit especially hard although the wider fallout from the Friday’s deleveraging is expected to be a one-off and contained.

The S&P closed on record highs last week and is now clawing back earlier losses seen in the futures. A double top had been developing on Thursday but the 50-day moving average acted as decent support and traders are now looking to push through resistance just below the magic 4,000 level.

Global trade blockage ends

Its 15 minutes of fame is over! Never has a big ship (skyscraper-sized in fact) caused such endless fascination, but it seems “Ever Given”, the cargo ship which had been stuck in the Suez Canal for almost a week has been set free to sail off into the sunset. The blockage had created a build-up of around 370 vessels on either side of the canal, which carries roughly 12% of global trade. Around $10 billion of trade passes through the canal each day.

Oil has barely moved, with prices marginally weaker and WTI desperately trying to remain above $60. The market has one eye on the OPEC+ meeting scheduled for this Thursday. Analysts expect the major oil producers to hold off again from raising their output quotas. The demand picture has been damaged by the extended lockdowns in Europe, so this is expected to provide some support to prices.

On the daily chart, $57.28 is now established as strong support after holding prices around there last week. Bulls will look to push prices higher above last week’s high at $62 before taking aim at recent cycle highs.

Disclaimer: The content in this article comprises personal opinions and should not be construed as containing personal and/or other investment advice and/or an offer of and/or solicitation for any transactions in financial instruments and/or a guarantee and/or prediction of future performance. ForexTime (FXTM), its affiliates, agents, directors, officers or employees do not guarantee the accuracy, validity, timeliness or completeness, of any information or data made available and assume no liability as to any loss arising from any investment based on the same.


Forex-Time-LogoArticle by ForexTime

ForexTime Ltd (FXTM) is an award winning international online forex broker regulated by CySEC 185/12 www.forextime.com

Intraday Market Analysis – Bullish Case

By Orbex

USDJPY accelerates rally

usdjpy

The US dollar climbs as the US economy is gaining steam while other parts of the world face new Covid restrictions.

The pair has shot up to last June’s high at 109.85 after it broke out of the consolidation range under 109. The bias remains strongly bullish, though an overbought RSI would suggest a temporary pullback as traders take profit.

In that case, the rising trendline and 20 and 30-hour moving averages would become the demand zone. A deeper retracement may find support from the former resistance at 109.20.

XAUUSD awaits breakout catalyst

xauusd

A firm US dollar is weighing on gold as Treasury yields hold ground. The recovery stalled after the price broke below the rising trendline, denting the optimism for a swift rebound.

The precious metal is likely to stay range-bound until a catalyst, be it fundamental or technical, triggers a breakout.

1718 is a key support and a bearish breakout could deepen the correction towards 1700.

To the upside, bulls will need to remove 1745 to bring back confidence. After that, an extended rally may carry the price to 1780.

GER 30 surges to new high

ger30

Equity markets recovered swiftly after lower-than-expected US personal consumption expenditure quelled the fear of reflation.

The DAX has bounced off the key short-term support at 14430 to challenge the all-time high at 14800.

Solid momentum above a bullish MA cross confirms that buyers are still in control of the price action. A close above 14800 may convince more trend followers to join in and push the index higher.

To the downside, 14590 would be the immediate support for the RSI to cool off.

By Orbex

Fibonacci Retracements Analysis 29.03.2021 (GOLD, USDCHF)

Article By RoboForex.com

XAUUSD, “Gold vs US Dollar”

As we can see in the H4 chart, the situation hasn’t changed much since last Monday. After reaching 23.6% fibo, XAUUSD is still moving there and forming the consolidation range. In this case, both upward and downwards scenarios are possible. The first one implies a further ascending correction towards 38.2% and 50.0% fibo at 1785.00 and 1818.15 respectively. The second scenario suggests a new descending impulse and a breakout of the low at 1676.78. Later, the market may continue falling to reach its mid-term target, which is 50.0% fibo at 1617.50.

GOLD_H4
Risk Warning: the result of previous trading operations do not guarantee the same results in the future

The H1 chart shows a more detailed structure of the current short-term correction after a divergence. At the moment, the asset is trading between 23.6% and 38.2% fibo and may soon resume falling towards 50.0%, 61.8%, and 76.0% fibo at 1716.09, 1706.85, and 1695.75 respectively. The resistance is the local high at 1755.52.

GOLD_H1
Risk Warning: the result of previous trading operations do not guarantee the same results in the future

USDCHF, “US Dollar vs Swiss Franc”

The daily chart shows that USDCHF continues the ascending tendency after completing a short-term pullback. After breaking 38.2% fibo, the asset is heading towards 50.0% and 61.8% fibo at 0.9496 and 0.9672 respectively. The key support is the low at 0.8758.

USDCHF_D1
Risk Warning: the result of previous trading operations do not guarantee the same results in the future

As we can see in the H4 chart, after breaking the previous local high at 0.9376, the pair is heading towards 50.0% fibo at 0.9496. At the same time, there is a divergence on MACD, which may indicate a new pullback after the price reaches its target. The correctional targets may be 23.6%, 38.2%, and 50.0% fibo at 0.9348, 0.9256, and 0.9183 respectively.

USDCHF_H4

Article By RoboForex.com

Attention!
Forecasts presented in this section only reflect the author’s private opinion and should not be considered as guidance for trading. RoboForex LP bears no responsibility for trading results based on trading recommendations described in these analytical reviews.