Archive for Forex and Currency News – Page 290

Ichimoku Cloud Analysis 12.04.2021 (EURUSD, GBPUSD, EURGBP)

Article By RoboForex.com

EURUSD, “Euro vs US Dollar”

EURUSD is trading at 1.1889; the instrument is moving above Ichimoku Cloud, thus indicating an ascending tendency. The markets could indicate that the price may test the cloud’s upside border at 1.1860 and then resume moving upwards to reach 1.2075. Another signal in favor of a further uptrend will be a rebound from the descending channel’s upside border. However, the bullish scenario may be canceled if the price breaks the cloud’s downside border and fixes below 1.1775. In this case, the pair may continue falling towards 1.1665.

EURUSD
Risk Warning: the result of previous trading operations do not guarantee the same results in the future

GBPUSD, “Great Britain Pound vs US Dollar”

GBPUSD is trading at 1.3698; the instrument is moving below Ichimoku Cloud, thus indicating a descending tendency. The markets could indicate that the price may test the cloud’s downside border at 1.3785 and then resume moving downwards to reach 1.3435. Another signal in favor of a further downtrend will be a rebound from the resistance level. However, the bearish scenario may no longer be valid if the price breaks the cloud’s upside border and fixes above 1.3875. In this case, the pair may continue growing towards 1.3965. To confirm further decline, the asset must break the downside border of the Triangle pattern and fix below 1.3585. The target of the pattern materialization is 1.3375.

GBPUSD
Risk Warning: the result of previous trading operations do not guarantee the same results in the future

EURGBP, “Euro vs Great Britain Pound”

EURGBP is trading at 0.8685; the instrument is moving above Ichimoku Cloud, thus indicating an ascending tendency. The markets could indicate that the price may test Tenkan-Sen and Kijun-Sen at 0.8655 and then resume moving upwards to reach 0.8805. Another signal in favor of a further uptrend will be a rebound from the descending channel’s upside border. However, the bullish scenario may no longer be valid if the price breaks the cloud’s downside border and fixes below 0.8545. In this case, the pair may continue falling towards 0.8455.

EURGBP

Article By RoboForex.com

Attention!
Forecasts presented in this section only reflect the author’s private opinion and should not be considered as guidance for trading. RoboForex LP bears no responsibility for trading results based on trading recommendations described in these analytical reviews.

The Analytical Overview of the Main Currency Pairs on 2021.04.12

by JustForex

The EUR/USD currency pair

Technical indicators of the currency pair:
  • Prev Open: 1.1913
  • Prev Close: 1.1900
  • % chg. over the last day: -0.11%

The euro fell slightly against the US dollar as part of the technical correction on Friday. As trading volumes were significantly reduced at the end of the week, the currencies of the 10 group entered a correction phase.

Trading recommendations
  • Support levels: 1.1836, 1.1704
  • Resistance levels: 1.1915, 1.1990

The main scenario for EUR/USD is selling. The technical picture looks bearish. The MACD is near zero, and divergence has formed, which indicates an approaching correction. The ADX reacted strongly to the southern impulse, indicating an increase in bearish pressure.

Alternative scenario: if the price manages to gain a foothold above the level of 1.1915, the pair may return to growth to 1.1990.

EUR/USD
There is no news feed for today.

The GBP/USD currency pair

Technical indicators of the currency pair:
  • Prev Open: 1.3730
  • Prev Close: 1.3707
  • % chg. over the last day: -0.17%

The sterling declined on Friday amid correction of the US dollar. The pressure on the British currency is taking place due to the AstraZeneca vaccine situation, which may undermine the vaccination program in the UK.

Trading recommendations
  • Support levels: 1.3705, 1.3680
  • Resistance levels: 1.3848, 1.3929

The main scenario for GBP/USD is selling. The pair has come close to the first support level. As long as the price is below the moving averages, the risk of a breakdown is high. However, the ADX shows a decrease in the southern trend’s potential and a divergence formed on the MACD. It indicates a possible temporary stop in the southern movement.

Alternative scenario: if the pair consolidates above 1.3800, the pound may move upward to 1.3848.

GBP/USD
There is no news feed for today.

The USD/JPY currency pair

Technical indicators of the currency pair:
  • Prev Open: 109.26
  • Prev Close: 109.67
  • % chg. over the last day: -0.51%

The dollar-yen pair rose on Friday amid a correction in the dollar index and US Treasuries, the yield of which rose to 1.65%. The market has seen a decrease in demand for defensive assets, including gold, Swiss franc, and yen.

Trading recommendations
  • Support levels: 108.35, 107.08
  • Resistance levels: 110.32, 110.98

The main scenario is trading in a sideways range. The price is still fixed below the moving averages. The MACD is near zero, and convergence has formed on the chart, which indicates a possible stop of the decline. At the same time, the ADX shows a decline in the bearish trend potential. By a combination of factors, there is a signal for sideways movement within the day.

The alternative scenario implies the price fixing above 109.90. In this case, the pair may resume growth to 110.32.

USD/JPY
There is no news feed for today.

The USD/CAD currency pair

Technical indicators of the currency pair:
  • Prev Open: 1.2560
  • Prev Close: 1.2526
  • % chg. over the last day: +0.27%

The pair continues to trade in a narrow sideways range, as oil quotes have stabilized around $59 per barrel. The slight decline was due to the continued decline in the dollar index.

Trading recommendations
  • Support levels: 1.2554, 1.2501
  • Resistance levels: 1.2629, 1.2646

The main scenario is trading in a sideways range between 1.2554 and 1.2629. Specifications are mixed. Price is stuck between the moving averages. The MACD is near zero. However, the ADX shows a strong reaction to the decline in quotations, which indicates a potential risk of a breakdown of the first support level.

Alternative scenario: if the price manages to consolidate below 1.2554, the pair may resume its decline to 1.2501. A breakout of 1.2629 would indicate an advance to 1.2646 or higher.

USD/CAD
There is no news feed for today.

by JustForex


This article reflects a personal opinion and should not be interpreted as an investment advice, and/or offer, and/or a persistent request for carrying out financial transactions, and/or a guarantee, and/or a forecast of future events.

COT Currency Futures Charts: Brazil Real, Swiss Franc, Euro, US Dollar & Bitcoin

By CountingPips.comReceive our weekly COT Reports by Email

Here are the latest charts and statistics for the Commitment of Traders (COT) data published by the Commodities Futures Trading Commission (CFTC).

The latest COT data is updated through Tuesday April 06 2021 and shows a quick view of how large traders (for-profit speculators and commercial entities) were positioned in the futures markets. All currency positions are in direct relation to the US dollar where, for example, a bet for the euro is a bet that the euro will rise versus the dollar while a bet against the euro will be a bet that the euro will decline versus the dollar.


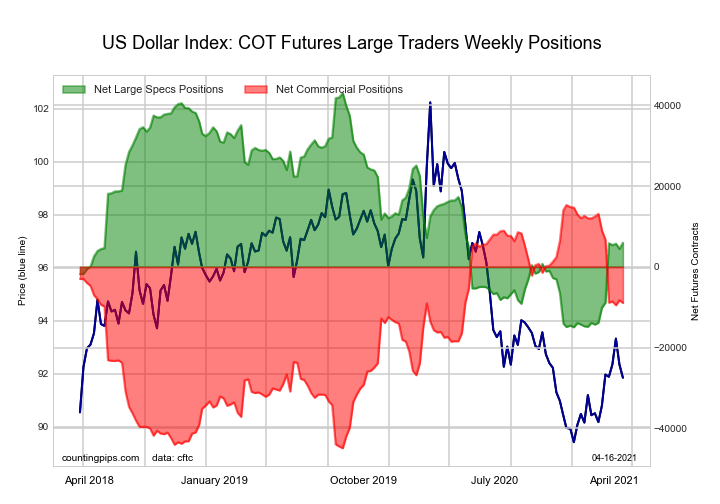
US DOLLAR INDEX Futures:


The US DOLLAR INDEX: large speculator standing this week equaled a net position of 4,449 contracts in the data reported through Tuesday. This was a weekly decrease of -1,277 contracts from the previous week which had a total of 5,726 net contracts.

This week’s current strength score (the trader positioning range over the past three years, measured from 0 to 100) shows the speculators are currently Bearish with a score of 33.5 percent. The commercials are Bullish with a score of 60.9 percent and the small traders (not shown in chart) are Bullish with a score of 68.3 percent.

US DOLLAR INDEX StatisticsSPECULATORSCOMMERCIALSSMALL TRADERS
– Percent of Open Interest Longs:70.86.915.8
– Percent of Open Interest Shorts:59.528.06.1
– Net Position:4,449-8,2313,782
– Gross Longs:27,7062,7136,179
– Gross Shorts:23,25710,9442,397
– Long to Short Ratio:1.2 to 10.2 to 12.6 to 1
NET POSITION TREND:
– COT Index Score (3 Year Range Pct):33.560.968.3
– COT Index Reading (3 Year Range):BearishBullishBullish
NET POSITION MOVEMENT INDEX:
– 6-Week Change in Strength Index:31.6-35.539.3


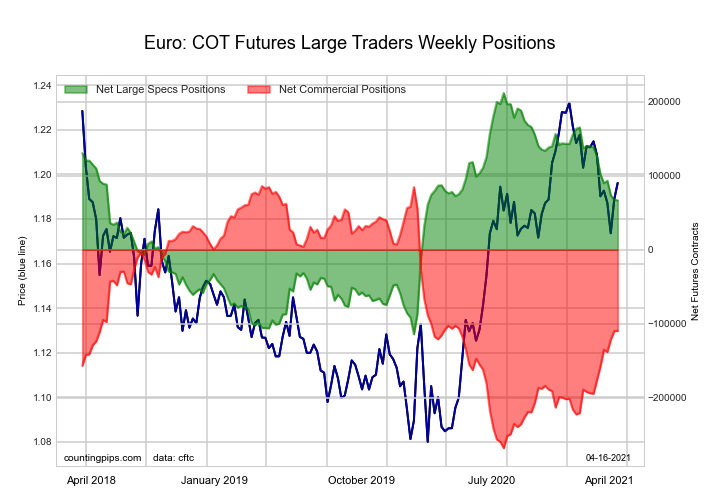
EURO Currency Futures:


The EURO Currency: large speculator standing this week equaled a net position of 67,522 contracts in the data reported through Tuesday. This was a weekly reduction of -6,217 contracts from the previous week which had a total of 73,739 net contracts.

This week’s current strength score (the trader positioning range over the past three years, measured from 0 to 100) shows the speculators are currently Bullish with a score of 55.7 percent. The commercials are Bearish with a score of 44.7 percent and the small traders (not shown in chart) are Bullish with a score of 64.6 percent.

EURO Currency StatisticsSPECULATORSCOMMERCIALSSMALL TRADERS
– Percent of Open Interest Longs:29.955.114.0
– Percent of Open Interest Shorts:19.472.27.4
– Net Position:67,522-109,74142,219
– Gross Longs:192,230354,40189,693
– Gross Shorts:124,708464,14247,474
– Long to Short Ratio:1.5 to 10.8 to 11.9 to 1
NET POSITION TREND:
– COT Index Score (3 Year Range Pct):55.744.764.6
– COT Index Reading (3 Year Range):BullishBearishBullish
NET POSITION MOVEMENT INDEX:
– 6-Week Change in Strength Index:-21.723.9-24.2


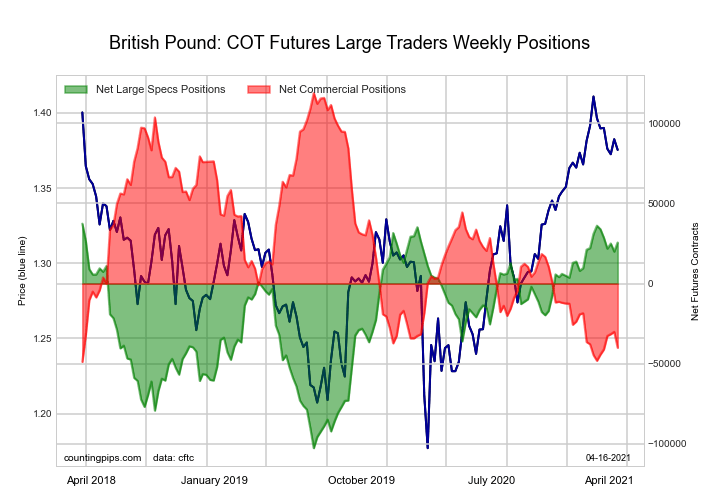
BRITISH POUND STERLING Futures:


The BRITISH POUND STERLING: large speculator standing this week equaled a net position of 19,951 contracts in the data reported through Tuesday. This was a weekly lowering of -5,008 contracts from the previous week which had a total of 24,959 net contracts.

This week’s current strength score (the trader positioning range over the past three years, measured from 0 to 100) shows the speculators are currently Bullish-Extreme with a score of 81.5 percent. The commercials are Bearish-Extreme with a score of 18.3 percent and the small traders (not shown in chart) are Bullish-Extreme with a score of 86.8 percent.

BRITISH POUND StatisticsSPECULATORSCOMMERCIALSSMALL TRADERS
– Percent of Open Interest Longs:32.242.524.9
– Percent of Open Interest Shorts:18.063.917.6
– Net Position:19,951-30,12710,176
– Gross Longs:45,27059,71434,960
– Gross Shorts:25,31989,84124,784
– Long to Short Ratio:1.8 to 10.7 to 11.4 to 1
NET POSITION TREND:
– COT Index Score (3 Year Range Pct):81.518.386.8
– COT Index Reading (3 Year Range):Bullish-ExtremeBearish-ExtremeBullish-Extreme
NET POSITION MOVEMENT INDEX:
– 6-Week Change in Strength Index:-7.38.0-8.2


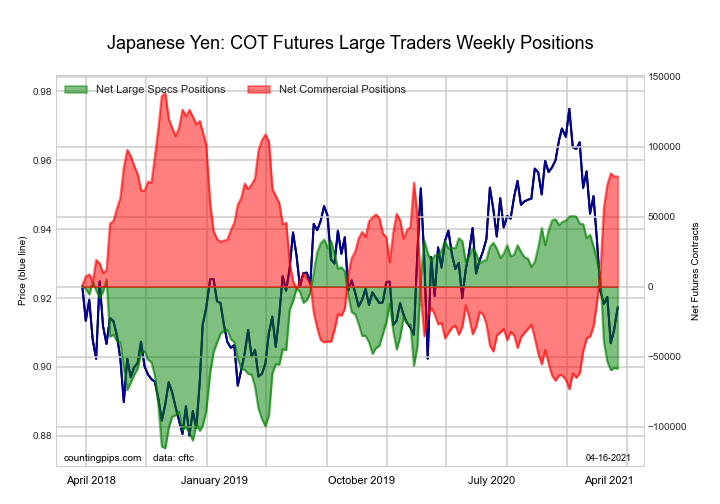
JAPANESE YEN Futures:


The JAPANESE YEN: large speculator standing this week equaled a net position of -57,989 contracts in the data reported through Tuesday. This was a weekly lift of 1,492 contracts from the previous week which had a total of -59,481 net contracts.

This week’s current strength score (the trader positioning range over the past three years, measured from 0 to 100) shows the speculators are currently Bearish with a score of 34.5 percent. The commercials are Bullish with a score of 71.8 percent and the small traders (not shown in chart) are Bearish-Extreme with a score of 16.9 percent.

JAPANESE YEN StatisticsSPECULATORSCOMMERCIALSSMALL TRADERS
– Percent of Open Interest Longs:16.371.711.5
– Percent of Open Interest Shorts:51.623.924.0
– Net Position:-57,98978,537-20,548
– Gross Longs:26,794117,84618,907
– Gross Shorts:84,78339,30939,455
– Long to Short Ratio:0.3 to 13.0 to 10.5 to 1
NET POSITION TREND:
– COT Index Score (3 Year Range Pct):34.571.816.9
– COT Index Reading (3 Year Range):BearishBullishBearish-Extreme
NET POSITION MOVEMENT INDEX:
– 6-Week Change in Strength Index:-52.350.5-38.2


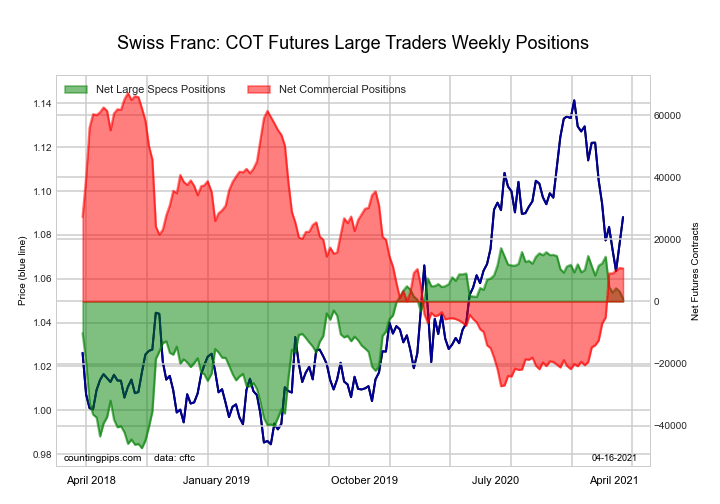
SWISS FRANC Futures:


The SWISS FRANC: large speculator standing this week equaled a net position of 3,245 contracts in the data reported through Tuesday. This was a weekly decrease of -1,024 contracts from the previous week which had a total of 4,269 net contracts.

This week’s current strength score (the trader positioning range over the past three years, measured from 0 to 100) shows the speculators are currently Bullish with a score of 78.4 percent. The commercials are Bearish with a score of 40.3 percent and the small traders (not shown in chart) are Bearish with a score of 27.5 percent.

SWISS FRANC StatisticsSPECULATORSCOMMERCIALSSMALL TRADERS
– Percent of Open Interest Longs:35.943.420.3
– Percent of Open Interest Shorts:28.518.752.4
– Net Position:3,24510,786-14,031
– Gross Longs:15,69018,9708,848
– Gross Shorts:12,4458,18422,879
– Long to Short Ratio:1.3 to 12.3 to 10.4 to 1
NET POSITION TREND:
– COT Index Score (3 Year Range Pct):78.440.327.5
– COT Index Reading (3 Year Range):BullishBearishBearish
NET POSITION MOVEMENT INDEX:
– 6-Week Change in Strength Index:-12.924.7-41.1


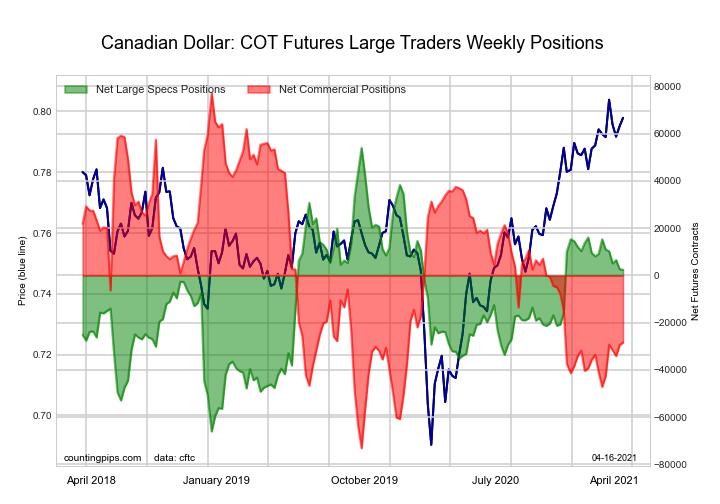
CANADIAN DOLLAR Futures:


The CANADIAN DOLLAR: large speculator standing this week equaled a net position of 2,690 contracts in the data reported through Tuesday. This was a weekly lowering of -3,828 contracts from the previous week which had a total of 6,518 net contracts.

This week’s current strength score (the trader positioning range over the past three years, measured from 0 to 100) shows the speculators are currently Bullish with a score of 57.2 percent. The commercials are Bearish with a score of 29.0 percent and the small traders (not shown in chart) are Bullish-Extreme with a score of 87.1 percent.

CANADIAN DOLLAR StatisticsSPECULATORSCOMMERCIALSSMALL TRADERS
– Percent of Open Interest Longs:28.642.927.5
– Percent of Open Interest Shorts:27.060.611.4
– Net Position:2,690-29,42126,731
– Gross Longs:47,50671,32945,729
– Gross Shorts:44,816100,75018,998
– Long to Short Ratio:1.1 to 10.7 to 12.4 to 1
NET POSITION TREND:
– COT Index Score (3 Year Range Pct):57.229.087.1
– COT Index Reading (3 Year Range):BullishBearishBullish-Extreme
NET POSITION MOVEMENT INDEX:
– 6-Week Change in Strength Index:-5.47.7-7.6


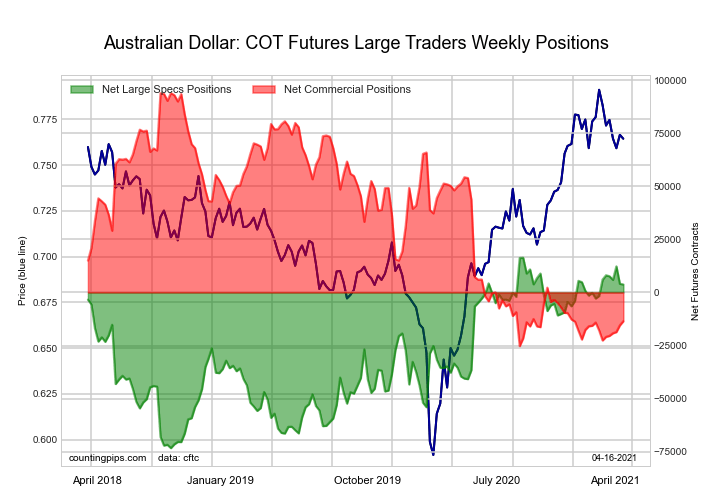
AUSTRALIAN DOLLAR Futures:


The AUSTRALIAN DOLLAR: large speculator standing this week equaled a net position of 4,066 contracts in the data reported through Tuesday. This was a weekly decrease of -8,197 contracts from the previous week which had a total of 12,263 net contracts.

This week’s current strength score (the trader positioning range over the past three years, measured from 0 to 100) shows the speculators are currently Bullish-Extreme with a score of 86.3 percent. The commercials are Bearish-Extreme with a score of 8.2 percent and the small traders (not shown in chart) are Bullish-Extreme with a score of 82.2 percent.

AUSTRALIAN DOLLAR StatisticsSPECULATORSCOMMERCIALSSMALL TRADERS
– Percent of Open Interest Longs:45.932.321.4
– Percent of Open Interest Shorts:42.943.613.1
– Net Position:4,066-15,49411,428
– Gross Longs:62,99144,30829,395
– Gross Shorts:58,92559,80217,967
– Long to Short Ratio:1.1 to 10.7 to 11.6 to 1
NET POSITION TREND:
– COT Index Score (3 Year Range Pct):86.38.282.2
– COT Index Reading (3 Year Range):Bullish-ExtremeBearish-ExtremeBullish-Extreme
NET POSITION MOVEMENT INDEX:
– 6-Week Change in Strength Index:6.42.0-17.8


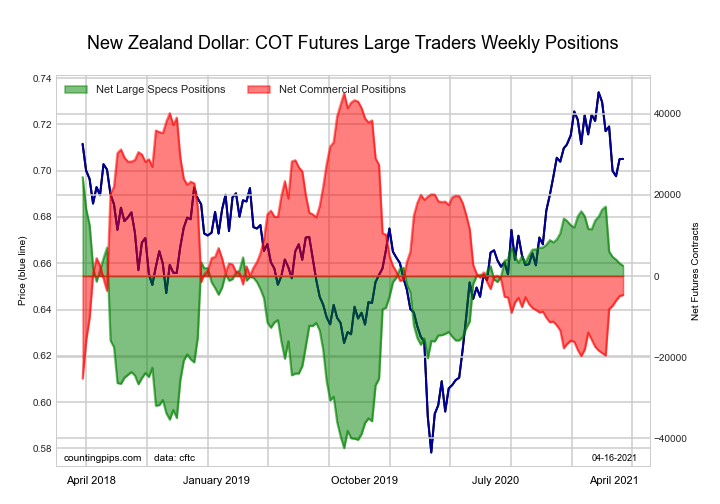
NEW ZEALAND DOLLAR Futures:


The NEW ZEALAND DOLLAR: large speculator standing this week equaled a net position of 3,138 contracts in the data reported through Tuesday. This was a weekly decline of -908 contracts from the previous week which had a total of 4,046 net contracts.

This week’s current strength score (the trader positioning range over the past three years, measured from 0 to 100) shows the speculators are currently Bullish with a score of 65.1 percent. The commercials are Bearish with a score of 32.3 percent and the small traders (not shown in chart) are Bullish with a score of 73.2 percent.

NEW ZEALAND DOLLAR StatisticsSPECULATORSCOMMERCIALSSMALL TRADERS
– Percent of Open Interest Longs:51.431.413.7
– Percent of Open Interest Shorts:43.044.68.9
– Net Position:3,138-4,9261,788
– Gross Longs:19,19911,7325,127
– Gross Shorts:16,06116,6583,339
– Long to Short Ratio:1.2 to 10.7 to 11.5 to 1
NET POSITION TREND:
– COT Index Score (3 Year Range Pct):65.132.373.2
– COT Index Reading (3 Year Range):BullishBearishBullish
NET POSITION MOVEMENT INDEX:
– 6-Week Change in Strength Index:-16.418.2-21.4


MEXICAN PESO Futures:


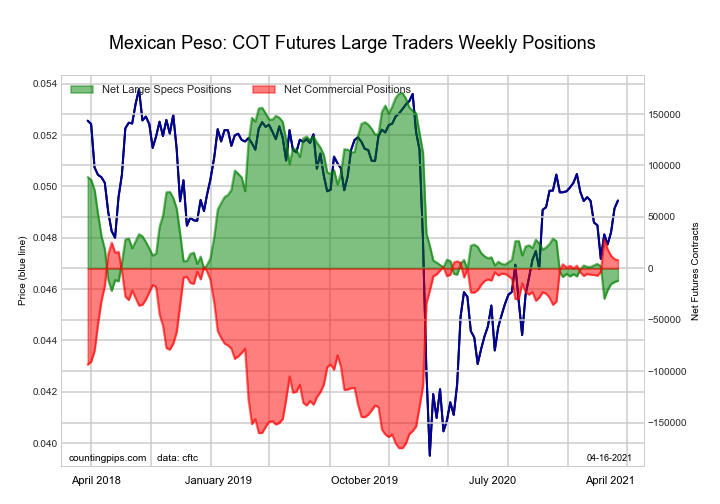
The MEXICAN PESO: large speculator standing this week equaled a net position of -13,142 contracts in the data reported through Tuesday. This was a weekly boost of 1,971 contracts from the previous week which had a total of -15,113 net contracts.

This week’s current strength score (the trader positioning range over the past three years, measured from 0 to 100) shows the speculators are currently Bearish-Extreme with a score of 8.2 percent. The commercials are Bullish-Extreme with a score of 90.6 percent and the small traders (not shown in chart) are Bullish with a score of 60.4 percent.

MEXICAN PESO StatisticsSPECULATORSCOMMERCIALSSMALL TRADERS
– Percent of Open Interest Longs:42.151.15.2
– Percent of Open Interest Shorts:51.744.52.2
– Net Position:-13,1429,0544,088
– Gross Longs:57,61069,9307,085
– Gross Shorts:70,75260,8762,997
– Long to Short Ratio:0.8 to 11.1 to 12.4 to 1
NET POSITION TREND:
– COT Index Score (3 Year Range Pct):8.290.660.4
– COT Index Reading (3 Year Range):Bearish-ExtremeBullish-ExtremeBullish
NET POSITION MOVEMENT INDEX:
– 6-Week Change in Strength Index:-8.17.63.7


BRAZIL REAL Futures:


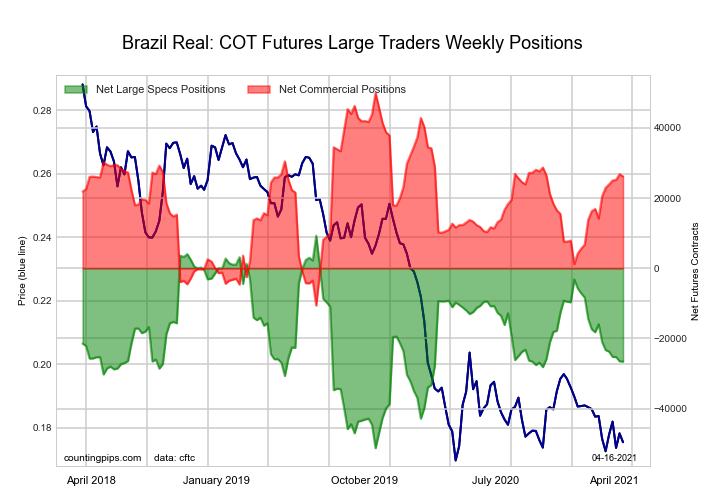
The BRAZIL REAL: large speculator standing this week equaled a net position of -26,506 contracts in the data reported through Tuesday. This was a weekly fall of -1,197 contracts from the previous week which had a total of -25,309 net contracts.

This week’s current strength score (the trader positioning range over the past three years, measured from 0 to 100) shows the speculators are currently Bearish with a score of 40.9 percent. The commercials are Bullish with a score of 61.8 percent and the small traders (not shown in chart) are Bullish with a score of 67.1 percent.

BRAZIL REAL StatisticsSPECULATORSCOMMERCIALSSMALL TRADERS
– Percent of Open Interest Longs:22.470.36.0
– Percent of Open Interest Shorts:81.111.06.7
– Net Position:-26,50626,820-314
– Gross Longs:10,10331,7662,716
– Gross Shorts:36,6094,9463,030
– Long to Short Ratio:0.3 to 16.4 to 10.9 to 1
NET POSITION TREND:
– COT Index Score (3 Year Range Pct):40.961.867.1
– COT Index Reading (3 Year Range):BearishBullishBullish
NET POSITION MOVEMENT INDEX:
– 6-Week Change in Strength Index:-17.520.9-26.7


RUSSIAN RUBLE Futures:


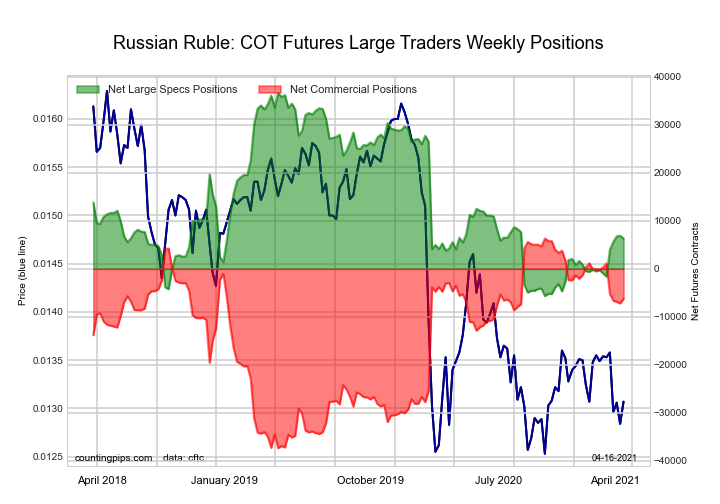
The RUSSIAN RUBLE: large speculator standing this week equaled a net position of 6,875 contracts in the data reported through Tuesday. This was a weekly boost of 91 contracts from the previous week which had a total of 6,784 net contracts.

This week’s current strength score (the trader positioning range over the past three years, measured from 0 to 100) shows the speculators are currently Bearish with a score of 29.7 percent. The commercials are Bullish with a score of 69.1 percent and the small traders (not shown in chart) are Bullish with a score of 53.0 percent.

RUSSIAN RUBLE StatisticsSPECULATORSCOMMERCIALSSMALL TRADERS
– Percent of Open Interest Longs:32.661.55.8
– Percent of Open Interest Shorts:9.385.94.7
– Net Position:6,875-7,185310
– Gross Longs:9,60018,1091,700
– Gross Shorts:2,72525,2941,390
– Long to Short Ratio:3.5 to 10.7 to 11.2 to 1
NET POSITION TREND:
– COT Index Score (3 Year Range Pct):29.769.153.0
– COT Index Reading (3 Year Range):BearishBullishBullish
NET POSITION MOVEMENT INDEX:
– 6-Week Change in Strength Index:16.9-16.0-5.4


BITCOIN FUTURES Futures:


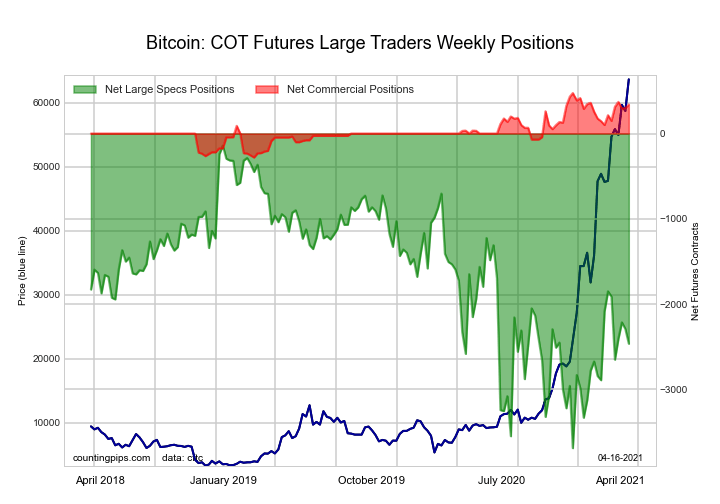
The BITCOIN FUTURES: large speculator standing this week equaled a net position of -2,292 contracts in the data reported through Tuesday. This was a weekly decline of -77 contracts from the previous week which had a total of -2,215 net contracts.

This week’s current strength score (the trader positioning range over the past three years, measured from 0 to 100) shows the speculators are currently Bearish with a score of 39.4 percent. The commercials are Bullish with a score of 76.9 percent and the small traders (not shown in chart) are Bullish with a score of 55.3 percent.

BITCOIN StatisticsSPECULATORSCOMMERCIALSSMALL TRADERS
– Percent of Open Interest Longs:60.25.127.8
– Percent of Open Interest Shorts:83.42.17.6
– Net Position:-2,2923001,992
– Gross Longs:5,9385042,742
– Gross Shorts:8,230204750
– Long to Short Ratio:0.7 to 12.5 to 13.7 to 1
NET POSITION TREND:
– COT Index Score (3 Year Range Pct):39.476.955.3
– COT Index Reading (3 Year Range):BearishBullishBullish
NET POSITION MOVEMENT INDEX:
– 6-Week Change in Strength Index:-5.826.30.3


Article By CountingPips.comReceive our weekly COT Reports by Email

*COT Report: The COT data, released weekly to the public each Friday, is updated through the most recent Tuesday (data is 3 days old) and shows a quick view of how large speculators or non-commercials (for-profit traders) were positioned in the futures markets.

The CFTC categorizes trader positions according to commercial hedgers (traders who use futures contracts for hedging as part of the business), non-commercials (large traders who speculate to realize trading profits) and nonreportable traders (usually small traders/speculators).

Find CFTC criteria here: (http://www.cftc.gov/MarketReports/CommitmentsofTraders/ExplanatoryNotes/index.htm).

Fibonacci Retracement Analysis 09.04.2021 (AUDUSD, USDCAD)

Article By RoboForex.com

AUDUSD, “Australian Dollar vs US Dollar”

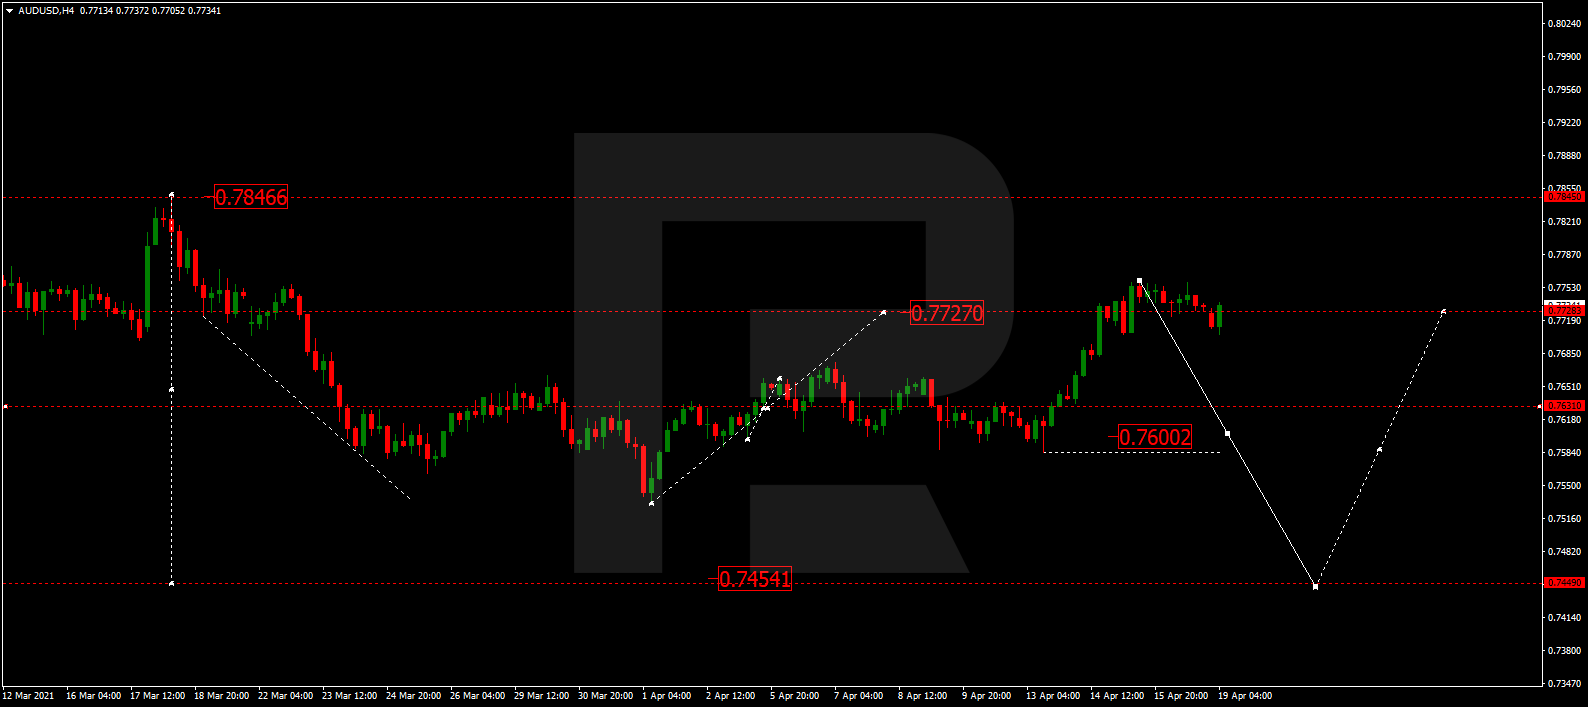
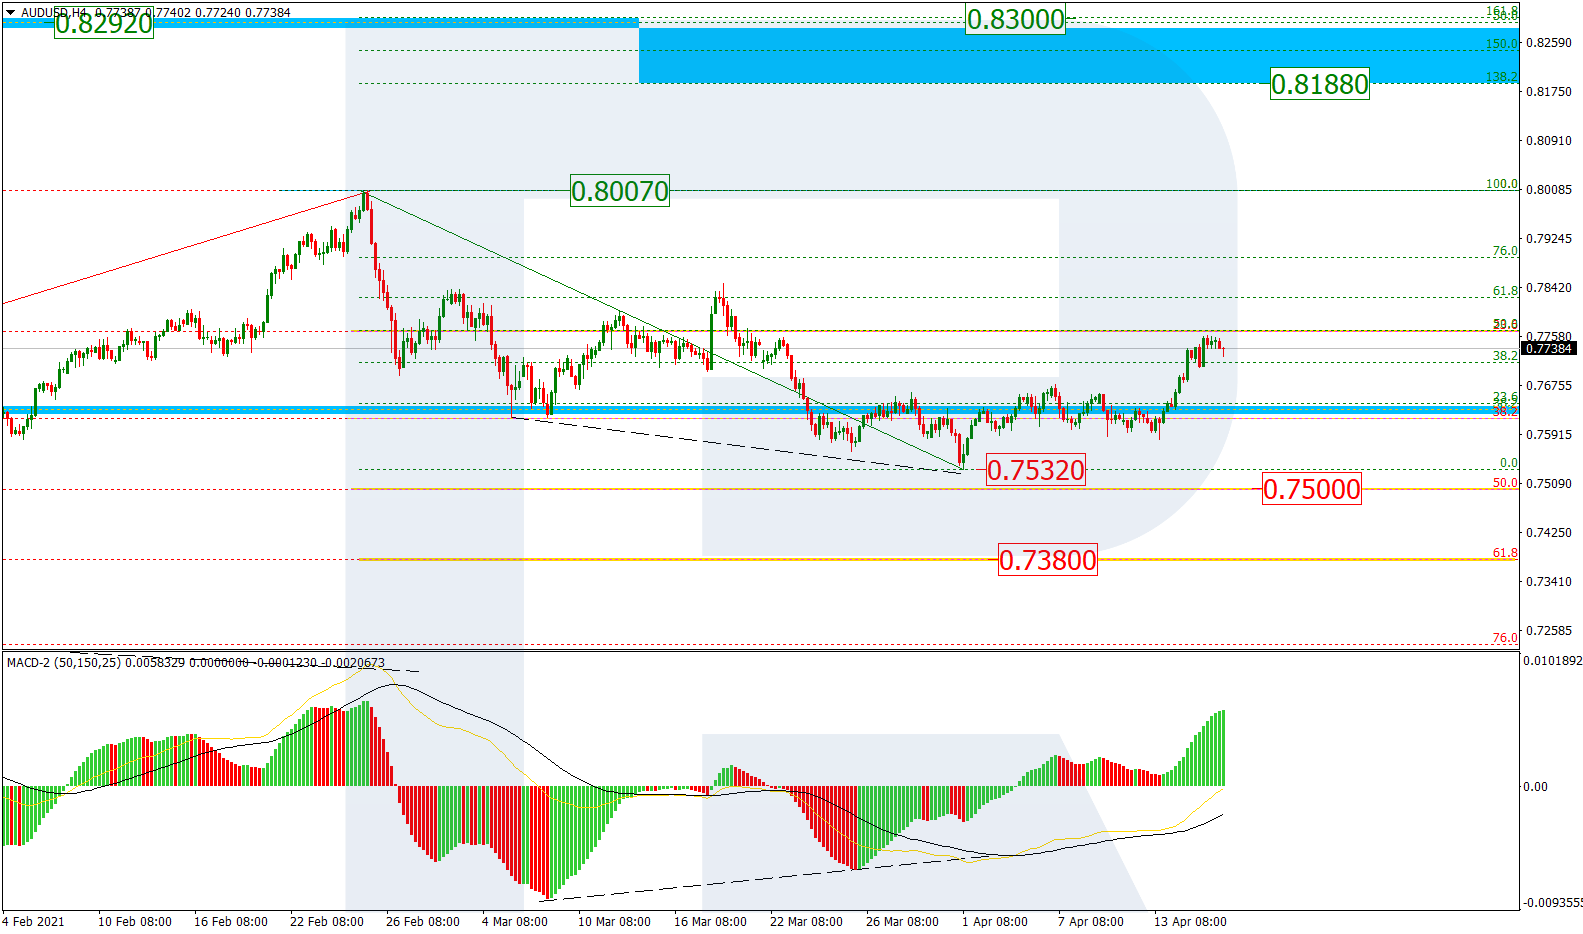
On H4, the wave of correctional growth after the convergence did not demonstrate any impressive move. Further growth is not excluded, but the priority is further development of the downtrend to 50.0% (0.7500) and 61.8% (0.7380) Fibo. The resistance is still at the high of 0.8007.

AUDUSD_H4
Risk Warning: the result of previous trading operations do not guarantee the same results in the future

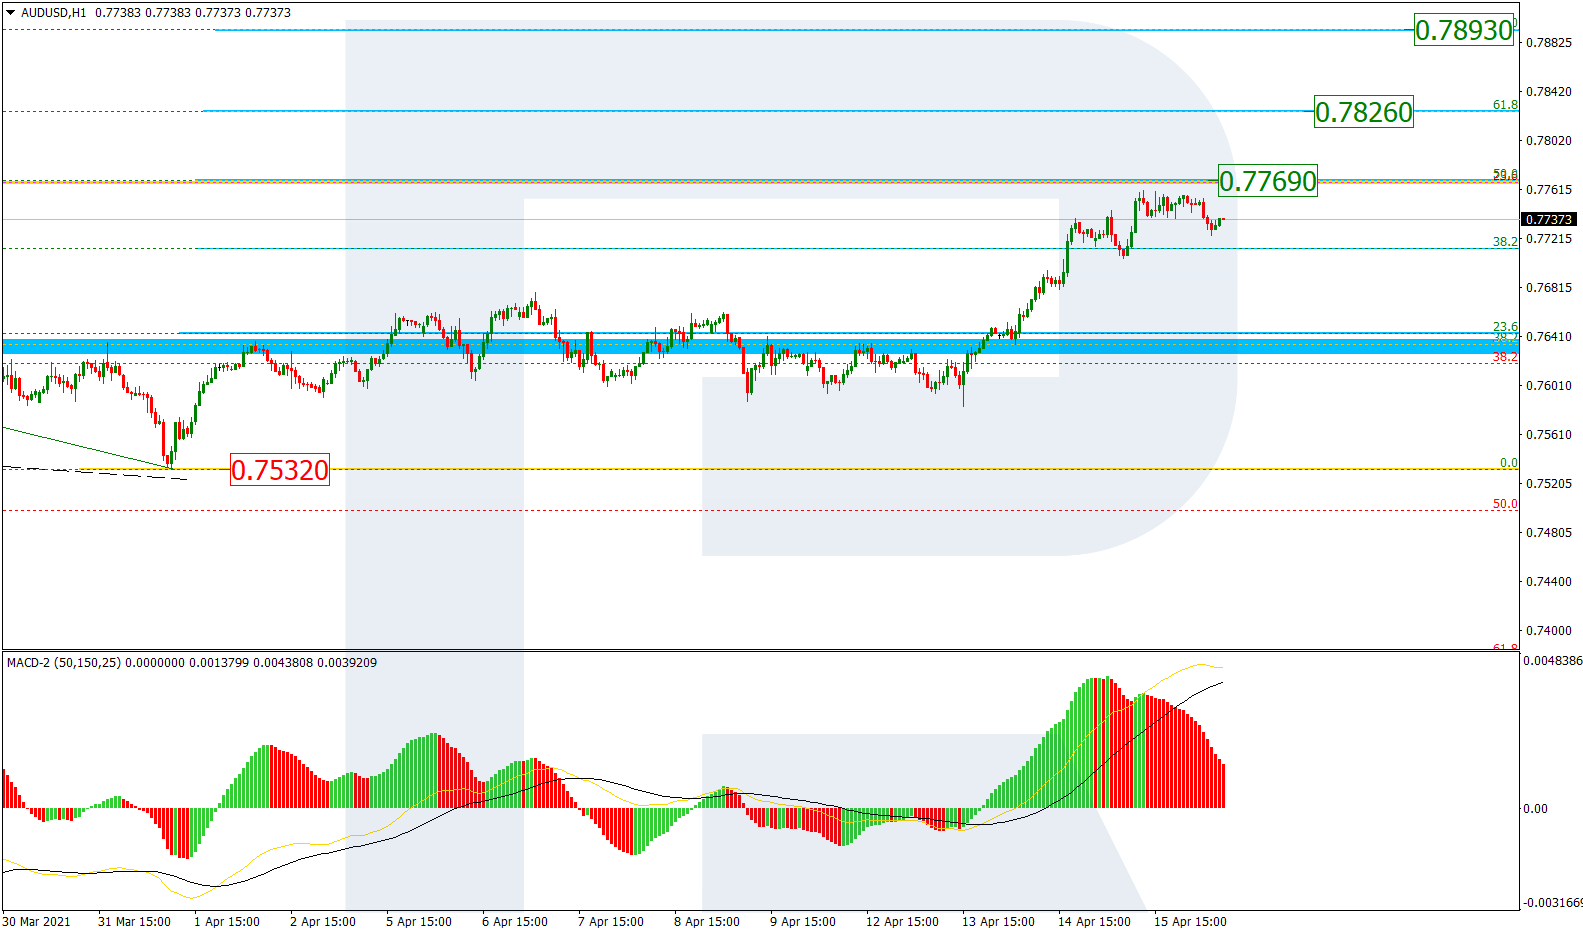
On H1, the correctional growth reached just 23.6% Fibo. After a local divergence, the decline will head for 0.7532, and a breakaway here will signal further development of the medium-term downtrend. However, in case of a bounce, the wave of growth will head for 38.2% (0.7713) and 50.0% (0.7769).

AUDUSD_H1
Risk Warning: the result of previous trading operations do not guarantee the same results in the future

USDCAD, “US Dollar vs Canadian Dollar’

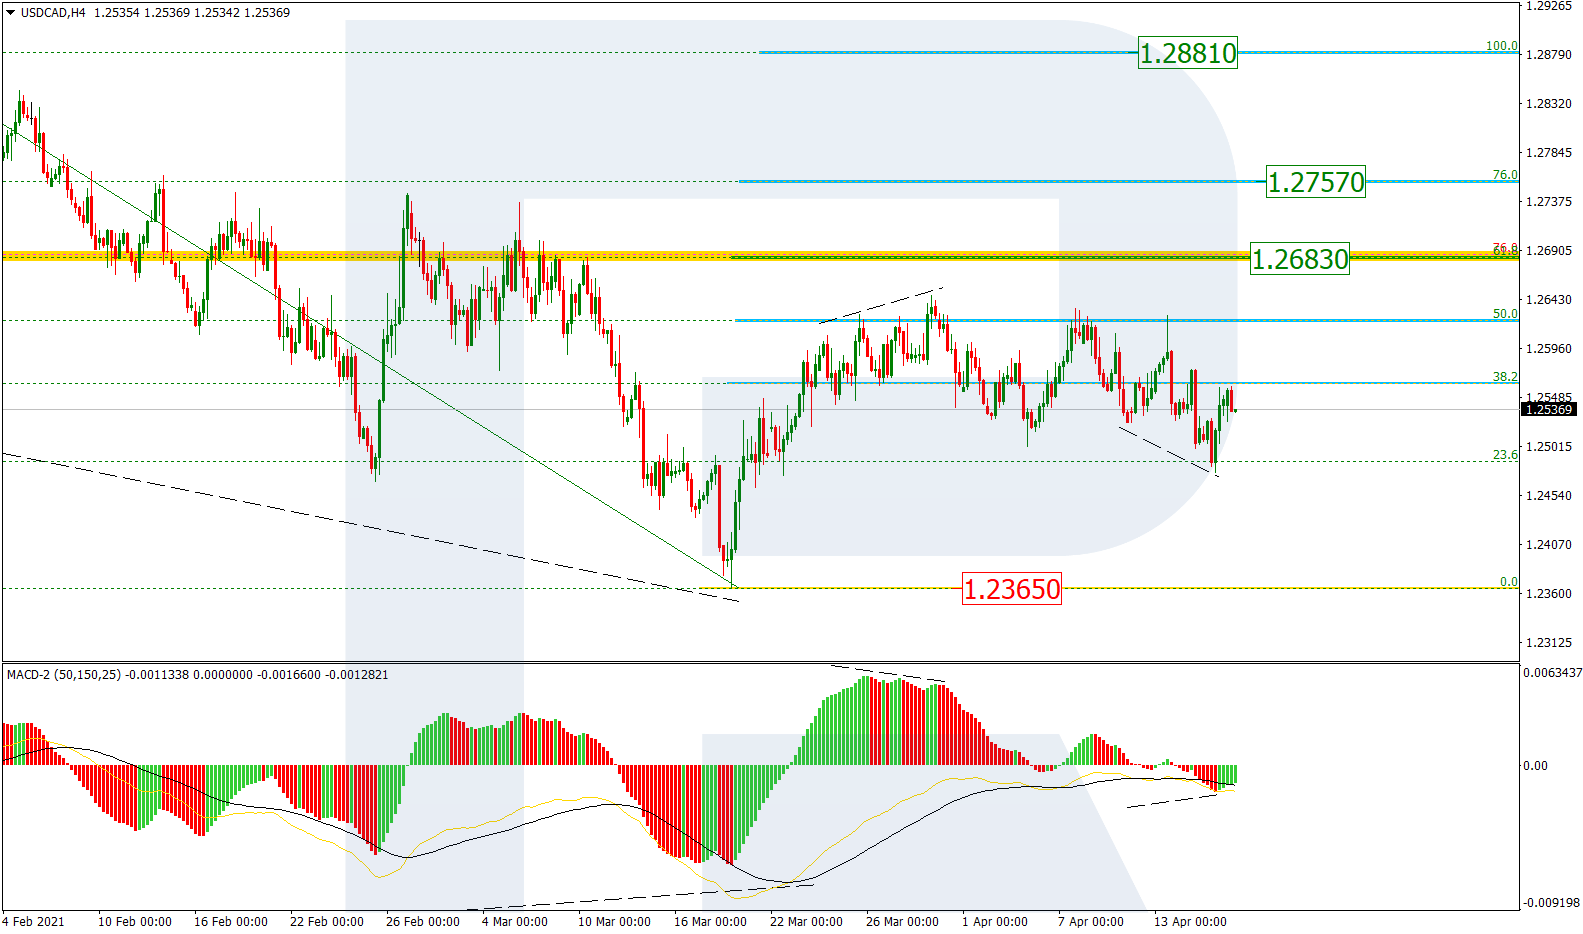
On H4, the market remains in the correctional phase after a wave of growth to 50.0% Fibo. The fact that the declining wave has not dropped to the low and support at 1.2365 might mean that buyers are strong. When the correctional phase is over, growth might continue to 61.8% (1.2683) and 76.0% (1.2757), but the main goal is the local high of 1.2881.

USDCAD_H4
Risk Warning: the result of previous trading operations do not guarantee the same results in the future

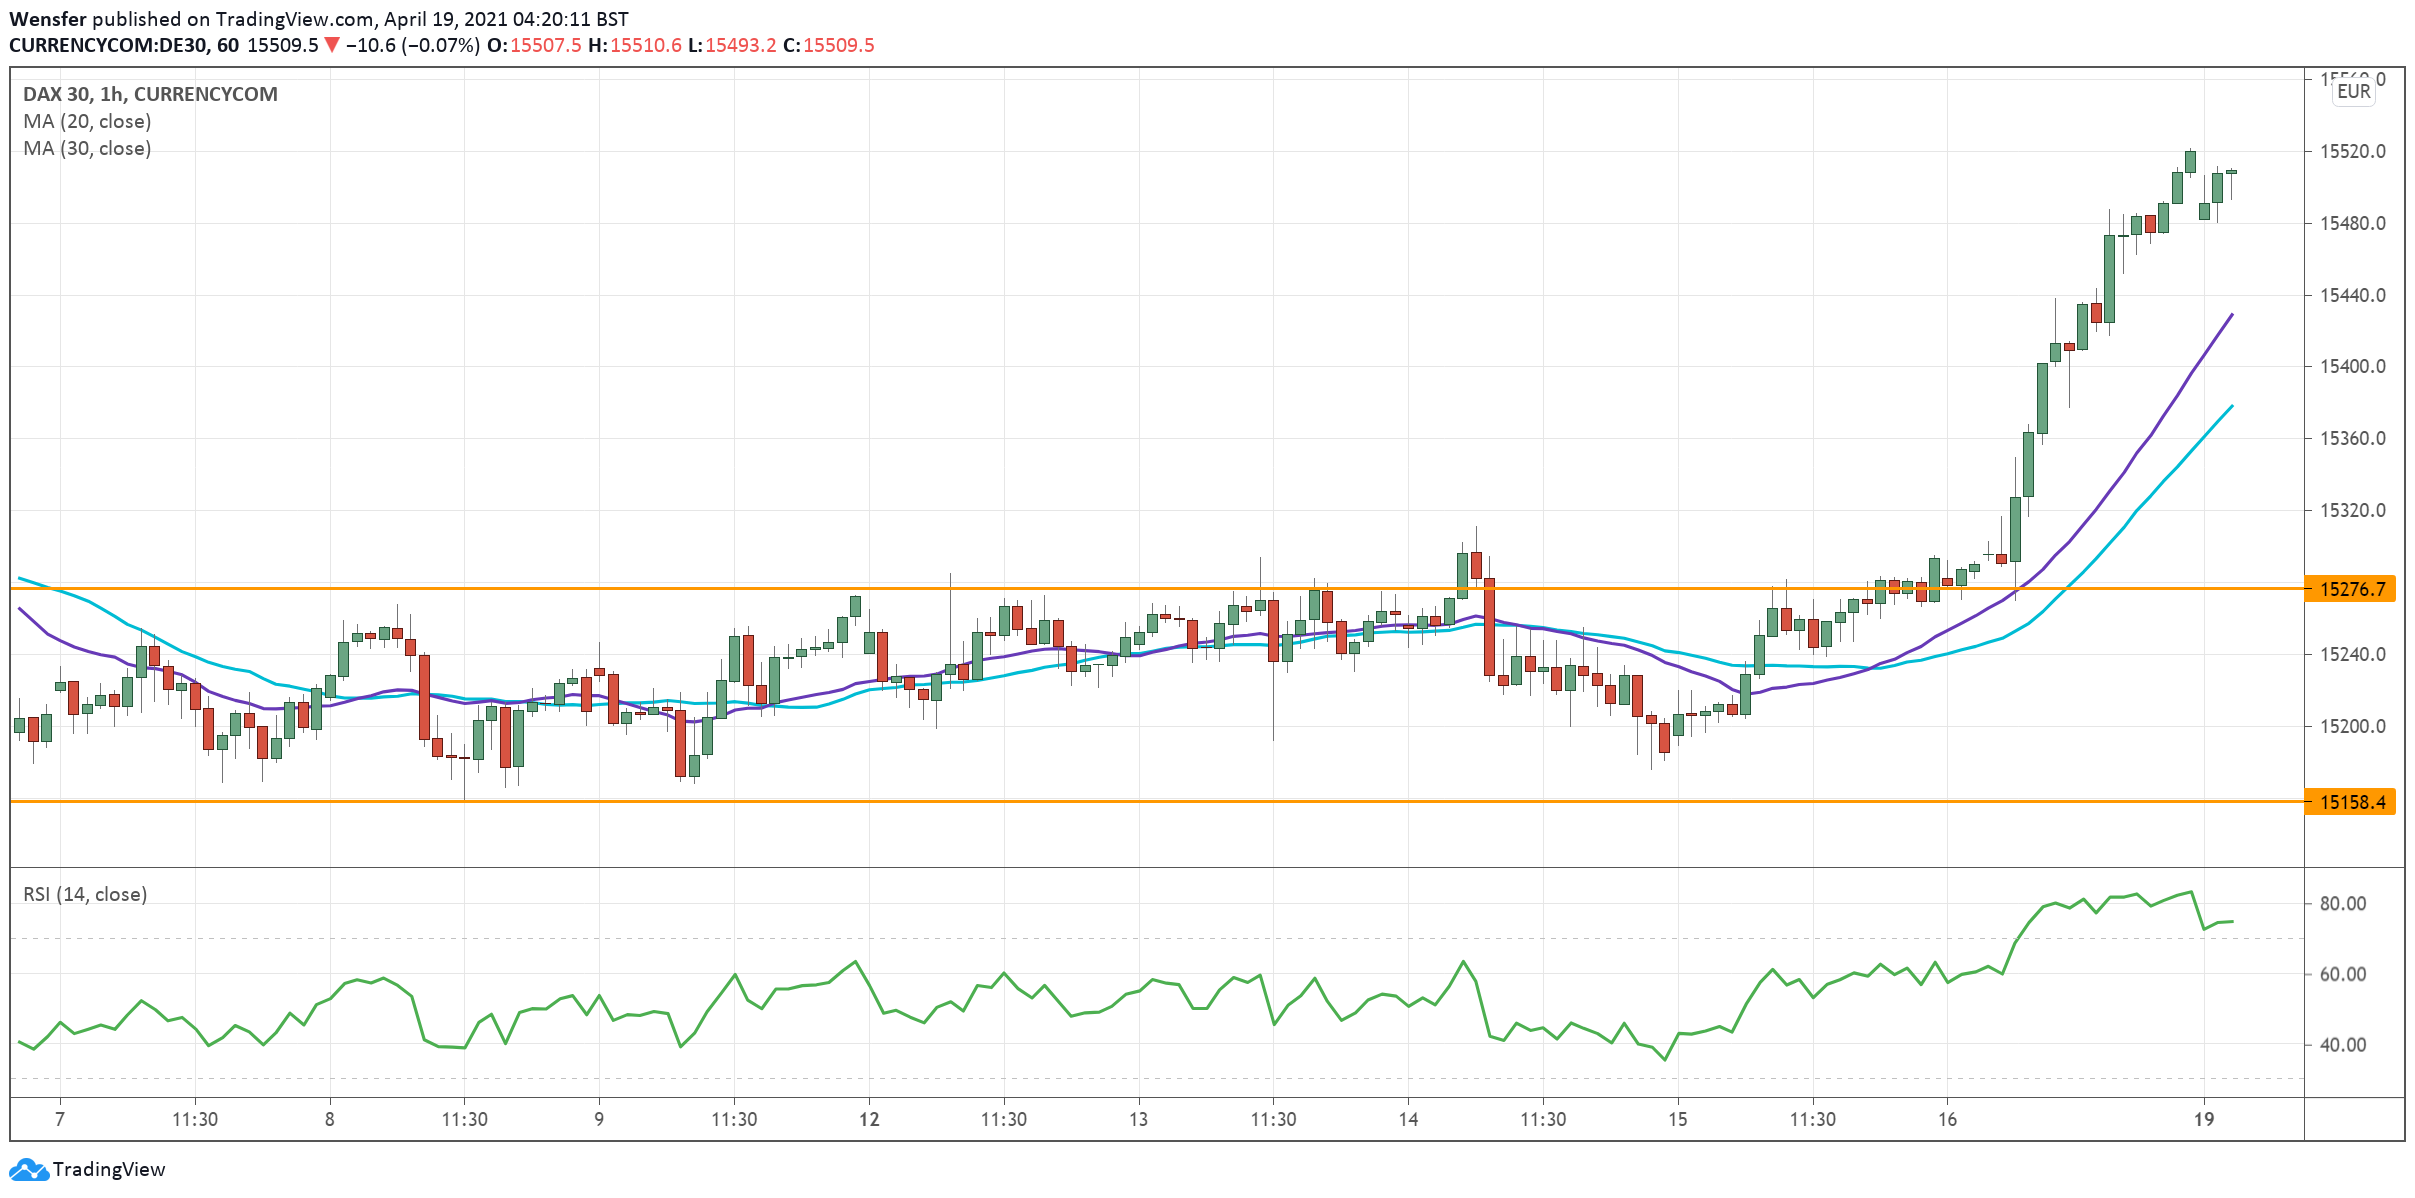
On H1, one can see the inner construction of the correctional phase. The declining wave has reached 50.0% and finished in a convergence. Subsequent growth did not break through 1.2647, which might mean a possible decline to 61.8% (1.2473). However, if the high is broken away, an impulse of rapid growth might form.

USDCAD_H1

Article By RoboForex.com

Attention!
Forecasts presented in this section only reflect the author’s private opinion and should not be considered as guidance for trading. RoboForex LP bears no responsibility for trading results based on trading recommendations described in these analytical reviews.

Murrey Math Lines 09.04.2021 (BRENT, S&P 500)

Article By RoboForex.com

BRENT

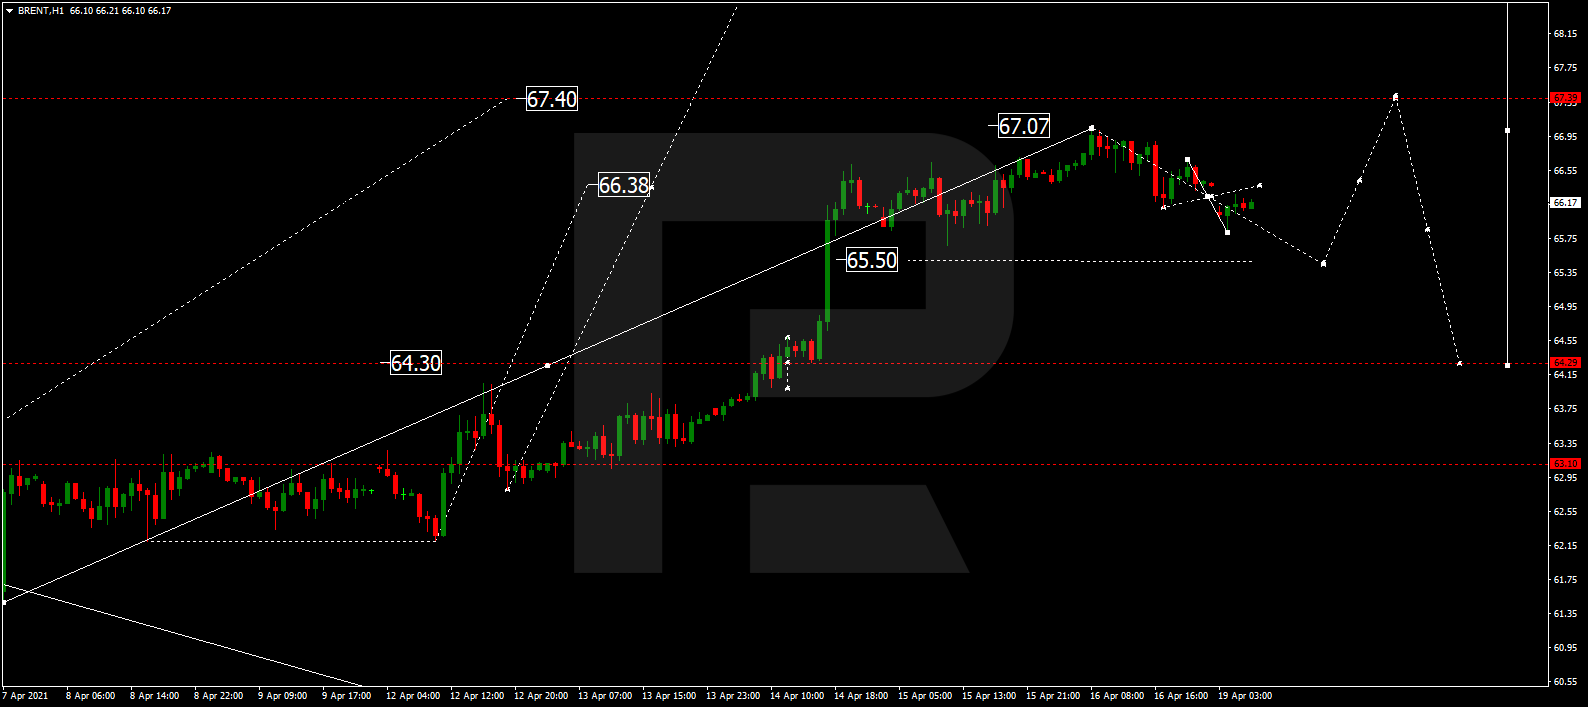
On H4, Brent quotations overcome 0/8 and escaped the oversold area. Currently, we expect growth to the resistance level of 2/8. The scenario can be canceled by a breakaway of the support at 0/8 downwards. In this case, the price might drop deeper down to -1/8.

BRENT_H4
Risk Warning: the result of previous trading operations do not guarantee the same results in the future

On M15, a breakaway of the upper border of VoltyChannel will increase the probability of further price growth.

BRENT_M15
Risk Warning: the result of previous trading operations do not guarantee the same results in the future

S&P 500

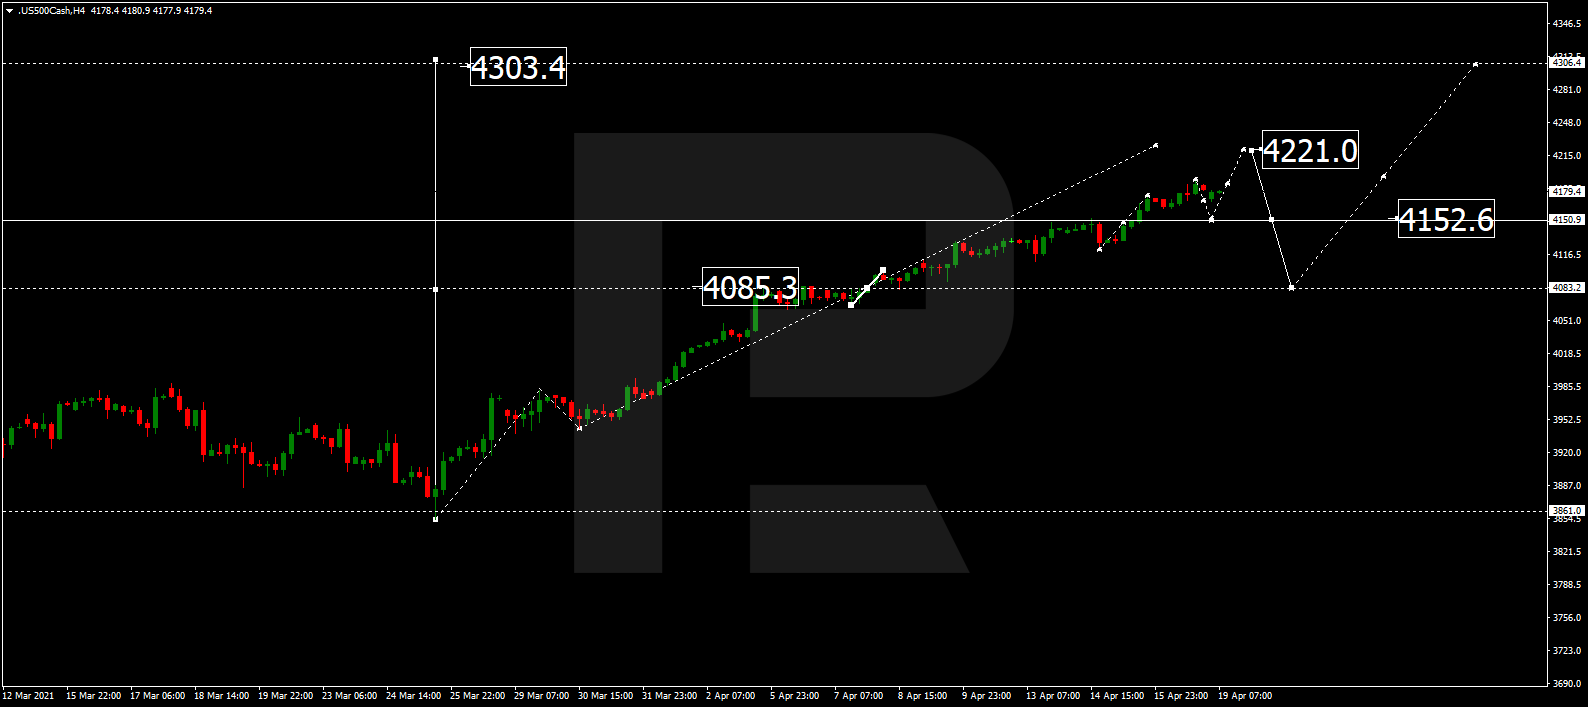
On H4, the quotations are trading in the overbought area. Currently, a breakaway of +1/8 can provoke a correctional decline to the nearest support at 8/8. The scenario might be canceled by a breakaway of +2/8 upwards, which will reshuffle the Murrey lines and set new goals of price moves.

S&P 500_H4
Risk Warning: the result of previous trading operations do not guarantee the same results in the future

On M15, the lower border of VoltyChannel is too far away from the current price, which means the falling will only be signaled by a breakaway of +1/8 on H4.

S&P 500_M15

Article By RoboForex.com

Attention!
Forecasts presented in this section only reflect the author’s private opinion and should not be considered as guidance for trading. RoboForex LP bears no responsibility for trading results based on trading recommendations described in these analytical reviews.

The Analytical Overview of the Main Currency Pairs on 2021.04.09

by JustForex

The EUR/USD currency pair

Technical indicators of the currency pair:
  • Prev Open: 1.1866
  • Prev Close: 1.1912
  • % chg. over the last day: +0.39%

The euro rose against the US dollar on the back of negative data on the labor market. Following the data release, the Treasury yield fell to 1.62%, which supported the bulls in the pair. In addition, the dovish comments of Jerome Powell and Fed’s board member James Bullard put additional pressure on the dollar.

Trading recommendations
  • Support levels: 1.1836, 1.1704
  • Resistance levels: 1.1915, 1.1990

The main scenario for EUR/USD is cautious buying. The technical picture looks bullish. The MACD is above zero, but divergence has formed, which indicates an approaching correction. The ADX showed a low reaction to the northern impulse, indicating a decrease in bullish pressure.

Alternative scenario: if the price consolidates below the level of 1.1836, the pair may return to the decline to 1.1704. A breakout of 1.1915 would indicate continued growth.

EUR/USD
News feed for 2021.04.09:
  • – The US Producer Price Index (PPI) (m/m) (Mar) at 15:30 (GMT+3).

The GBP/USD currency pair

Technical indicators of the currency pair:
  • Prev Open: 1.3734
  • Prev Close: 1.3729
  • % chg. over the last day: -0.04%

The sterling declined on Thursday, despite the fall in the dollar index. It indicates the British currency’s weakness, which may show a steep peak in the event of a correction in the US dollar. The pressure is still coming from the AstraZeneca vaccine situation, which could undermine the UK’s vaccination program.

Trading recommendations
  • Support levels: 1.3705, 1.3680
  • Resistance levels: 1.3848, 1.3929

The main scenario for GBP/USD is selling. The pair has come close to the first support level. As long as the price is below the moving averages, the risk of a breakdown is high. But ADX shows a decrease in the potential of the southern trend, and divergence has formed on the MACD. It indicates a possible temporary stop in the southern movement.

Alternative scenario: if the pair consolidates above 1.3800, the pound may move upward to 1.3848.

GBP/USD
There is no news feed for today.

The USD/JPY currency pair

Technical indicators of the currency pair:
  • Prev Open: 109.83
  • Prev Close: 109.27
  • % chg. over the last day: -0.51%

On Thursday, the dollar-yen pair continued to decline following the dollar index and the American treasuries, the yield of which fell to 1.62%. The market is witnessing an increase in demand for defensive assets, including gold, Swiss franc, and yen, which puts additional pressure on the pair.

Trading recommendations
  • Support levels: 108.35, 107.08
  • Resistance levels: 110.32, 110.98

The main scenario is selling. The price is still fixed below the moving averages. The MACD is below zero. And convergence has formed on the chart, which indicates a possible acceleration of the fall. At the same time, the ADX shows a decrease in trend potential. By a combination of factors, a moderate southern signal is observed.

An alternative scenario implies the price fixing above 109.90. In this case, the pair may resume growth to 110.32.

USD/JPY
News feed for 2021.04.09:
  • – The US Producer Price Index (PPI) (m/m) (Mar) at 15:30 (GMT+3).

The USD/CAD currency pair

Technical indicators of the currency pair:
  • Prev Open: 1.2605
  • Prev Close: 1.2559
  • % chg. over the last day: -0.36%

The pair continues to trade in a narrow sideways range, as oil quotes have stabilized around $59 per barrel. The slight decrease was due to the continuing decline in the dollar index.

Trading recommendations
  • Support levels: 1.2554, 1.2501
  • Resistance levels: 1.2629, 1.2646

The main scenario is trading in a sideways range between 1.2554 and 1.2629. Specifications are mixed. The price is stuck between moving averages. The MACD is near zero. The ADX shows a strong reaction to the decline in quotations, which indicates a probable risk of a breakdown of the first support level.

Alternative scenario: if the price consolidates below 1.2554, the pair may resume its decline to 1.2501. A breakout of 1.2629 would indicate growth to 1.2646 or higher.

USD/CAD
News feed for 2021.04.09:
  • – Canada Employment Change (Mar) at 15:30 (GMT+3).

by JustForex


This article reflects a personal opinion and should not be interpreted as an investment advice, and/or offer, and/or a persistent request for carrying out financial transactions, and/or a guarantee, and/or a forecast of future events.

Stock prices continue to rise, and the dollar is falling amid comments from Fed Chairman Jerome Powell

by JustForex

Stocks prices continued to increase after Federal Reserve Chairman Jerome Powell said that the central bank has the tools to contain any inflationary pressure that is expected to be short-term as the economy recovers.

The S&P 500 set a new record despite a decline in trading volumes that fell below 10 billion shares on US exchanges, which is a new minimum this year. The Nasdaq 100 topped the major indices as giants such as Apple Inc. and Tesla Inc. were the fastest in growth. Treasury yield decreased and the dollar fell. The Treasuries hit a new minimum this month, dropping to 1.62%.

A day after the Fed minutes highlighted a unanimous commitment to the soft monetary policy, Powell said that the central bank will respond if inflation expectations begin to “grow steadily and substantially above levels set by the monetary regulator.” He also noted that vaccine problems around the world pose a risk to progress in an economic recovery that remains “uneven and incomplete.”

Meanwhile, St. Louis Federal Bank President James Bullard said that it was too early for central banks to discuss the cuts of asset purchases during the pandemic. On Thursday, the US labor market data showed that jobless claims rose unexpectedly, underscoring the volatile nature of the labor market recovery.

Main market quotes:

S&P 500 (F) 4,090.38 +1.38 (+0.03%)

Dow Jones 33,503.57 +57.31 (+0.17%)

DAX 15,202.68 +26.32 (+0.17%)

FTSE 100 6,942.22 +56.90 (+0.83%)

USD Index 92.308 +0.239 (+0.26%)

Important events:
  • – US PPI (m/m) (Mar) at 15:30 (GMT+3);
  • – Canada Employment Change (Mar) at 15:30 (GMT+3).

by JustForex


This article reflects a personal opinion and should not be interpreted as an investment advice, and/or offer, and/or a persistent request for carrying out financial transactions, and/or a guarantee, and/or a forecast of future events.

Japanese Candlesticks Analysis 08.04.2021 (GOLD, NZDUSD, GBPUSD)

Article By RoboForex.com

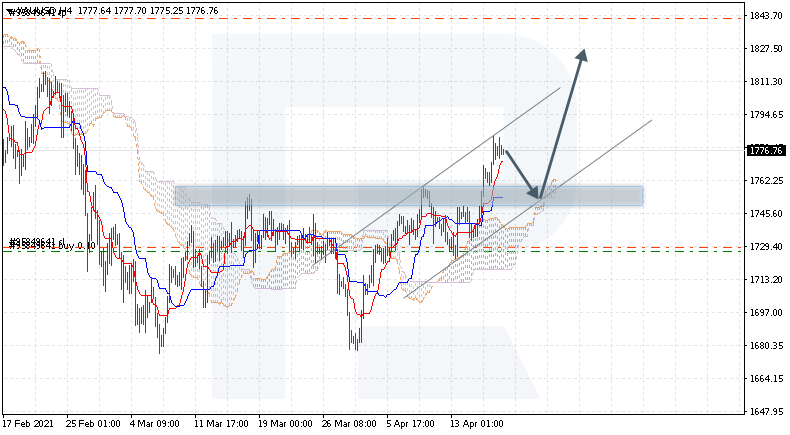
XAUUSD, “Gold vs US Dollar”

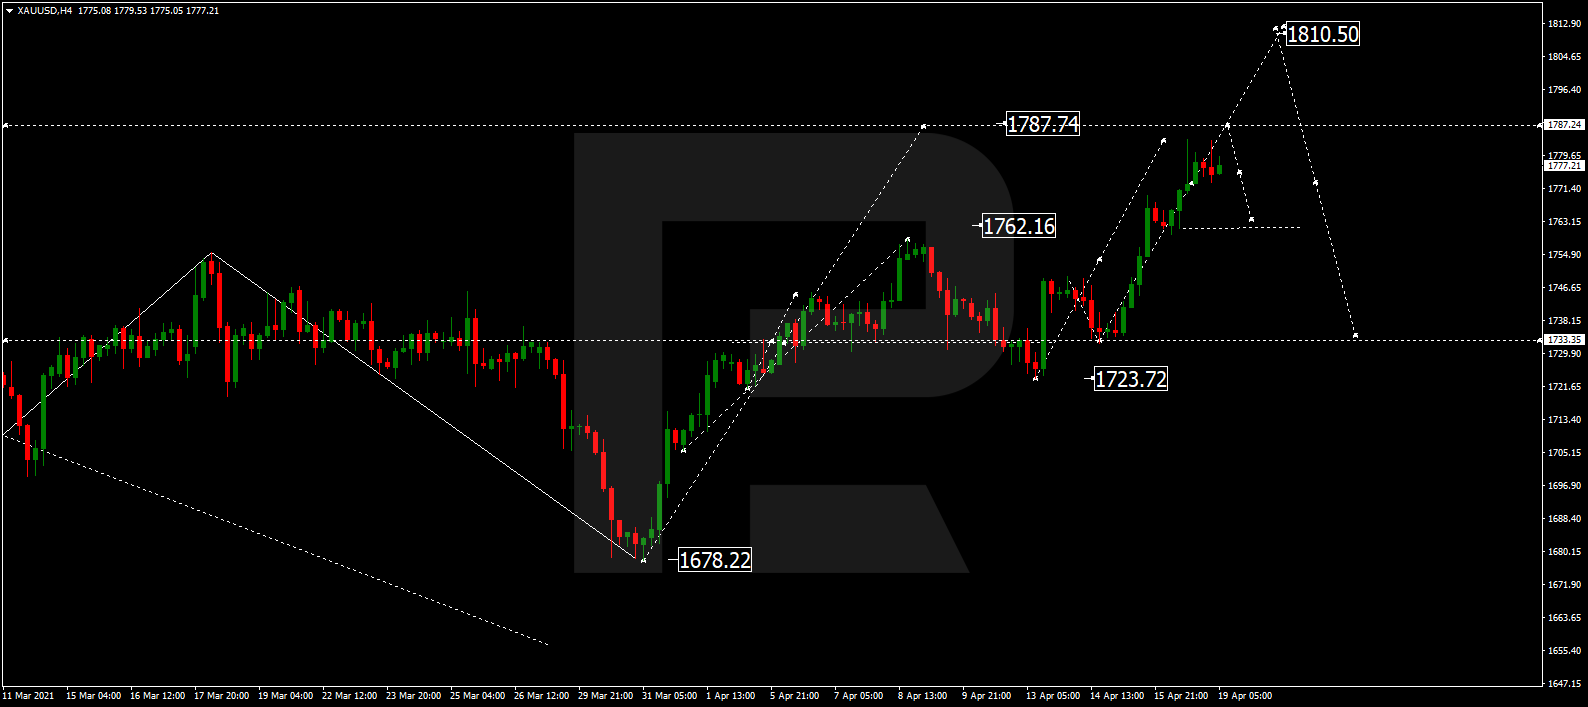
The pair keeps developing ascending dynamics. It has formed several reversal patterns at the resistance area, including a Harami. Currently, going by the patterns, gold my slump into a correction with the aim at 1725.00. However, the quotations might still proceed to 1755.00 skipping the reversal patterns.

XAUUSD
Risk Warning: the result of previous trading operations do not guarantee the same results in the future

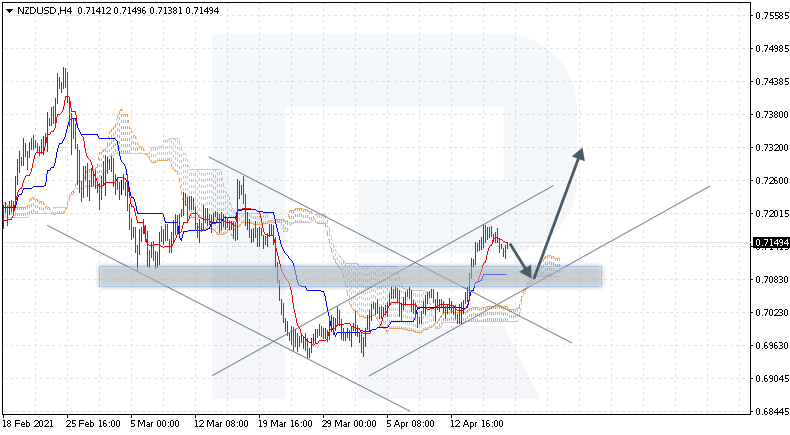
NZDUSD, “New Zealand Dollar vs US Dollar”

On H4, the pair keeps correcting. It has formed several reversal pattetns ar the resistance area, including an Engulfing pattern. The aim of the decline is 0.6950. Upon testing the support level, the pair can break through it and keep on with the descending dynamics. However, the quotations might still grow to 0.7070 before continuing the descending dynamics.

NZDUSD
Risk Warning: the result of previous trading operations do not guarantee the same results in the future

GBPUSD, “Great Britain Pound vs US Dollar”

On H4, the pair us gorming another correction inside a downtrend. At the support level, the pair has formed several reversal patterns, including a Hammer. Going by the patterns, the pair can currently continue the pullback with the aim at 1.3795. Then, bouncing off the resistance area, the quotations might go on declining. However, they might still go to 1.3690 without testing the resistance area.

GBPUSD

Article By RoboForex.com

Attention!
Forecasts presented in this section only reflect the author’s private opinion and should not be considered as guidance for trading. RoboForex LP bears no responsibility for trading results based on trading recommendations described in these analytical reviews.

Murrey Math Lines 08.04.2021 (USDCHF, XAUUSD)

Article By RoboForex.com

USDCHF, “US Dollar vs Swiss Franc”

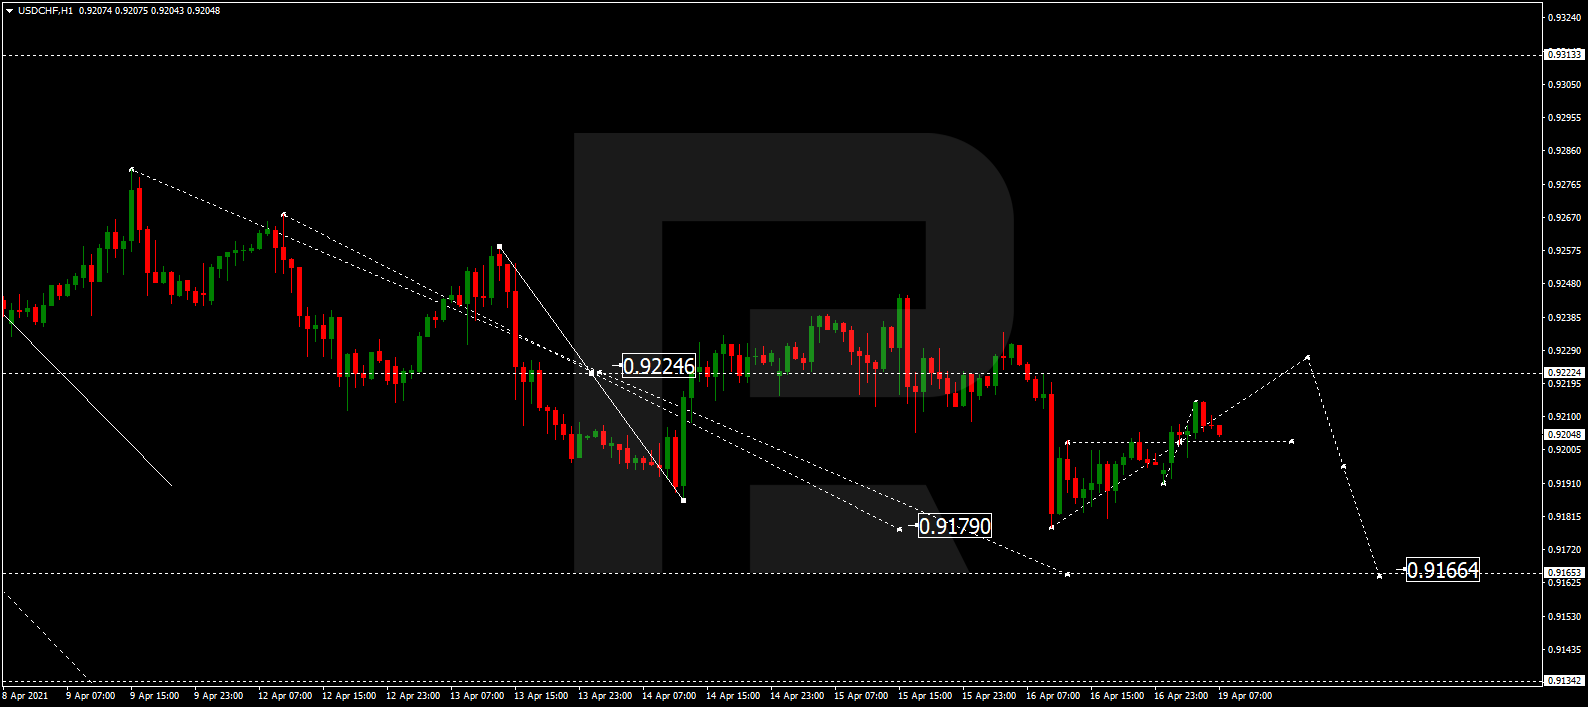
On H4, the quotations are trading above the 200-days Moving Average which indicates an uptrend. We expect them to grow to the nearest resistance level of 5/8. The scenario might be canceled by a breakaway of 4/8 downwards. In this case, the trend will reverse, and the quotations will reach the support at 3/8.

USDCHF_H4
Risk Warning: the result of previous trading operations do not guarantee the same results in the future

On M15, a breakaway of the upper border of VoltyChannel will be yet another signal for the growth of the price.

USDCHF_M15
Risk Warning: the result of previous trading operations do not guarantee the same results in the future

XAUUSD, “Gold vs US Dollar”

On H4, the quotations are trading in a consolidation range between 3/8 and 5/8. We expect them to get over 4/8 and grow further to the resistance at 5/8. The scenario can be canceled by a breakaway of 3/8 downwards, which might provoke the price to drop further to the support at 2/8.

XAUUSD_H4
Risk Warning: the result of previous trading operations do not guarantee the same results in the future

On M15, a breakaway of the upper border of VoltyChannel will make the growth of the price more probable.

XAUUSD_M15

Article By RoboForex.com

Attention!
Forecasts presented in this section only reflect the author’s private opinion and should not be considered as guidance for trading. RoboForex LP bears no responsibility for trading results based on trading recommendations described in these analytical reviews.

The S&P 500 has updated its records after the publication of the minutes of the Fed meeting. The dollar has stabilized

by JustForex

In the American session on Wednesday, traders were mainly focused on the protocols of the Federal Reserve System, which didn’t imply a rapid change in stimulus measures. According to the published document, the board members unanimously concluded that inflationary risks are short-term. It will take “some time” before significant progress is made towards the goals of maximum employment and price stability. Stock futures reacted positively to the protocol, with the benchmark S&P 500 renewed its year high by rising above 4073.

The dollar halted its fall against most currencies amid renewed unrest concerning the vaccination program in Europe. According to some investors, the bullish euphoria in sterling may end soon. The market was extremely optimistic at the start of the vaccination program. But, since all the positive points have already been taken into account, and new reports of blood clots still continue to call the safety of AstraZeneca into question, the interest in the British currency has decreased. Over the past two days, the pound has lost about 200 points against the dollar.

Treasuries have stabilized. Treasury yield is near 1.66%, but US 2-year bonds continue to fall, putting pressure on the dollar. Following the publication of the Fed’s minutes, the yield fell to 0.147%, reflecting a rate cut on faster monetary policy tightening.

Japanese stocks tumbled amid fears of stricter measures to contain the rise in infected people in Japan. European stock futures followed the growth of the S&P 500. Tech giants including Apple Inc. dominated in Nasdaq 100, which also closed the day in the green zone.

Main market quotes:

S&P 500 (F) 4,085.88 +15.88 (+0.39%)

Dow Jones 33,446.26 +16.02 (+0.05%)

DAX 15,234.15 +57.79 (+0.38%)

FTSE 100 6,911.75 +26.43 (+0.38%)

USD Index 92.323 -0.149 (-0.16%)

Important events:
  • – US Initial Jobless Claims at 15:30 (GMT+3);
  • – Speech by Chairman Jerome H. Powell at 19:00 (GMT+3).

by JustForex


This article reflects a personal opinion and should not be interpreted as an investment advice, and/or offer, and/or a persistent request for carrying out financial transactions, and/or a guarantee, and/or a forecast of future events.