
Article By RoboForex.com
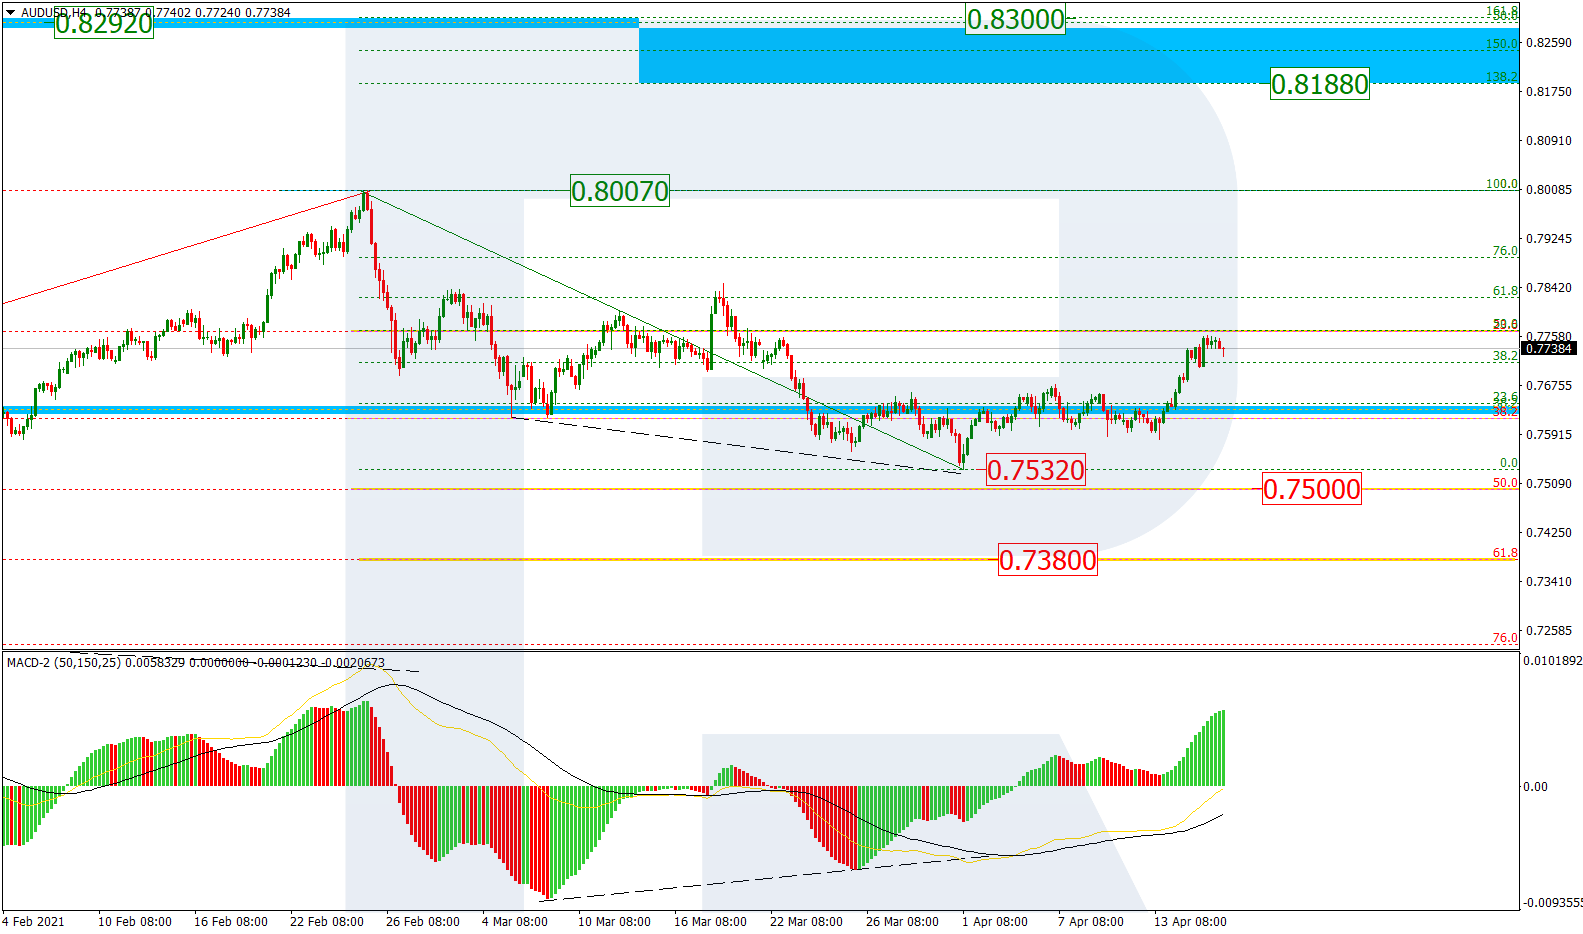
AUDUSD, “Australian Dollar vs US Dollar”
As we can see in the H4 chart, after failing to fall and reach the low, AUDUSD is forming a new correctional impulse to the upside that may transform into a proper rising wave towards the high at 0.8007, a breakout of which may lead to a further uptrend to reach the long-term 50.0% fibo at 0.8292 and the post-correctional extension area between 138.2% and 161.8% fibo at 0.8188 and 0.8300 respectively. Otherwise, the instrument may reverse and continue its decline towards 50.0% and 61.8% fibo at 0.7500 and 0.7380 respectively.

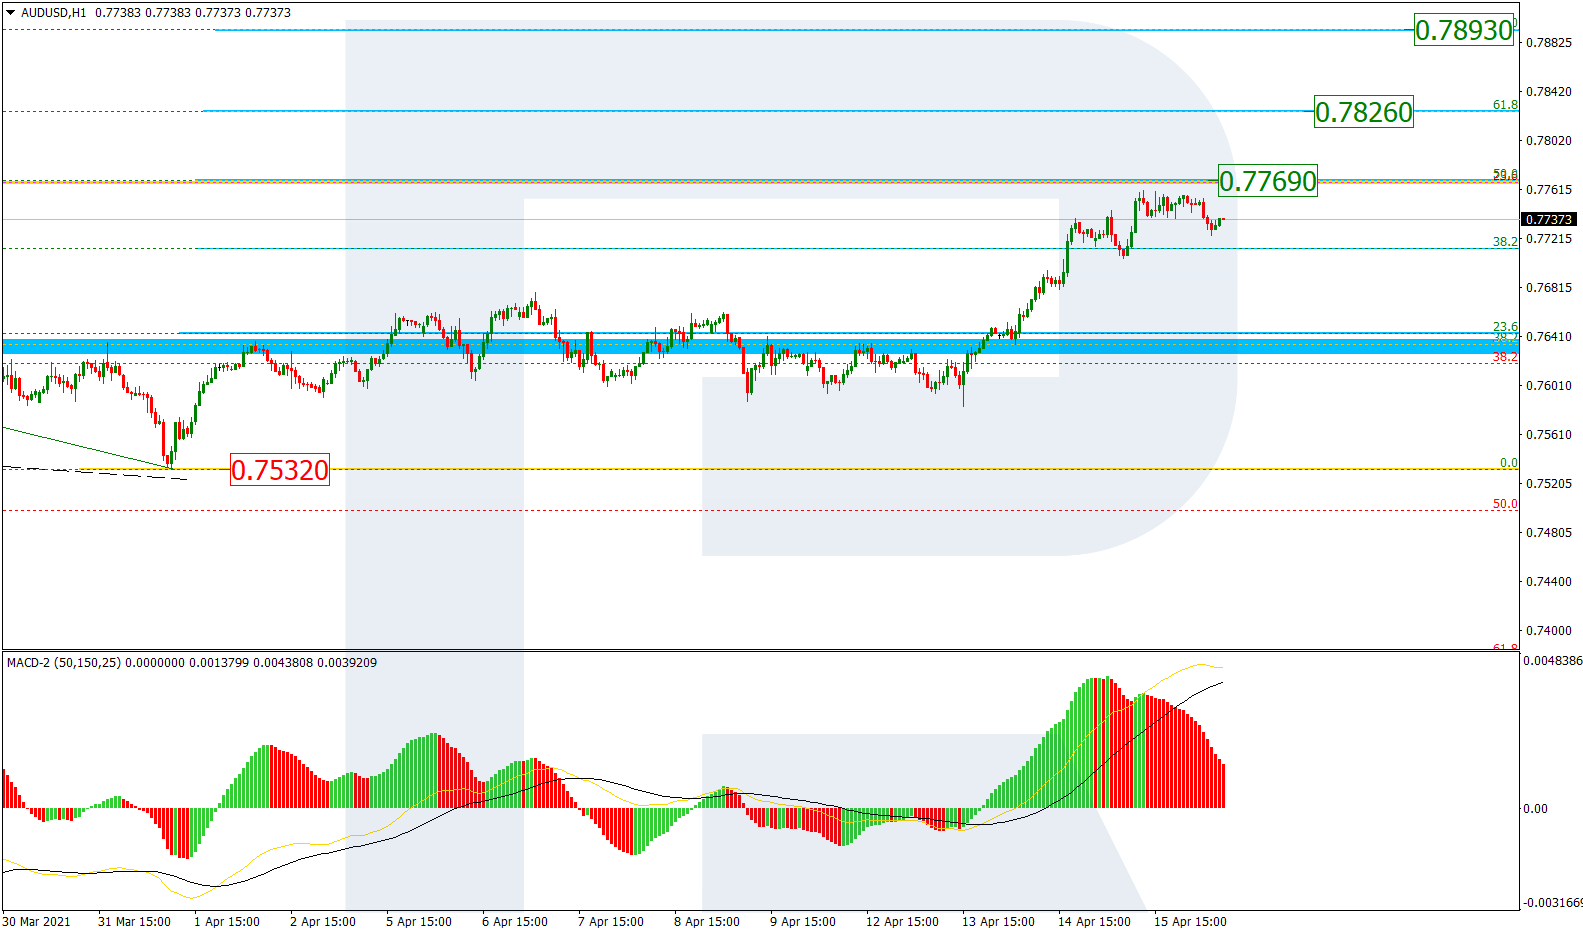
The H1 chart shows a more detailed structure of the current ascending correction, which has reached 50.0% fibo at 0.7769. Later, the price may continue growing towards 61.8% and 76.0% fibo at 0.7826 and 0.7893 respectively. The local support is the low at 0.7532, a breakout of which will lead to a further mid-term downtrend. At the same time, there is a local divergence on MACD, which may indicate a possible reversal.
Free Reports:
 Get our Weekly Commitment of Traders Reports - See where the biggest traders (Hedge Funds and Commercial Hedgers) are positioned in the futures markets on a weekly basis.
 Sign Up for Our Stock Market Newsletter – Get updated on News, Charts & Rankings of Public Companies when you join our Stocks Newsletter
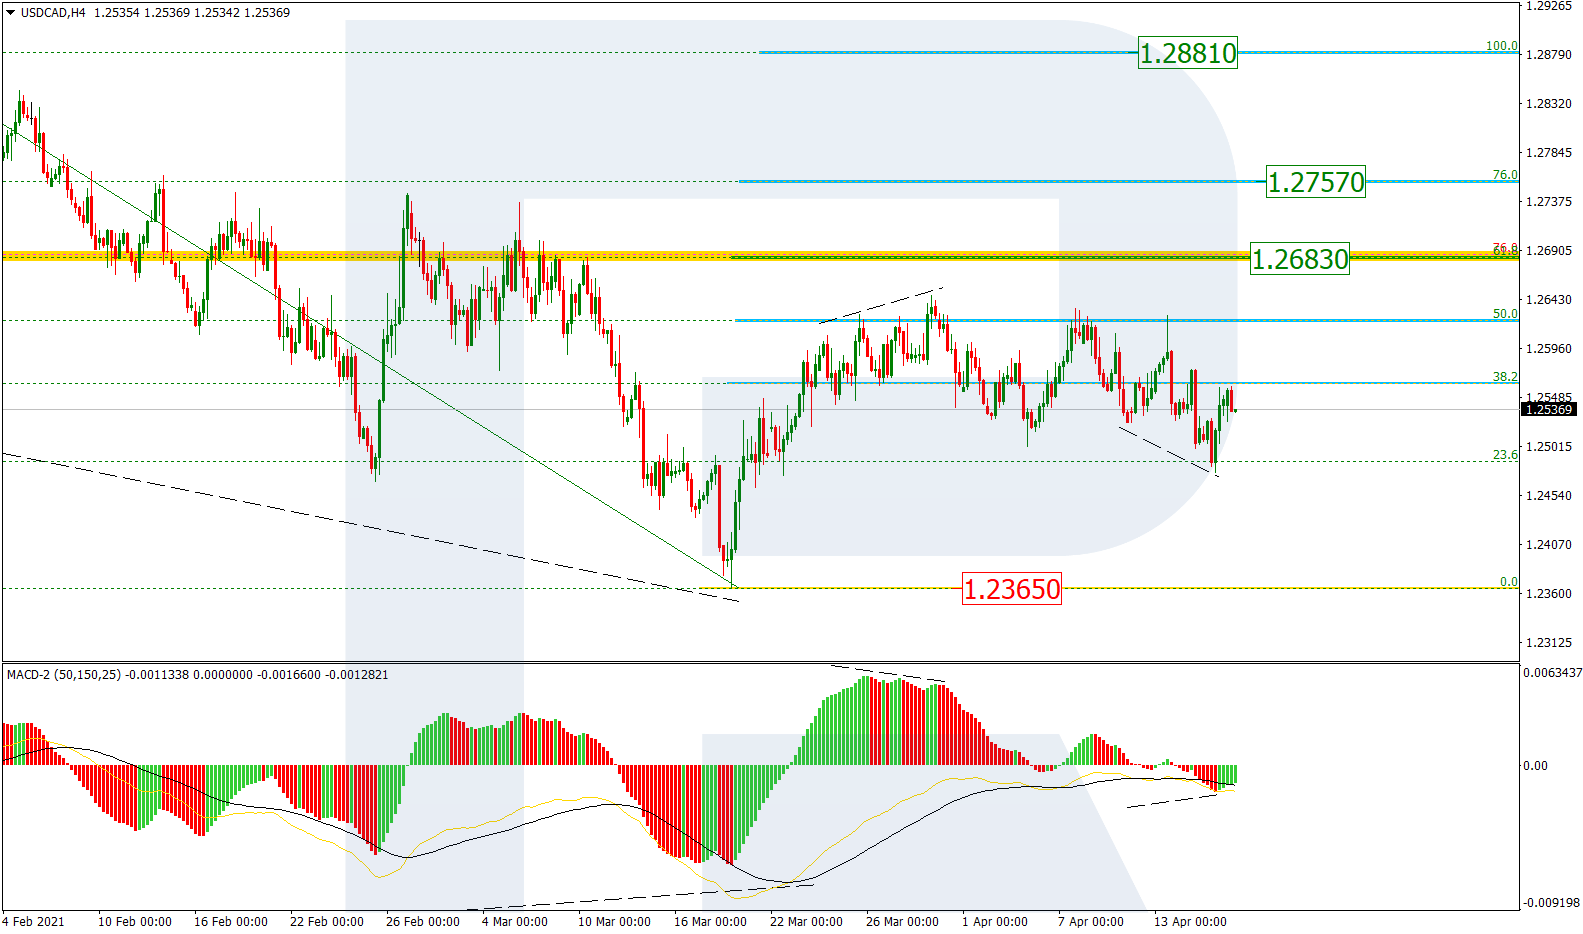
USDCAD, “US Dollar vs Canadian Dollar”
In the H4 chart, USDCAD is correcting downwards after completing the first wave to the upside and reaching 50.0% fibo. Later, the pair may resume growing towards 61.8% and 76.0% fibo at 1.2683 and 1.2757 respectively but the key upside target is the local high at 1.2881. The support remains at the low at 1.2365.
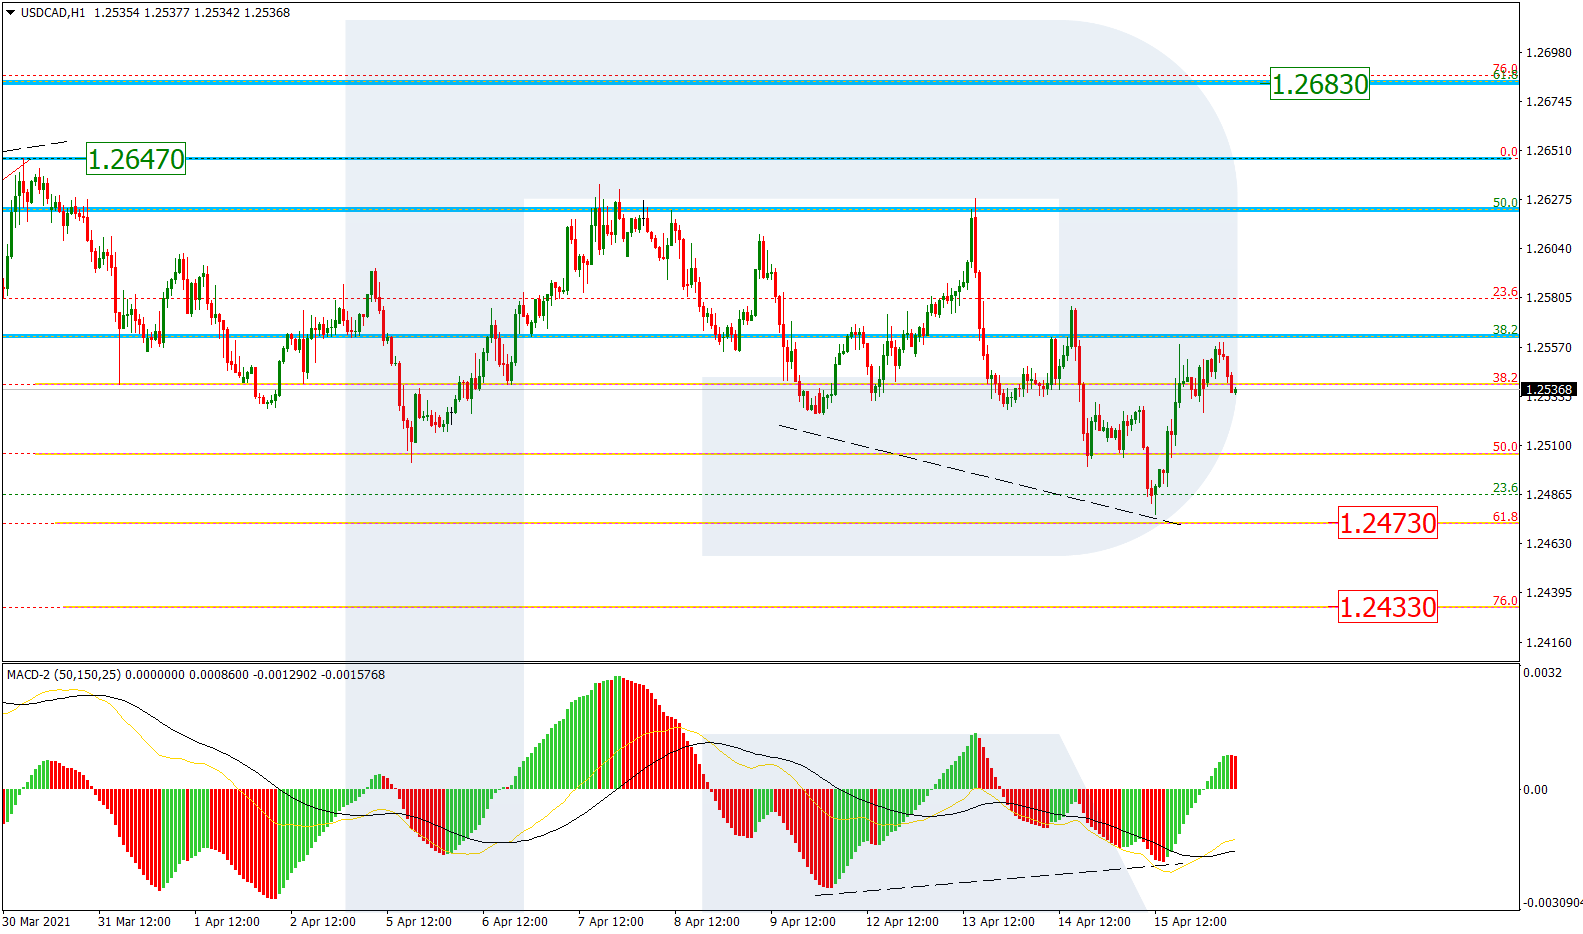
The H1 chart shows a more detailed structure of the current bearish correction, which has already broken 50.0% fibo. However, there is a convergence on MAСD, which indicates the start of a new pullback. Later, the asset may resume falling towards 61.8% and 76.0% fibo at 1.2473 and 1.2433 respectively.
Article By RoboForex.com
Attention!
Forecasts presented in this section only reflect the author’s private opinion and should not be considered as guidance for trading. RoboForex LP bears no responsibility for trading results based on trading recommendations described in these analytical reviews.

- The US introduces new import tariffs for 60 countries. Brent crude surpasses $100 per barrel Jul 24, 2026
- USD/JPY Breaks Records: Nothing Slows the Yen’s Decline Jul 24, 2026
- Oil prices reached a 6‑week high. The AUD strengthened on the back of a strong labor‑market report Jul 23, 2026
- EUR/USD Recovers as Dollar Weakens Jul 23, 2026
- Bitcoin rose to $66,000. The New Zealand dollar continues to strengthen Jul 22, 2026
- Inflationary pressure is easing in Canada. In New Zealand, on the contrary, inflation is rising Jul 21, 2026
- GBP/USD Falls After Cabinet Changes Jul 21, 2026
- Geopolitical and macroeconomic conditions continue to pressure market sentiment Jul 20, 2026
- USD/JPY Poised to Continue Gains as Expensive Oil and Lack of Support Weigh on Yen Jul 20, 2026
- COT Metals Charts: Weekly Speculator Bets led by Copper & Steel Jul 18, 2026