
Article By RoboForex.com
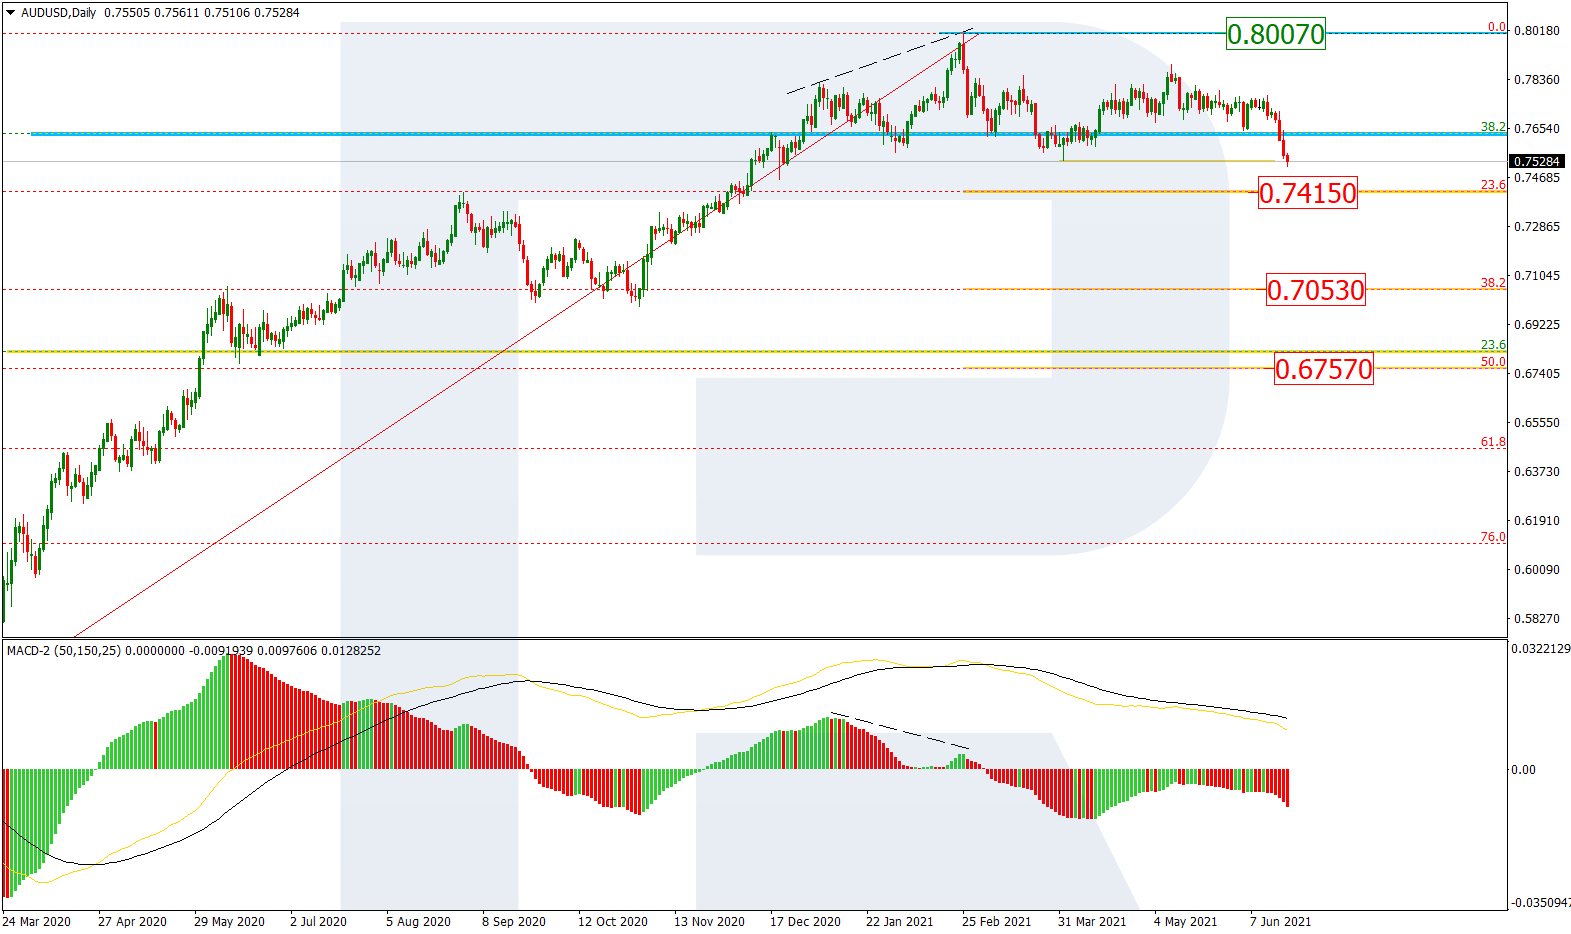
AUDUSD, “Australian Dollar vs US Dollar”
As we can see in the daily chart, there is a new descending wave after a divergence on MACD. The current technical pictures may be described as a long-term correction approaching 23.6% fibo at 0.7415. The next downside targets may be 38.2% and 50.0% fibo at 0.7053 and 0.6767 respectively. The resistance is the high at 0.8007.

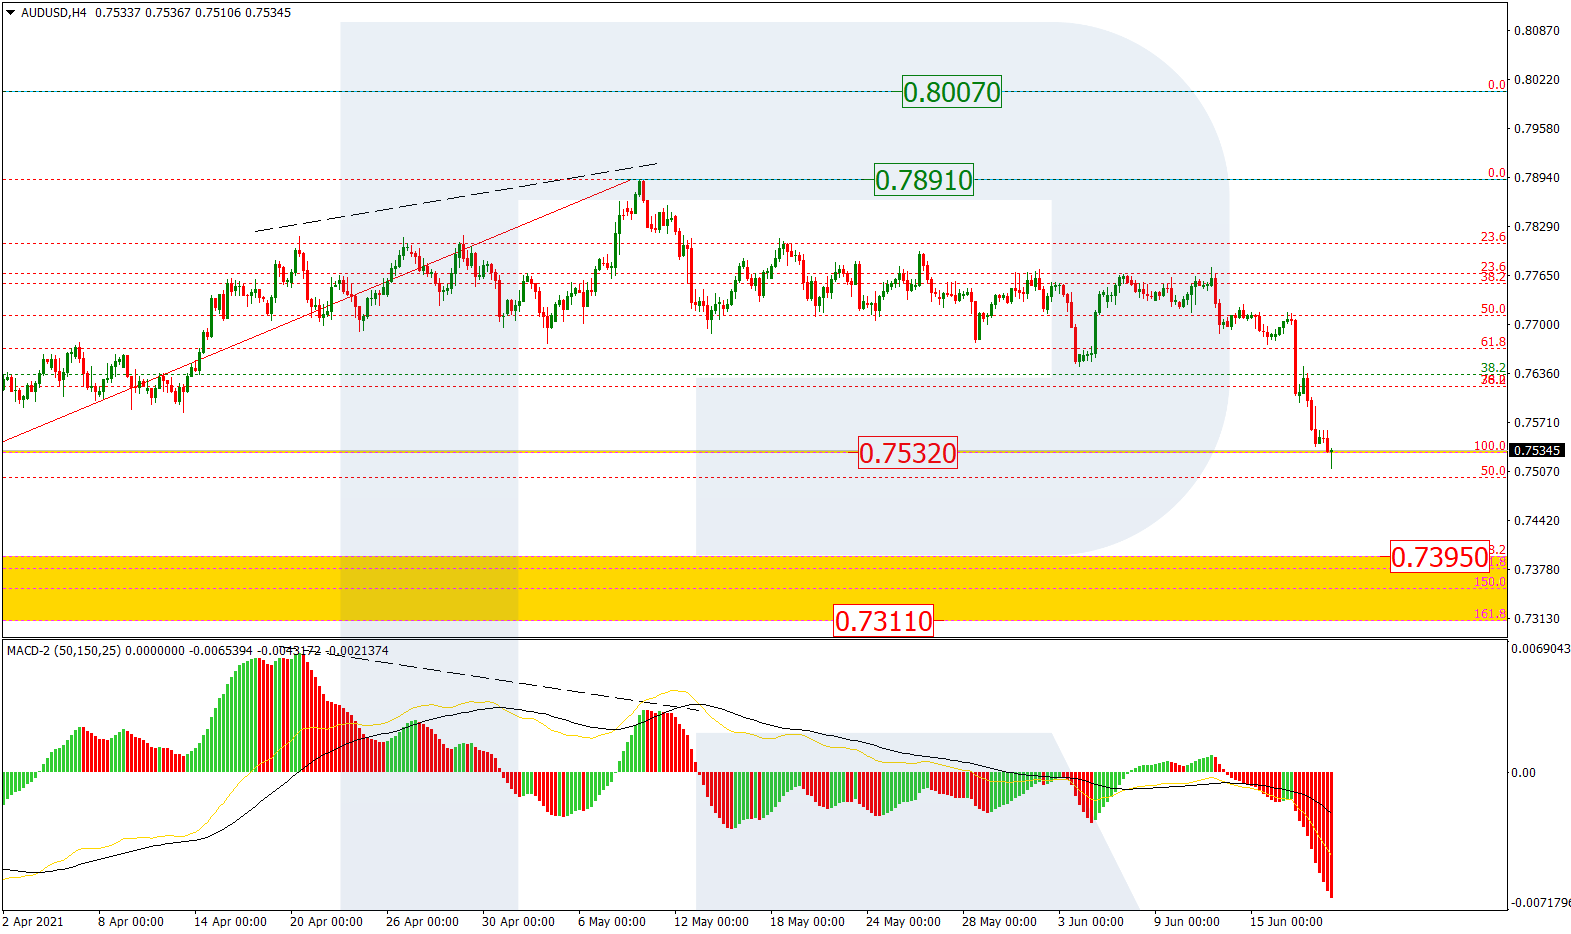
The H4 chart of AUDUSD shows an attempt to break the previous fractal low at 0.7532. If the price succeeds, the market may continue falling towards the post-correctional extension area between 138.2% and 161.8% fibo at 0.7395 and 0.7311 respectively. The local resistance is at 0.7891.
Free Reports:
 Download Our Metatrader 4 Indicators – Put Our Free MetaTrader 4 Custom Indicators on your charts when you join our Weekly Newsletter
 Get our Weekly Commitment of Traders Reports - See where the biggest traders (Hedge Funds and Commercial Hedgers) are positioned in the futures markets on a weekly basis.
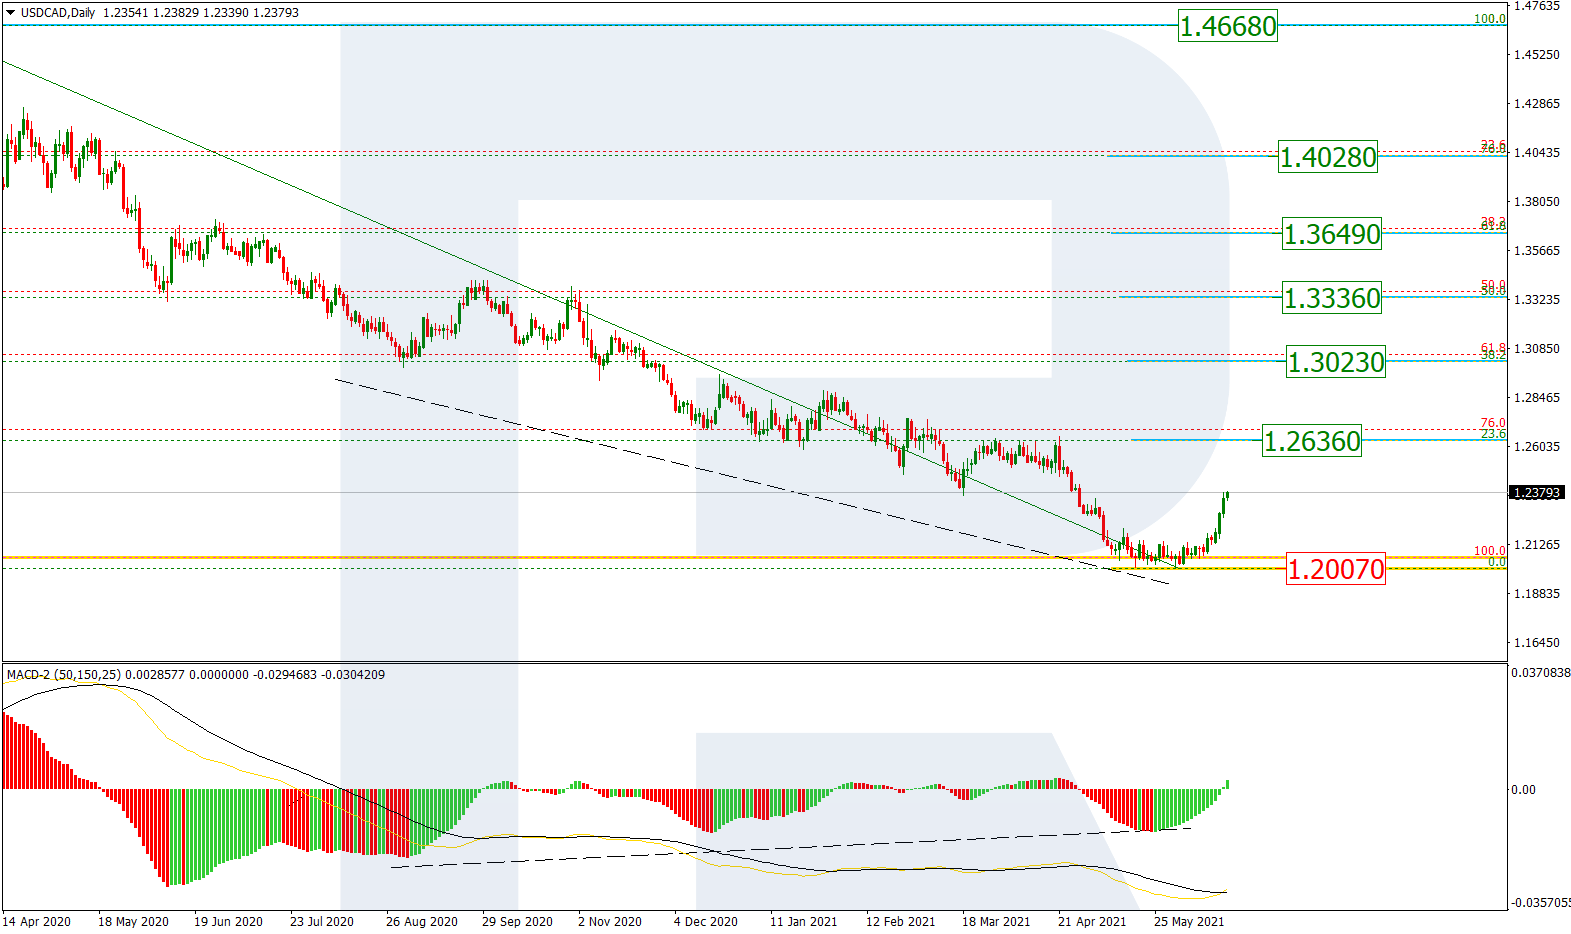
USDCAD, “US Dollar vs Canadian Dollar”
As we can see in the daily chart, after a test of the long-term low and a convergence on MACD, the pair is moving to the upside towards 23.6%, 38.2%, 50.0%, 61.8%, and 76.0% fibo at 1.2636, 1.3023, 1.3336, 1.3649, and 1.4028 respectively. As a result, we may assume that the pair is about to start a new long-term uptrend. The support is the low at 1.2007.
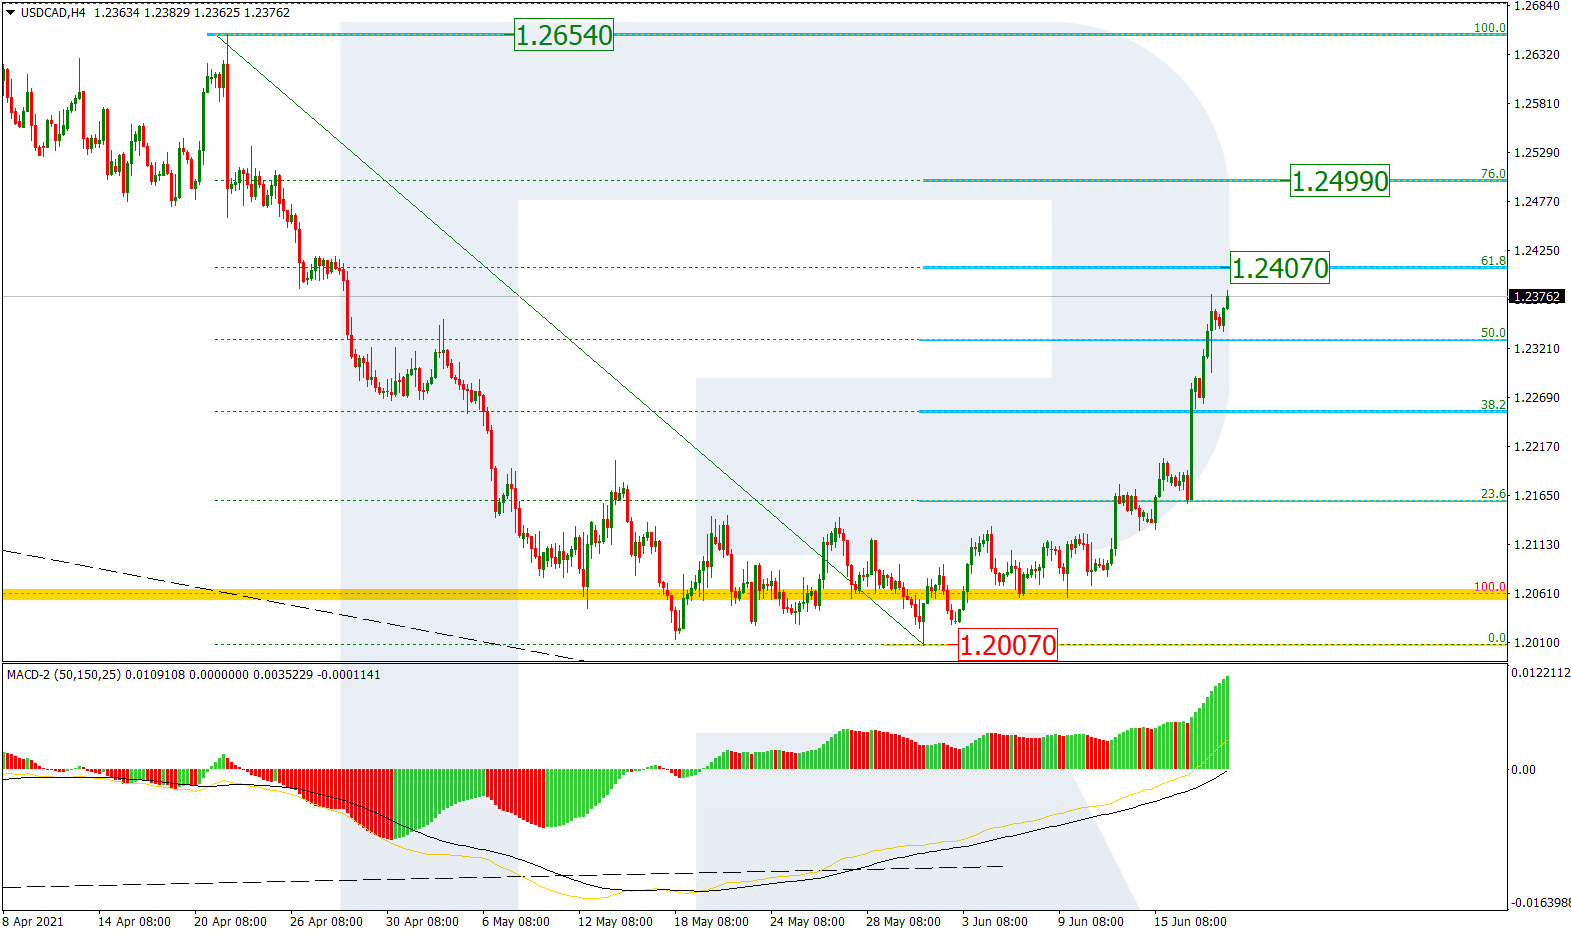
The H4 chart shows an ascending correction after the previous descending wave. The pair is approaching 61.8% fibo at 1.2407, a breakout of which may lead to a further uptrend towards 76.0% fibo at 1.2499. However, the key upside target is the resistance at 1.2654.
Article By RoboForex.com
Attention!
Forecasts presented in this section only reflect the author’s private opinion and should not be considered as guidance for trading. RoboForex LP bears no responsibility for trading results based on trading recommendations described in these analytical reviews.

- GBP/USD at Month’s Lows: The Outlook Remains Weak Jul 29, 2026
- Crude oil falls below $80 per barrel. Australia sees inflation slowdown Jul 29, 2026
- The US Tech sector hit by sell‑off. Oil prices decline on renewed negotiations Jul 28, 2026
- Gold Declines, Focus on Fed and Falling Oil Prices Jul 28, 2026
- This week will be one of the most crowded for central‑bank meetings Jul 27, 2026
- EUR/USD Ahead of a Key Week: Holding Near Lows Jul 27, 2026
- COT Metals Charts: Weekly Speculator Changes led by Copper Jul 26, 2026
- COT Bonds Charts: Speculator Bets led by SOFR 3-Months & 5-Year Bonds Jul 26, 2026
- COT Energy Charts: Weekly Speculator Bets led by WTI Crude & Natural Gas Jul 26, 2026
- COT Soft Commodities Charts: Weekly Speculator Bets led by Corn & Soybeans Jul 26, 2026