by JustForex
Jobless claims in the United States decreased by 26,000 to 360,000. It’s the lowest number in the last 16 months. The number of repeated claims also fell by 126,000 to 3.2 million. The labor market is recovering, but the US stock market closed without a single trend yesterday. The oil and gas, technology, and consumer services sectors showed negative index dynamics. The financial sector and utilities sectors showed growth dynamics. The S&P 500 decreased by 0.33%, the Dow Jones increased by 0.15% and the Nasdaq fell by 0.7%. At the same time, the positive quarterly results of the banks, which surpassed all expectations, do not contribute to the growth of indices, as investors are concerned about the rapid spread of the Delta strain and the possible beginning of a new wave of a global pandemic.
The European stock market closed in the red zone yesterday. Markets were put under pressure by concerns about the faster-than-expected tightening of monetary policies of the central banks and the rapid spread of the Delta strain of the coronavirus. Europe is reporting on inflation today. Economists are confident that the CPI will not exceed the target of 2% (the previous figure was 1.9%). A value above 2% may trigger a sell-off in the stock market.
Oil prices are falling as news that the UAE has reached a compromise on increasing oil production quotas with OPEC+ countries was confirmed. According to the new data, UAE has agreed on a new production benchmark of 3.65 Mbps (currently 3.17 Mbps).
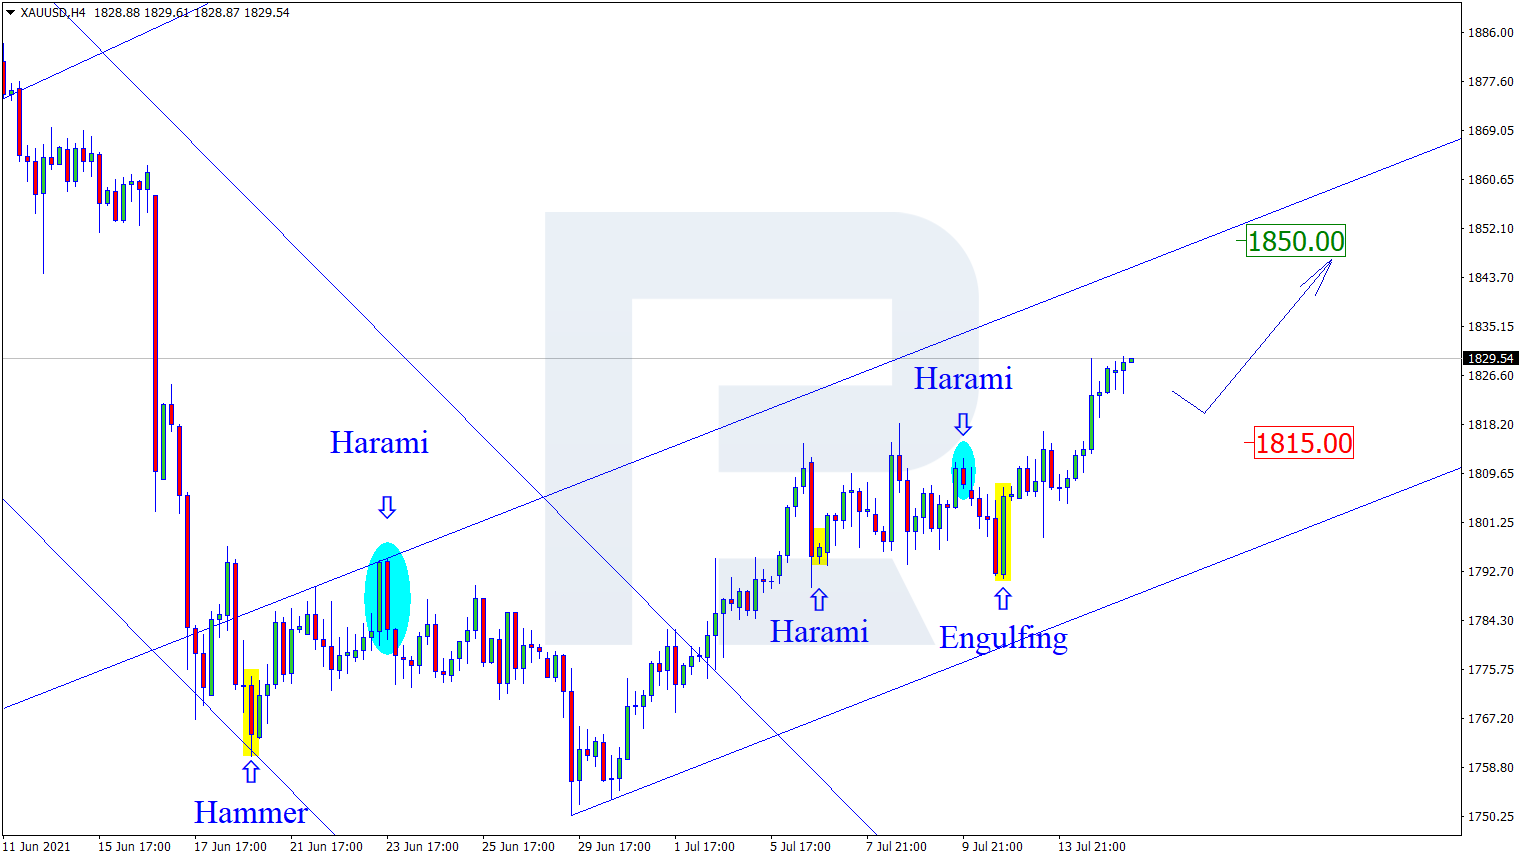
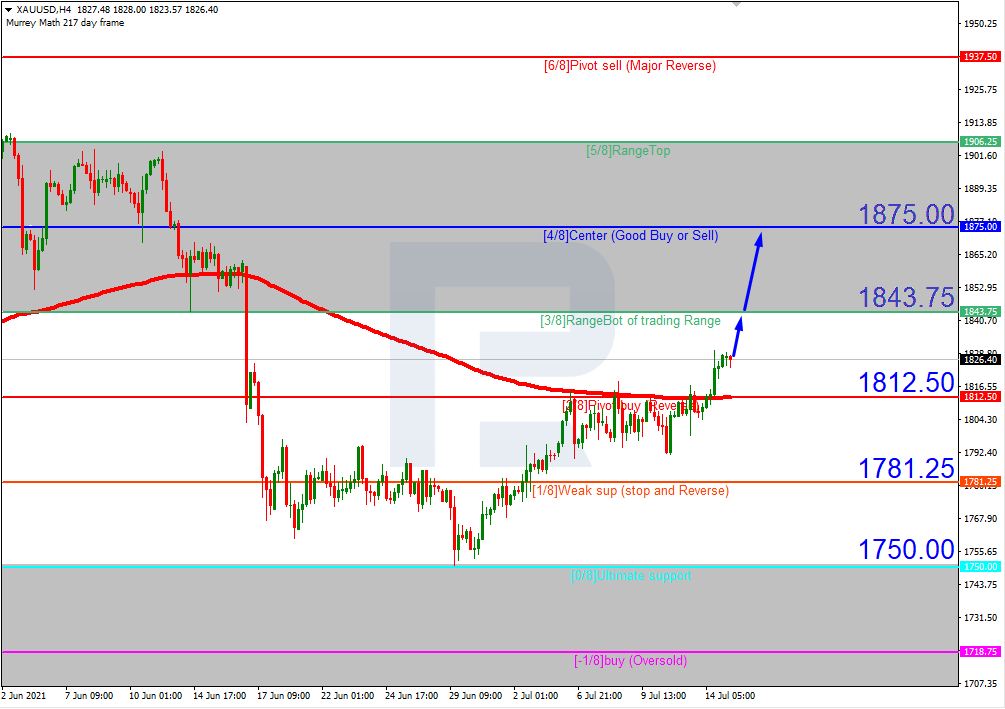
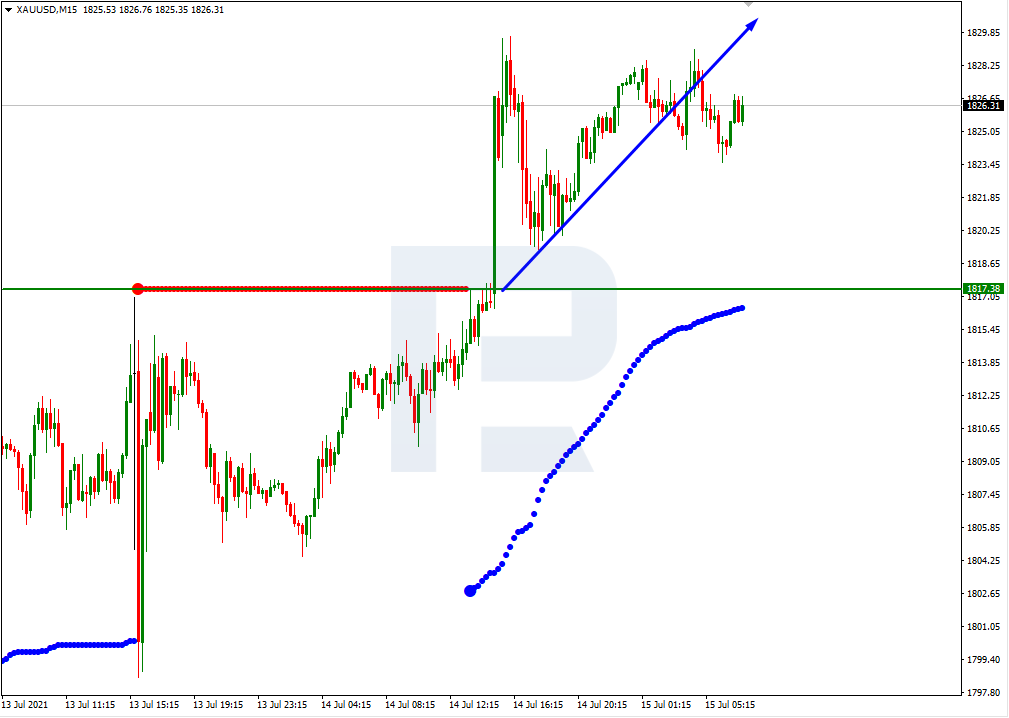
The situation with gold remains unchanged. Prices of precious metals are highly dependent on two factors: the dollar index and, especially, the US government bond yields. The lower the government bond yields are, the higher the gold prices will be. It should also be noted that gold imports into India increased by 4.4 times in the first half of the year compared to the same period in 2020. India is one of the largest consumers of gold in the world, with almost no production of its own.
The Bank of Japan kept key monetary policy parameters unchanged, but slightly raised its inflation forecast and lowered its GDP growth forecast for next year. Inflation in Japan is expected to be 0.6% in the current fiscal year and strengthen to 0.9% and 1% in the next two years, respectively. The regulator also said it will provide zero-percent loans to boost investment in green initiatives.
Main market quotes:
S&P 500 (F) 4,360.03 -14.27 (-0.33%)
Dow Jones 34,987.02 +53.79 (+0.15%)
DAX 15,629.66 -159.32 (-1.01%)
FTSE 100 7,012.02 -79.17 (-1.12%)
USD Index 92.58 +0.17 (+0.19%)
Important events:
- – New Zealand Consumer Price Index (m/m) at 01:45 (GMT+3);
- – BoJ Monetary Policy Statement at 06:00 (GMT+3);
- – BoJ Outlook Report at 06:00 (GMT+3);
- – BoJ Press Conference at 06:00 (GMT+3);
- – Eurozone Consumer Price Index (m/m) at 12:00 (GMT+3);
- – US Retail Sales (m/m) at 15:30 (GMT+3);
- – US UoM Consumer Sentiment (m/m) at 17:00 (GMT+3).
by JustForex
This article reflects a personal opinion and should not be interpreted as an investment advice, and/or offer, and/or a persistent request for carrying out financial transactions, and/or a guarantee, and/or a forecast of future events.