
By CountingPips.com COT Home | Data Tables | Data Downloads | Newsletter
Here are the latest charts and statistics for the Commitment of Traders (COT) data published by the Commodities Futures Trading Commission (CFTC).
The latest COT data is updated through Tuesday July 6th 2021 and shows a quick view of how large traders (for-profit speculators and commercial entities) were positioned in the futures markets. All currency positions are in direct relation to the US dollar where, for example, a bet for the euro is a bet that the euro will rise versus the dollar while a bet against the euro will be a bet that the euro will decline versus the dollar.
US Dollar Index Futures:
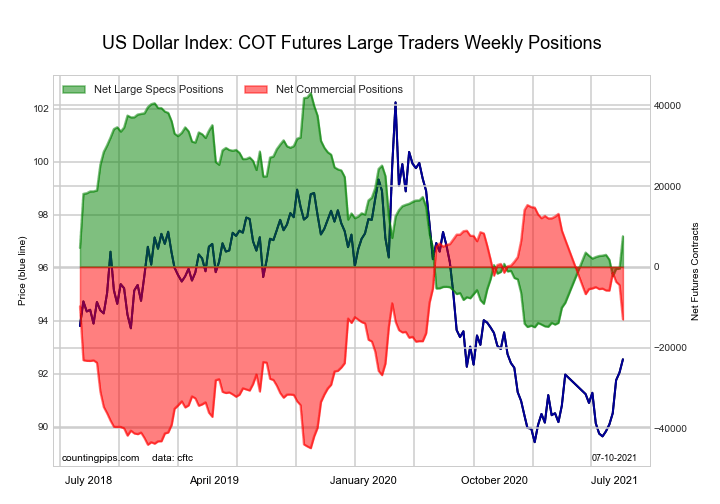 The US Dollar Index large speculator standing this week recorded a net position of 7,569 contracts in the data reported through Tuesday. This was a weekly rise of 8,017 contracts from the previous week which had a total of -448 net contracts.
This week’s current strength score (the trader positioning range over the past three years, measured from 0 to 100) shows the speculators are currently Bearish with a score of 38.8 percent. The commercials are Bullish with a score of 53.0 percent and the small traders (not shown in chart) are Bullish-Extreme with a score of 89.9 percent.
| US DOLLAR INDEX Statistics | SPECULATORS | COMMERCIALS | SMALL TRADERS |
| – Percent of Open Interest Longs: | 73.8 | 2.0 | 20.3 |
| – Percent of Open Interest Shorts: | 53.4 | 37.0 | 5.7 |
| – Net Position: | 7,569 | -13,020 | 5,451 |
| – Gross Longs: | 27,442 | 735 | 7,557 |
| – Gross Shorts: | 19,873 | 13,755 | 2,106 |
| – Long to Short Ratio: | 1.4 to 1 | 0.1 to 1 | 3.6 to 1 |
| NET POSITION TREND: | |||
| – COT Index Score (3 Year Range Pct): | 38.8 | 53.0 | 89.9 |
| – COT Index Reading (3 Year Range): | Bearish | Bullish | Bullish-Extreme |
| NET POSITION MOVEMENT INDEX: | |||
| – 6-Week Change in Strength Index: | 8.3 | -12.7 | 36.7 |
Free Reports:
 Get our Weekly Commitment of Traders Reports - See where the biggest traders (Hedge Funds and Commercial Hedgers) are positioned in the futures markets on a weekly basis.
 Download Our Metatrader 4 Indicators – Put Our Free MetaTrader 4 Custom Indicators on your charts when you join our Weekly Newsletter
Euro Currency Futures:
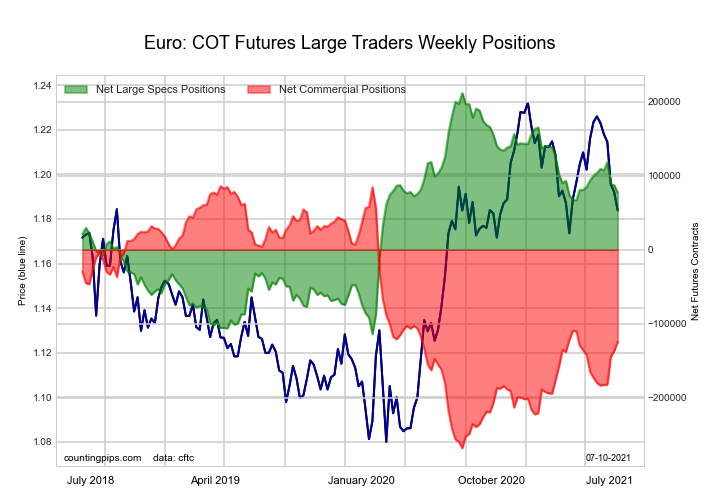 The Euro Currency large speculator standing this week recorded a net position of 77,190 contracts in the data reported through Tuesday. This was a weekly fall of -9,956 contracts from the previous week which had a total of 87,146 net contracts.
This week’s current strength score (the trader positioning range over the past three years, measured from 0 to 100) shows the speculators are currently Bullish with a score of 58.7 percent. The commercials are Bearish with a score of 40.6 percent and the small traders (not shown in chart) are Bullish with a score of 57.4 percent.
| EURO Currency Statistics | SPECULATORS | COMMERCIALS | SMALL TRADERS |
| – Percent of Open Interest Longs: | 30.5 | 55.2 | 13.5 |
| – Percent of Open Interest Shorts: | 19.4 | 73.0 | 6.8 |
| – Net Position: | 77,190 | -124,158 | 46,968 |
| – Gross Longs: | 212,998 | 386,189 | 94,301 |
| – Gross Shorts: | 135,808 | 510,347 | 47,333 |
| – Long to Short Ratio: | 1.6 to 1 | 0.8 to 1 | 2.0 to 1 |
| NET POSITION TREND: | |||
| – COT Index Score (3 Year Range Pct): | 58.7 | 40.6 | 57.4 |
| – COT Index Reading (3 Year Range): | Bullish | Bearish | Bullish |
| NET POSITION MOVEMENT INDEX: | |||
| – 6-Week Change in Strength Index: | -8.2 | 15.7 | -42.6 |
British Pound Sterling Futures:
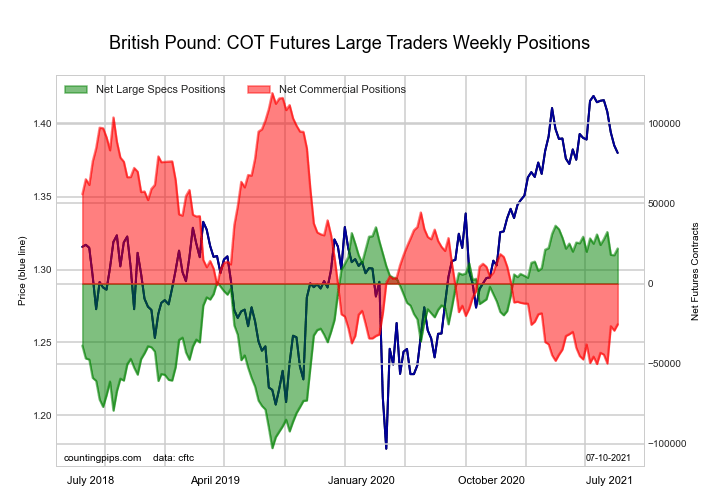 The British Pound Sterling large speculator standing this week recorded a net position of 21,903 contracts in the data reported through Tuesday. This was a weekly rise of 4,180 contracts from the previous week which had a total of 17,723 net contracts.
This week’s current strength score (the trader positioning range over the past three years, measured from 0 to 100) shows the speculators are currently Bullish-Extreme with a score of 89.8 percent. The commercials are Bearish-Extreme with a score of 14.6 percent and the small traders (not shown in chart) are Bullish with a score of 63.0 percent.
| BRITISH POUND Statistics | SPECULATORS | COMMERCIALS | SMALL TRADERS |
| – Percent of Open Interest Longs: | 32.0 | 49.4 | 16.7 |
| – Percent of Open Interest Shorts: | 19.8 | 63.7 | 14.7 |
| – Net Position: | 21,903 | -25,435 | 3,532 |
| – Gross Longs: | 57,232 | 88,387 | 29,841 |
| – Gross Shorts: | 35,329 | 113,822 | 26,309 |
| – Long to Short Ratio: | 1.6 to 1 | 0.8 to 1 | 1.1 to 1 |
| NET POSITION TREND: | |||
| – COT Index Score (3 Year Range Pct): | 89.8 | 14.6 | 63.0 |
| – COT Index Reading (3 Year Range): | Bullish-Extreme | Bearish-Extreme | Bullish |
| NET POSITION MOVEMENT INDEX: | |||
| – 6-Week Change in Strength Index: | -6.3 | 14.6 | -33.2 |
Japanese Yen Futures:
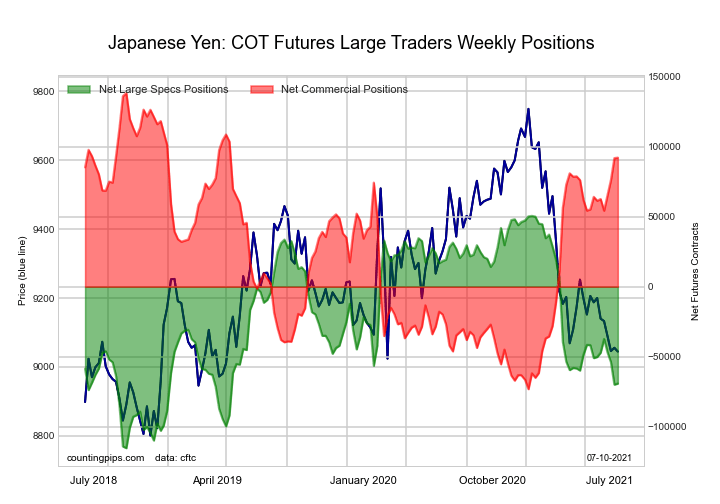 The Japanese Yen large speculator standing this week recorded a net position of -69,136 contracts in the data reported through Tuesday. This was a weekly gain of 759 contracts from the previous week which had a total of -69,895 net contracts.
This week’s current strength score (the trader positioning range over the past three years, measured from 0 to 100) shows the speculators are currently Bearish with a score of 27.8 percent. The commercials are Bullish with a score of 78.2 percent and the small traders (not shown in chart) are Bearish-Extreme with a score of 12.3 percent.
| JAPANESE YEN Statistics | SPECULATORS | COMMERCIALS | SMALL TRADERS |
| – Percent of Open Interest Longs: | 15.4 | 75.8 | 8.1 |
| – Percent of Open Interest Shorts: | 49.1 | 31.0 | 19.3 |
| – Net Position: | -69,136 | 92,131 | -22,995 |
| – Gross Longs: | 31,625 | 155,707 | 16,701 |
| – Gross Shorts: | 100,761 | 63,576 | 39,696 |
| – Long to Short Ratio: | 0.3 to 1 | 2.4 to 1 | 0.4 to 1 |
| NET POSITION TREND: | |||
| – COT Index Score (3 Year Range Pct): | 27.8 | 78.2 | 12.3 |
| – COT Index Reading (3 Year Range): | Bearish | Bullish | Bearish-Extreme |
| NET POSITION MOVEMENT INDEX: | |||
| – 6-Week Change in Strength Index: | -11.5 | 14.6 | -22.5 |
Swiss Franc Futures:
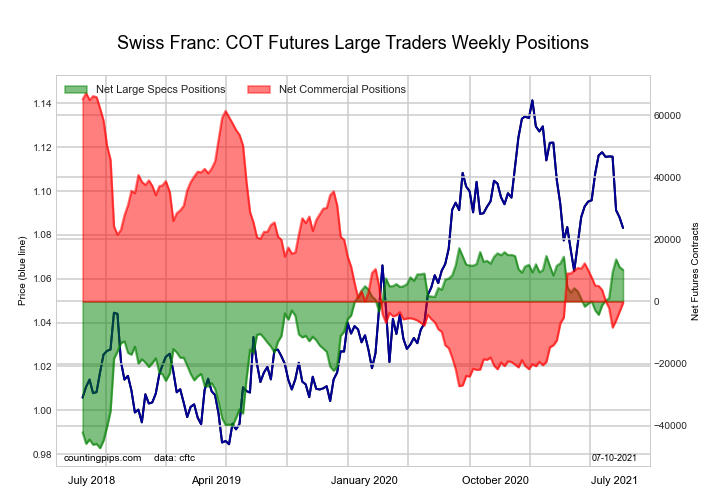 The Swiss Franc large speculator standing this week recorded a net position of 10,162 contracts in the data reported through Tuesday. This was a weekly decline of -903 contracts from the previous week which had a total of 11,065 net contracts.
This week’s current strength score (the trader positioning range over the past three years, measured from 0 to 100) shows the speculators are currently Bullish-Extreme with a score of 89.1 percent. The commercials are Bearish with a score of 28.4 percent and the small traders (not shown in chart) are Bearish with a score of 37.3 percent.
| SWISS FRANC Statistics | SPECULATORS | COMMERCIALS | SMALL TRADERS |
| – Percent of Open Interest Longs: | 43.0 | 35.2 | 21.4 |
| – Percent of Open Interest Shorts: | 20.3 | 36.2 | 43.2 |
| – Net Position: | 10,162 | -446 | -9,716 |
| – Gross Longs: | 19,230 | 15,763 | 9,595 |
| – Gross Shorts: | 9,068 | 16,209 | 19,311 |
| – Long to Short Ratio: | 2.1 to 1 | 1.0 to 1 | 0.5 to 1 |
| NET POSITION TREND: | |||
| – COT Index Score (3 Year Range Pct): | 89.1 | 28.4 | 37.3 |
| – COT Index Reading (3 Year Range): | Bullish-Extreme | Bearish | Bearish |
| NET POSITION MOVEMENT INDEX: | |||
| – 6-Week Change in Strength Index: | 17.7 | -4.4 | -20.4 |
Canadian Dollar Futures:
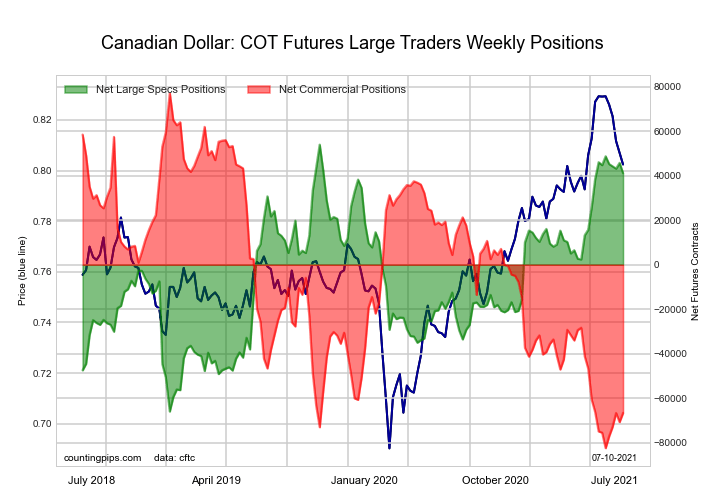 The Canadian Dollar large speculator standing this week recorded a net position of 41,178 contracts in the data reported through Tuesday. This was a weekly decline of -4,623 contracts from the previous week which had a total of 45,801 net contracts.
This week’s current strength score (the trader positioning range over the past three years, measured from 0 to 100) shows the speculators are currently Bullish-Extreme with a score of 89.3 percent. The commercials are Bearish-Extreme with a score of 9.9 percent and the small traders (not shown in chart) are Bullish-Extreme with a score of 85.2 percent.
| CANADIAN DOLLAR Statistics | SPECULATORS | COMMERCIALS | SMALL TRADERS |
| – Percent of Open Interest Longs: | 34.6 | 42.6 | 21.9 |
| – Percent of Open Interest Shorts: | 14.2 | 75.6 | 9.3 |
| – Net Position: | 41,178 | -66,667 | 25,489 |
| – Gross Longs: | 69,923 | 86,106 | 44,346 |
| – Gross Shorts: | 28,745 | 152,773 | 18,857 |
| – Long to Short Ratio: | 2.4 to 1 | 0.6 to 1 | 2.4 to 1 |
| NET POSITION TREND: | |||
| – COT Index Score (3 Year Range Pct): | 89.3 | 9.9 | 85.2 |
| – COT Index Reading (3 Year Range): | Bullish-Extreme | Bearish-Extreme | Bullish-Extreme |
| NET POSITION MOVEMENT INDEX: | |||
| – 6-Week Change in Strength Index: | -3.0 | 5.6 | -7.9 |
Australian Dollar Futures:
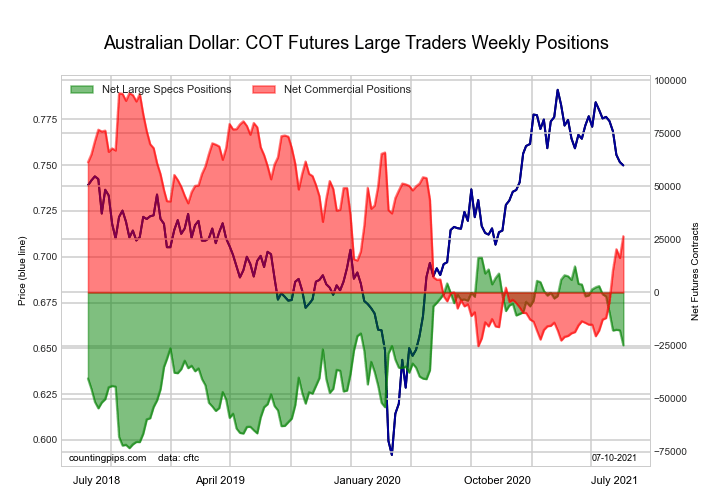 The Australian Dollar large speculator standing this week recorded a net position of -24,870 contracts in the data reported through Tuesday. This was a weekly fall of -7,070 contracts from the previous week which had a total of -17,800 net contracts.
This week’s current strength score (the trader positioning range over the past three years, measured from 0 to 100) shows the speculators are currently Bullish with a score of 54.0 percent. The commercials are Bearish with a score of 43.4 percent and the small traders (not shown in chart) are Bullish with a score of 53.6 percent.
| AUSTRALIAN DOLLAR Statistics | SPECULATORS | COMMERCIALS | SMALL TRADERS |
| – Percent of Open Interest Longs: | 36.2 | 46.8 | 15.8 |
| – Percent of Open Interest Shorts: | 53.1 | 28.8 | 16.9 |
| – Net Position: | -24,870 | 26,485 | -1,615 |
| – Gross Longs: | 53,352 | 68,894 | 23,265 |
| – Gross Shorts: | 78,222 | 42,409 | 24,880 |
| – Long to Short Ratio: | 0.7 to 1 | 1.6 to 1 | 0.9 to 1 |
| NET POSITION TREND: | |||
| – COT Index Score (3 Year Range Pct): | 54.0 | 43.4 | 53.6 |
| – COT Index Reading (3 Year Range): | Bullish | Bearish | Bullish |
| NET POSITION MOVEMENT INDEX: | |||
| – 6-Week Change in Strength Index: | -26.8 | 33.0 | -33.4 |
New Zealand Dollar Futures:
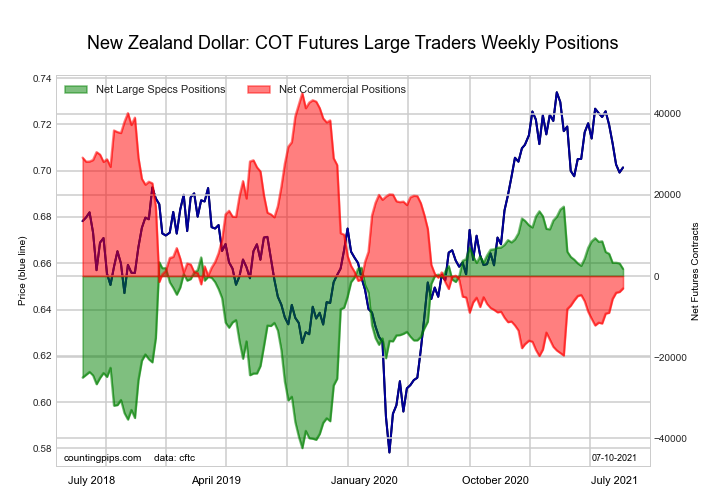 The New Zealand Dollar large speculator standing this week recorded a net position of 1,761 contracts in the data reported through Tuesday. This was a weekly decrease of -1,363 contracts from the previous week which had a total of 3,124 net contracts.
This week’s current strength score (the trader positioning range over the past three years, measured from 0 to 100) shows the speculators are currently Bullish with a score of 74.2 percent. The commercials are Bearish with a score of 25.7 percent and the small traders (not shown in chart) are Bullish with a score of 67.9 percent.
| NEW ZEALAND DOLLAR Statistics | SPECULATORS | COMMERCIALS | SMALL TRADERS |
| – Percent of Open Interest Longs: | 46.5 | 39.6 | 11.1 |
| – Percent of Open Interest Shorts: | 42.3 | 46.9 | 8.0 |
| – Net Position: | 1,761 | -3,063 | 1,302 |
| – Gross Longs: | 19,412 | 16,518 | 4,622 |
| – Gross Shorts: | 17,651 | 19,581 | 3,320 |
| – Long to Short Ratio: | 1.1 to 1 | 0.8 to 1 | 1.4 to 1 |
| NET POSITION TREND: | |||
| – COT Index Score (3 Year Range Pct): | 74.2 | 25.7 | 67.9 |
| – COT Index Reading (3 Year Range): | Bullish | Bearish | Bullish |
| NET POSITION MOVEMENT INDEX: | |||
| – 6-Week Change in Strength Index: | -11.4 | 13.3 | -20.1 |
Mexican Peso Futures:
 The Mexican Peso large speculator standing this week recorded a net position of -22,333 contracts in the data reported through Tuesday. This was a weekly decline of -2,879 contracts from the previous week which had a total of -19,454 net contracts.
This week’s current strength score (the trader positioning range over the past three years, measured from 0 to 100) shows the speculators are currently Bearish-Extreme with a score of 3.6 percent. The commercials are Bullish-Extreme with a score of 94.4 percent and the small traders (not shown in chart) are Bullish with a score of 66.7 percent.
| MEXICAN PESO Statistics | SPECULATORS | COMMERCIALS | SMALL TRADERS |
| – Percent of Open Interest Longs: | 48.0 | 45.8 | 5.6 |
| – Percent of Open Interest Shorts: | 63.2 | 34.4 | 1.8 |
| – Net Position: | -22,333 | 16,747 | 5,586 |
| – Gross Longs: | 70,788 | 67,470 | 8,220 |
| – Gross Shorts: | 93,121 | 50,723 | 2,634 |
| – Long to Short Ratio: | 0.8 to 1 | 1.3 to 1 | 3.1 to 1 |
| NET POSITION TREND: | |||
| – COT Index Score (3 Year Range Pct): | 3.6 | 94.4 | 66.7 |
| – COT Index Reading (3 Year Range): | Bearish-Extreme | Bullish-Extreme | Bullish |
| NET POSITION MOVEMENT INDEX: | |||
| – 6-Week Change in Strength Index: | -6.9 | 6.4 | 3.6 |
Brazilian Real Futures:
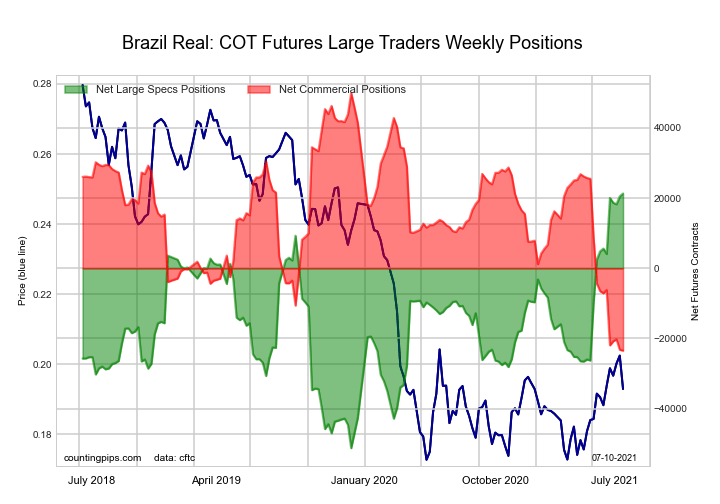 The Brazilian Real large speculator standing this week recorded a net position of 21,305 contracts in the data reported through Tuesday. This was a weekly gain of 819 contracts from the previous week which had a total of 20,486 net contracts.
This week’s current strength score (the trader positioning range over the past three years, measured from 0 to 100) shows the speculators are currently Bullish-Extreme with a score of 100.0 percent. The commercials are Bearish-Extreme with a score of 0.0 percent and the small traders (not shown in chart) are Bullish-Extreme with a score of 93.0 percent.
| BRAZIL REAL Statistics | SPECULATORS | COMMERCIALS | SMALL TRADERS |
| – Percent of Open Interest Longs: | 72.3 | 19.3 | 8.3 |
| – Percent of Open Interest Shorts: | 23.5 | 73.0 | 3.3 |
| – Net Position: | 21,305 | -23,470 | 2,165 |
| – Gross Longs: | 31,593 | 8,438 | 3,628 |
| – Gross Shorts: | 10,288 | 31,908 | 1,463 |
| – Long to Short Ratio: | 3.1 to 1 | 0.3 to 1 | 2.5 to 1 |
| NET POSITION TREND: | |||
| – COT Index Score (3 Year Range Pct): | 100.0 | 0.0 | 93.0 |
| – COT Index Reading (3 Year Range): | Bullish-Extreme | Bearish-Extreme | Bullish-Extreme |
| NET POSITION MOVEMENT INDEX: | |||
| – 6-Week Change in Strength Index: | 21.6 | -22.3 | 8.0 |
Russian Ruble Futures:
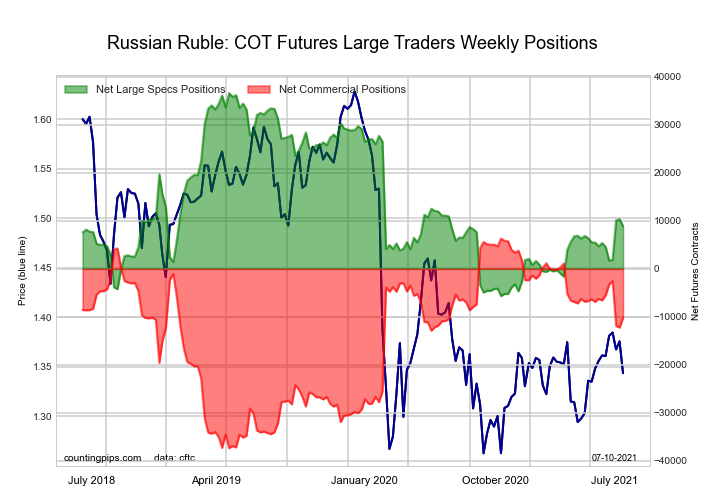 The Russian Ruble large speculator standing this week recorded a net position of 8,897 contracts in the data reported through Tuesday. This was a weekly decrease of -1,441 contracts from the previous week which had a total of 10,338 net contracts.
This week’s current strength score (the trader positioning range over the past three years, measured from 0 to 100) shows the speculators are currently Bearish with a score of 34.4 percent. The commercials are Bullish with a score of 62.3 percent and the small traders (not shown in chart) are Bullish-Extreme with a score of 80.5 percent.
| RUSSIAN RUBLE Statistics | SPECULATORS | COMMERCIALS | SMALL TRADERS |
| – Percent of Open Interest Longs: | 40.3 | 53.7 | 6.0 |
| – Percent of Open Interest Shorts: | 21.0 | 75.8 | 3.2 |
| – Net Position: | 8,897 | -10,154 | 1,257 |
| – Gross Longs: | 18,556 | 24,696 | 2,742 |
| – Gross Shorts: | 9,659 | 34,850 | 1,485 |
| – Long to Short Ratio: | 1.9 to 1 | 0.7 to 1 | 1.8 to 1 |
| NET POSITION TREND: | |||
| – COT Index Score (3 Year Range Pct): | 34.4 | 62.3 | 80.5 |
| – COT Index Reading (3 Year Range): | Bearish | Bullish | Bullish-Extreme |
| NET POSITION MOVEMENT INDEX: | |||
| – 6-Week Change in Strength Index: | 8.3 | -8.3 | 2.4 |
Bitcoin Futures:
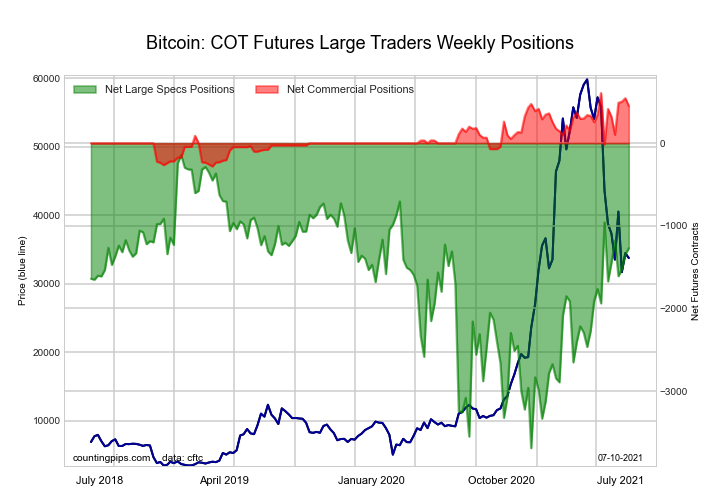 The Bitcoin large speculator standing this week recorded a net position of -1,271 contracts in the data reported through Tuesday. This was a weekly gain of 74 contracts from the previous week which had a total of -1,345 net contracts.
This week’s current strength score (the trader positioning range over the past three years, measured from 0 to 100) shows the speculators are currently Bullish with a score of 68.2 percent. The commercials are Bullish-Extreme with a score of 82.3 percent and the small traders (not shown in chart) are Bearish-Extreme with a score of 16.7 percent.
| BITCOIN Statistics | SPECULATORS | COMMERCIALS | SMALL TRADERS |
| – Percent of Open Interest Longs: | 58.3 | 8.2 | 23.3 |
| – Percent of Open Interest Shorts: | 76.8 | 1.6 | 11.4 |
| – Net Position: | -1,271 | 450 | 821 |
| – Gross Longs: | 4,018 | 562 | 1,603 |
| – Gross Shorts: | 5,289 | 112 | 782 |
| – Long to Short Ratio: | 0.8 to 1 | 5.0 to 1 | 2.0 to 1 |
| NET POSITION TREND: | |||
| – COT Index Score (3 Year Range Pct): | 68.2 | 82.3 | 16.7 |
| – COT Index Reading (3 Year Range): | Bullish | Bullish-Extreme | Bearish-Extreme |
| NET POSITION MOVEMENT INDEX: | |||
| – 6-Week Change in Strength Index: | 11.3 | 3.9 | -14.4 |
Article By CountingPips.com – Receive our weekly COT Reports by Email
*COT Report: The COT data, released weekly to the public each Friday, is updated through the most recent Tuesday (data is 3 days old) and shows a quick view of how large speculators or non-commercials (for-profit traders) were positioned in the futures markets.
The CFTC categorizes trader positions according to commercial hedgers (traders who use futures contracts for hedging as part of the business), non-commercials (large traders who speculate to realize trading profits) and nonreportable traders (usually small traders/speculators).
Find CFTC criteria here: (http://www.cftc.gov/MarketReports/CommitmentsofTraders/ExplanatoryNotes/index.htm).

- The US Tech sector hit by sell‑off. Oil prices decline on renewed negotiations Jul 28, 2026
- Gold Declines, Focus on Fed and Falling Oil Prices Jul 28, 2026
- This week will be one of the most crowded for central‑bank meetings Jul 27, 2026
- EUR/USD Ahead of a Key Week: Holding Near Lows Jul 27, 2026
- COT Metals Charts: Weekly Speculator Changes led by Copper Jul 26, 2026
- COT Bonds Charts: Speculator Bets led by SOFR 3-Months & 5-Year Bonds Jul 26, 2026
- COT Energy Charts: Weekly Speculator Bets led by WTI Crude & Natural Gas Jul 26, 2026
- COT Soft Commodities Charts: Weekly Speculator Bets led by Corn & Soybeans Jul 26, 2026
- The US introduces new import tariffs for 60 countries. Brent crude surpasses $100 per barrel Jul 24, 2026
- USD/JPY Breaks Records: Nothing Slows the Yen’s Decline Jul 24, 2026