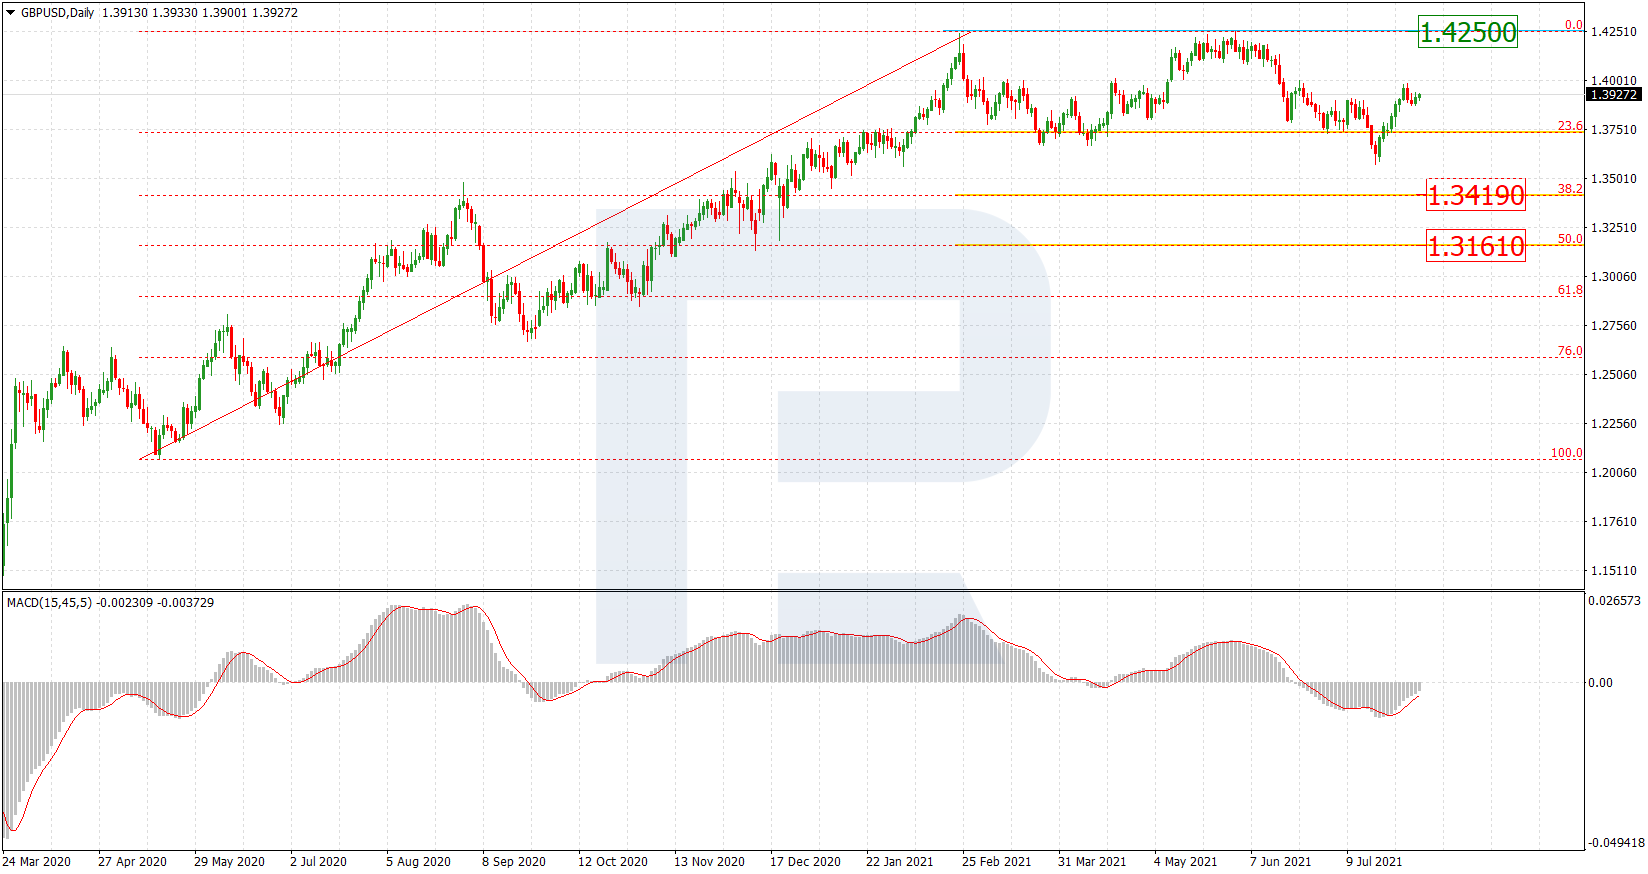
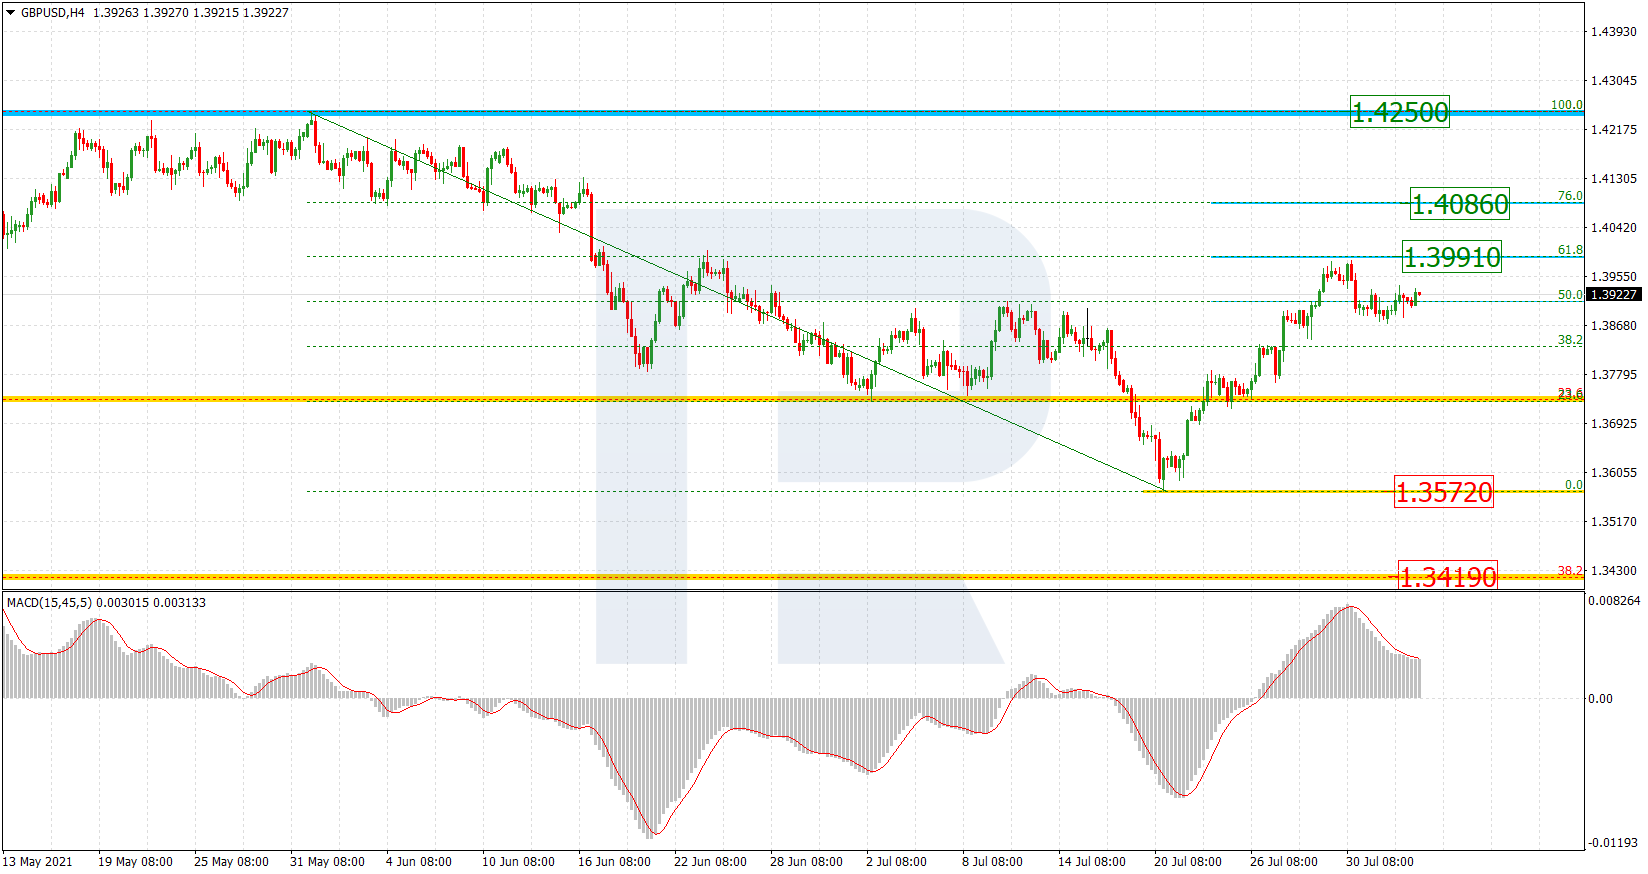
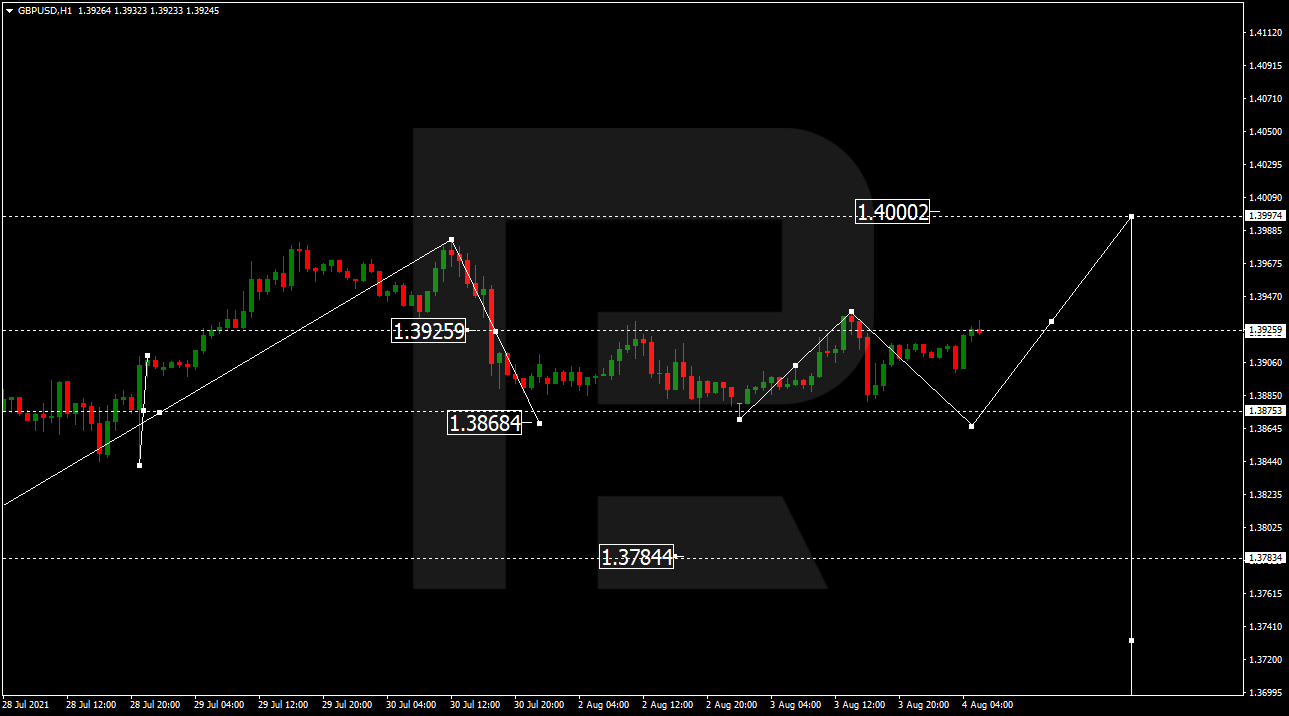
GBPUSD has endured some wild swings in recent weeks, testing both its lower and upper Bollinger bands last month. At the time of writing, cable is now relying on its 50-day simple moving average (SMA) as a key support level, as traders await some major events later this week.
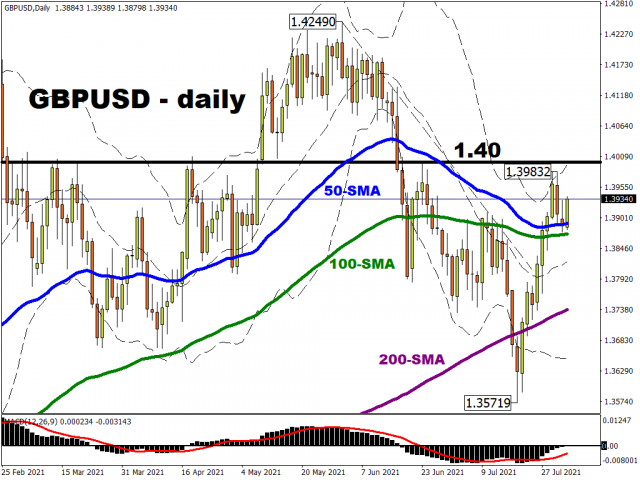
To be clear, the Pound has fared remarkably well of late, erasing much of its losses against the greenback since the hawkish surprise at the June FOMC meeting which sent the US dollar soaring.
In fact, the Pound is the best performing G10 currency against the US Dollar so far this year.
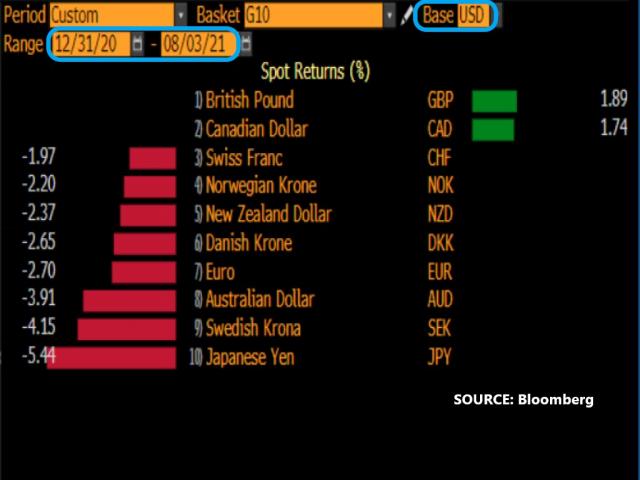
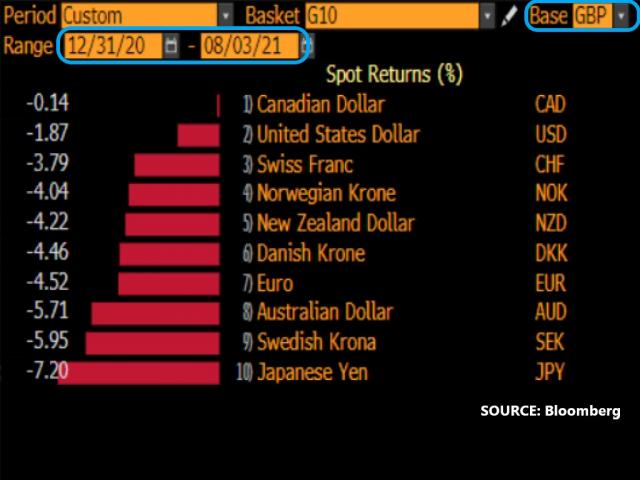
Also of note, the pound has strengthened against all of its G10 peers on a year-to-date basis.
The question facing GBPUSD traders is whether cable can stay on its perch for the immediate term?
More clues to that question could potentially be found in two major events this week:
- Thursday, 5 August: BOE policy meeting
- Friday, 6 August: US nonfarm payrolls (NFP)
Let’s start by casting our attentions to the other side of the pond.
How would the US nonfarm payrolls impact GBPUSD?
Markets are forecasting that 875,000 jobs were added in the US last month. While higher than June’s reading of 850,000, a mere 25k increase might not be the kind of “substantial further progress” that the Fed demands before it can start to taper (ease up on its bond purchases that have supported financial markets since the pandemic).
However, should the NFP surprise to the upside (think closer to the one million mark), that could reinvigorate dollar bulls and send the buck higher.
This is because a better-than-expected jobs report could mean that the Fed’s tapering may have to happen sooner rather than later, which then brings forward the eventual interest rate hike. Higher US rates relative to its G10 peers point to more USD gains.
‘Markets Extra’ podcast: Confused by the Fed? So were the markets.
A robust NFP print this Friday could buttress the “tapering sooner” narrative, which could then come at the expense of the pound with GBPUSD being dragged below its 50-day and 100-day SMAs. On the other hand, should the latest jobs data disappoint (think sub-800k), that should keep cable above its 50-SMA.
How might the BOE influence the pound this week?
The Bank of England is widely expected to leave its policy settings untouched this week, with policymakers having enough reasons to mute their hawkish tendencies for the time being.
This is because, despite signs of inflation building up (the UK’s headline CPI for June was at its highest since 2018 and well above the BOE’s 2% target), policymakers are set to remain cognizant of the downside risks to the UK economy, including:
- about 1.9 million people who are still on furlough, with the scheme set to be withdrawn next month. This casts some dark clouds over the UK employment outlook in the coming months.
- the delta variant still poses some uncertainties for the UK economic recovery, even though the IMF recently forecasted that the UK is set to post the fastest recovery among G7 economies this year (joint top with the US).
But we could still be in for a BOE shocker if it decides this week to adjust the threshold for winding down the quantitative easing measures.
For context, quantitative easing (QE) is, to quote the BOE, when the central bank “buys bonds to lower interest rates on savings and loans” and support the economy. Having built up a debt pile of 895 billion pounds and with inflation picking up, market participants are pondering what conditions might trigger the BOE’s unwinding of its stimulus.
As things stand, the BOE says that it won’t reduce its stock of government debt until the bank rate hits 1.5% (it’s currently at 0.1%).
If that threshold is lowered this week, say to 1%, that could send gilt yields moving higher, bring Sterling along with it.
Expect more pound volatility ahead
On the balance of these two major events that could impact GBPUSD this week (BOE decision and US NFP), the latter appears to harbour more potential to sway cable, especially considering that the whisper number for Friday’s job report currently stands at 920k, which is higher than the median estimate in Bloomberg’s survey (875k).
Still, both events could surprise either way. And with such tentative outcomes looming large, markets have over the past month priced in higher implied volatility for G10 currencies versus the pound over a one-week period.
As a potential scenario, if the BOE remains decidedly dovish while a stellar NFP print forces the Fed to become more hawkish, such a combo should prompt GBPUSD to unwind recent gains.
Alternatively, if the BOE lowers its threshold for paring down its debt pile, and the US jobs report disappoints, that could push GBPUSD back above the psychologically-important 1.40 mark.
Disclaimer: The content in this article comprises personal opinions and should not be construed as containing personal and/or other investment advice and/or an offer of and/or solicitation for any transactions in financial instruments and/or a guarantee and/or prediction of future performance. ForexTime (FXTM), its affiliates, agents, directors, officers or employees do not guarantee the accuracy, validity, timeliness or completeness, of any information or data made available and assume no liability as to any loss arising from any investment based on the same.