Archive for Forex and Currency News – Page 234

Ichimoku Cloud Analysis 23.08.2021 (AUDUSD, BRENT, USDJPY)

Article By RoboForex.com

AUDUSD, “Australian Dollar vs US Dollar”

AUDUSD is trading at 0.7158; the instrument is moving below Ichimoku Cloud, thus indicating a descending tendency. The markets could indicate that the price may test Tenkan-Sen and Kijun-Sen at 0.7215 and then resume moving downwards to reach 0.6995. Another signal in favor of a further downtrend will be a rebound from the descending channel’s upside border. However, the bearish scenario may no longer be valid if the price breaks the cloud’s upside border and fixes above 0.7355. In this case, the pair may continue growing towards 0.7445.

AUDUSD
Risk Warning: the result of previous trading operations do not guarantee the same results in the future

BRENT

Brent is trading at 66.39; the instrument is moving below Ichimoku Cloud, thus indicating a descending tendency. The markets could indicate that the price may test the cloud’s downside border at 68.95 and then resume moving downwards to reach 61.25. Another signal in favor of a further downtrend will be a rebound from the descending channel’s upside border. However, the bearish scenario may no longer be valid if the price breaks the cloud’s upside border and fixes above 70.75. In this case, the pair may continue growing towards 75.05.

BRENT
Risk Warning: the result of previous trading operations do not guarantee the same results in the future

USDJPY, “US Dollar vs Japanese Yen”

USDJPY is trading at 109.91; the instrument is moving above Ichimoku Cloud, thus indicating an ascending tendency. The markets could indicate that the price may test the cloud’s downside border at 109.65 and then resume moving upwards to reach 111.25. Another signal in favor of a further uptrend will be a rebound from the downside border of the Triangle pattern. However, the bullish scenario may no longer be valid if the price breaks the cloud’s downside border and fixes below 109.25. In this case, the pair may continue falling towards 108.35. To confirm further growth, the asset must break the pattern’s upside border and fix above 110.25.

USDJPY

Article By RoboForex.com

Attention!
Forecasts presented in this section only reflect the author’s private opinion and should not be considered as guidance for trading. RoboForex LP bears no responsibility for trading results based on trading recommendations described in these analytical reviews.

Forex Technical Analysis & Forecast 23.08.2021

Article By RoboForex.com

EURUSD, “Euro vs US Dollar”

After finishing another descending structure at 1.1633 along with the correction towards 1.1697, EURUSD has formed a new consolidation range around the latter level; right now, it is expected to break it to the upside and continue the correction to reach 1.1731. After that, the instrument may fall to return to 1.1697 and forming another consolidation range there. If later the price breaks this range to the downside, the market may resume falling with the target at 1.1600; if to the upside – continue the correction towards 1.1740.

EURUSD
Risk Warning: the result of previous trading operations do not guarantee the same results in the future

GBPUSD, “Great Britain Pound vs US Dollar”

After completing the descending wave and reaching the short-term target at 1.3601, GBPUSD is trading correcting towards 1.3666. downwards. Possibly, the pair may test 1.3680 and then form a new descending wave with the target at 1.3599.

GBPUSD
Risk Warning: the result of previous trading operations do not guarantee the same results in the future

USDRUB, “US Dollar vs Russian Ruble”

USDRUB is falling towards 73.60 and may later correct to reach 74.04, thus forming a new consolidation range between these two levels. If later the price breaks this range to the downside, the market may resume falling within the downtrend with the target at 72.00; if to the upside – form one more ascending structure towards 75.00.

USDRUB
Risk Warning: the result of previous trading operations do not guarantee the same results in the future

USDJPY, “US Dollar vs Japanese Yen”

USDJPY is still correcting to the upside; by now, it has formed a new consolidation range around 109.73. Possibly, today the pair may form a new descending structure towards 109.59 and then start another growth to reach 109.97. Later, the market may resume falling with the short-term target at 109.19.

USDJPY
Risk Warning: the result of previous trading operations do not guarantee the same results in the future

USDCHF, “US Dollar vs Swiss Franc”

USDCHF is still consolidating above 0.9166. Today, the pair may fall to reach 0.9140 and then start another growth to return to 0.9166. Later, the market may complete the correction by falling towards 0.9126 and then form one more ascending structure with the target at 0.9222.

USDCHF
Risk Warning: the result of previous trading operations do not guarantee the same results in the future

AUDUSD, “Australian Dollar vs US Dollar”

AUDUSD has completed the descending wave at 0.7117. Possibly, today the pair may correct towards 0.7212 and then resume trading within the downtrend with the target at 0.7000.

AUDUSD
Risk Warning: the result of previous trading operations do not guarantee the same results in the future

BRENT

Brent is still consolidating around 66.16 Today, the asset is expected to grow towards 67.27 and then fall to test 66.16 from above. If later the price breaks this range to the upside, the market may resume growing with the target at 69.40; if to the downside – start a new decline towards 64.50.

BRENT
Risk Warning: the result of previous trading operations do not guarantee the same results in the future

XAUUSD, “Gold vs US Dollar”

Gold is still consolidating around 1784.00 without any particular direction. Possibly, today the metal may start another decline falling towards 1722.22 and then form one more ascending structure with the target at 1819.00.

GOLD
Risk Warning: the result of previous trading operations do not guarantee the same results in the future

S&P 500

After finishing the ascending structure at 4435.5 and forming a narrow consolidation range around this level, the S&P index has broken it to the upside due to the gap; right now, it is trading according to an alternative scenario towards 4494.3 and extending the ascending structure up to 4517.0. After that, the instrument may form a new descending structure to break 4377.0 and then continue falling with the target at 4300.0

S&P 500

Article By RoboForex.com

Attention!
Forecasts presented in this section only reflect the author’s private opinion and should not be considered as guidance for trading. RoboForex LP bears no responsibility for trading results based on trading recommendations described in these analytical reviews.

USDCAD Bears Target The 1.2012 Low

By Orbex

The USDCAD pair shows the initial part of a double zigzag of a cycle degree.

The last section of the chart shows the final part of the first actionary wave w. Most likely, it is a triple zigzag consisting of primary sub-waves Ⓦ-Ⓧ-Ⓨ-Ⓧ-Ⓩ. The final actionary sub-wave Ⓩ of this pattern is under development.

The last intermediate wave (C) in the form of a simple impulse is currently being formed as part of the sub-wave Ⓩ. The minute fourth correction in the form of a minuette double zigzag has come to an end, this is a signal for a decline in the minute fifth wave.

Most likely, the market will update the previous low, and finish the cycle wave w below the level of 1..2012

USDCAD

Let’s consider the second scenario of the USDCAD currency pair. In this view, the market moves in an upward direction, building a cycle intervening wave x.

It is quite likely that the intervening wave x takes the form of a primary simple zigzag Ⓐ-Ⓑ-Ⓒ.

The primary impulse Ⓐ and the zigzag correction Ⓑ have ended.

In the short term, a movement in the primary impulse Ⓒ is likely in the direction of the level of 1.3215, where the primary waves Ⓐ and Ⓒ will be equal.

By Orbex

Intraday Market Analysis – GBP Attempts Rebound

By Orbex

GBPUSD tests critical support

GBPUSD

The pound drifted lower after Britain’s retail sales figures fell in July. The pair has given up all its gains from late July and is testing the critical support at 1.3600 from the daily chart.

A diverging RSI suggests a slowdown in the downward impetus. Its oversold situation may have attracted buying interest in the demand zone. 1.3770 would be the first target in case of a rebound.

Otherwise, a bearish breakout would trigger a new round of sell-off towards 1.3460 as those who bought the dip reverse gears.

USDCAD clears previous peak

USDCAD

The Canadian dollar tanked after last month’s retail sales failed to impress. The greenback saw increased momentum after it rallied above July’s peak at 1.2800.

The breakout can be a confirmation of a bullish reversal for the weeks to come. A pullback is necessary to let the bulls catch their breath.

An overbought RSI has swung towards the oversold territory. 1.2750 near the previous high is now the immediate support. A rebound would challenge the psychological level of 1.3000.

GER 30 breaks bullish trendline

DAX30

The Dax 30 retreats as investors grow wary of the recovery’s momentum.

The index had only briefly held onto the 16000 milestone. The break below the rising trendline has put a halt to a month-long rally.

The current consolidation is a sign of indecision after a round of liquidation. An oversold RSI has prompted traders to buy the dip near 15600.

The rally may only resume if the bulls succeed in lifting offers around 15970. Failing that, price action could be vulnerable below 15600.

By Orbex

The Analytical Overview of the Main Currency Pairs on 2021.08.23

by JustForex

The EUR/USD currency pair

Technical indicators of the currency pair:
  • Prev Open: 1.1674
  • Prev Close: 1.1700
  • % chg. over the last day: +0.22%

The decrease in the dollar index has led to a slight increase in the quotes of the EUR/USD currency pair. A lot will now depend on the performance of the dollar index and the decisions of the Federal Reserve. If the soft monetary policy remains unchanged until the end of the year, the Euro might get much stronger in the near future. A lot of macroeconomic statistics on European countries will be published today.

Trading recommendations
  • Support levels: 1.1704, 1.1620
  • Resistance levels: 1.1759, 1.1799, 1.1817, 1.1854, 1.1894, 1.1934, 1.1969

From a technical point of view, the general trend in the EUR/USD currency pair is bearish. The price has consolidated above the support level and formed a false breakdown zone below. Taking into account the divergence on the MACD indicator on the higher timeframes, the buyers’ pressure is higher now. Under such market conditions, it is best to look for sell trades from the resistance levels, where sellers showed the initiative. Buy trades can only be considered intraday from the support levels where the buyers have shown the initiative.

Alternative scenario: if the price breaks through the 1.1817 resistance level and fixes above, the mid-term uptrend will likely resume.

EUR/USD
News feed for 2021.08.23:
  • – France Manufacturing PMI (m/m) at 10:15 (GMT+3);
  • – Germany Manufacturing PMI (m/m) at 10:30 (GMT+3);
  • – Eurozone Manufacturing PMI (m/m) at 11:00 (GMT+3);
  • – Eurozone Services PMI (m/m) at 11:00 (GMT+3);
  • – US Manufacturing PMI (m/m) at 16:45 (GMT+3);
  • – US Services PMI (m/m) at 16:45 (GMT+3);
  • – US Existing Home Sales (m/m) at 17:00 (GMT+3).

The GBP/USD currency pair

Technical indicators of the currency pair:
  • Prev Open: 1.3636
  • Prev Close: 1.3617
  • % chg. over the last day: -0.14%

UK retail sales fell by 2.5% in July compared to the previous month, which caused short-term sales in the GBP/USD currency pair. On the other hand, the UK government borrowing almost halved to 10.4 billion pounds in July compared to the same month a year ago. Given a temporary increase in oil prices and a decline in the dollar index, it boosted the British currency at the opening of trading on Monday.

Trading recommendations
  • Support levels: 1.3632, 1.3614, 1.3525
  • Resistance levels: 1.3714, 1.3793, 1.3772, 1.3886, 1.3935, 1.4002

On the hourly time frame, the GBP/USD trend is bearish. The price has consolidated above the support level and formed a false breakdown zone below. The MACD indicator shows a divergence. Under such market conditions, it is better to look for sell trades from the resistance levels. But the price is now strongly deviated from the moving average, and given the presence of support and the divergence, there is a high probability of a bounce upward.

Alternative scenario: if the price breaks out through the 1.3885 resistance level and consolidates above, the bullish scenario will likely resume.

GBP/USD
News feed for 2021.08.23:
  • – UK Manufacturing PMI (m/m) at 11:30 (GMT+3);
  • – UK Services PMI (m/m) at 11:30 (GMT+3).

The USD/JPY currency pair

Technical indicators of the currency pair:
  • Prev Open: 109.68
  • Prev Close: 109.77
  • % chg. over the last day: +0.08%

Growth in manufacturing activity in Japan has slowed, while the services sector has seen its fastest contraction since last May. Such negative statistics are related to the consequences of introducing a state of emergency in the country’s prefectures to suppress the Delta strain. Japan’s economic indicators for the third quarter will be weak.

Trading recommendations
  • Support levels: 109.43, 109.19, 108.65
  • Resistance levels: 110.04, 110.34, 110.66, 110.95, 111.48

The main trend on the USD/JPY currency pair is bullish. The fall of the dollar index compensated for the negative impact of the news on the Japanese Yen. As a result, the USD/JPY currency pair is trading flat. The MACD indicator has become inactive. Under such market conditions, it is best for traders to look for buy trades from the support level, where the buyers have shown initiative. Sell positions should be considered only on lower timeframes from the resistance levels and only with short targets.

Alternative scenario: if the price falls below 109.18, the uptrend is likely to be broken.

USD/JPY
News feed for 2021.08.23:
  • – Japan Manufacturing PMI (m/m) at 03:30 (GMT+3).

The USD/CAD currency pair

Technical indicators of the currency pair:
  • Prev Open: 1.2823
  • Prev Close: 1.2820
  • % chg. over the last day: -0.02%

The USD/CAD currency pair is highly dependent on the dynamics of the dollar index and oil prices. The dollar index started to correct while the oil prices slightly increased, which caused the strengthening of the Canadian dollar and a decrease in the USD/CAD quotes.

Trading recommendations
  • Support levels: 1.2767, 1.2698, 1.2656
  • Resistance levels: 1.2885, 1.2951

In terms of technical analysis, the USD/CAD trend is bullish. But now, the price has started a corrective movement. Buy positions should be considered from the support levels after the buyers’ initiative. Sell positions should be considered only from the resistance levels and only with short targets, as it will be trading against the main trend.

Alternative scenario: if the price breaks through down the 1.2602 support level and fixes below, the uptrend is likely to be broken.

USD/CAD
There is no news feed for today.

by JustForex


This article reflects a personal opinion and should not be interpreted as an investment advice, and/or offer, and/or a persistent request for carrying out financial transactions, and/or a guarantee, and/or a forecast of future events.

Jackson Hole symposium shifts to an online format; Dollar index bounces from 9-month high

by JustForex

Major US stock indices closed Friday in green territory. The S&P 500 index increased by 0.8%, the Dow Jones index increased by 0.65%, and the Nasdaq added 1.2%. NVIDIA, MSFT, and CSCO stock prices made new all-time highs. But that did little to make up for the week’s losses. By the end of the week, the Dow and S&P 500 decreased by 1.1% and 0.6%, respectively, and the Nasdaq technology index fell by 0.7%. The main event of the coming week will be the annual symposium of the world’s central banks’ heads in Jackson Hole, where signals concerning the plans of the Federal Reserve’s monetary policy are expected. On the one hand, last week, the FOMC minutes showed that the Fed was not planning to cut the QE program until September 22. On the other hand, hedge funds and well-known private investors are reducing the shares of companies in their portfolios, so the probability that Mr. Powell will announce the start of monetary policy tightening still exists. It also became known that the growing number of COVID-19 cases prompted the Federal Reserve to shift its annual symposium in Jackson Hole to an online format.

US Treasury Secretary Janet Yellen told senior White House advisers that she supports the reappointment of Jerome Powell as chairman of the US Federal Reserve, whose term expires in February. The White House has not yet commented on this issue, but the Biden administration is inclined to nominate another candidate according to preliminary information.

European stock indexes closed in the green zone on Friday. The British FTSE 100 increased by 0.4%, the French CAC 40 gained 0.3%, the German DAX added 0.3%, and the Spanish IBEX 35 added 0.15%. By the end of the week, the FTSE 100 fell by 1.8%, the DAX index decreased by 1.1%, the CAC 40 lost 3.9%, and the IBEX 35 lost 0.9%. Shares of European automakers fell after Volkswagen said it would cut production at its main plant due to a chip shortage. Analysts estimate that the global semiconductor shortage will lead to a 6.3-7.1 million reduction in car output this year, and supply chain disruptions caused by the COVID-19 pandemic will affect the auto industry next year as well.

WTI crude oil prices decreased by 2.55% on Friday, while Brent crude lost 2.15%. By the end of last week, WTI decreased by 8.9%, and Brent decreased by 7.7%. The oil market is still under the pressure of the global spread of Delta and, as a consequence, a decrease in demand for fuel.

The gold situation remains unchanged. As long as the Fed maintains a soft monetary policy, quotes of precious metals will rise. But any hints on the reduction of the QE program will cause a sharp fall in these instruments. A lot will depend on the economic symposium results in Jackson Hole later this week.

The shares of Chinese IT giants are going down as China has passed a new data privacy law that is considered one of the strictest in the world in terms of requirements for companies that collect user data. Another reason is the ongoing trade war between the US and China. Container prices between the US and China have skyrocketed, which will undoubtedly be reflected in higher prices for goods from China. At the same time, the Chinese authorities were able to contain the wave of the Delta strain: no new cases of infection were detected in the country on August 23. As a result, Asian stock indexes slightly increased at the opening on Monday. However, the situation with the epidemic in other Asian countries is only getting worse.

Main market quotes:

S&P 500 (F) 4,441.67 +35.87 (+0.81%)

Dow Jones 35,120.08 +225.96 (+0.65%)

DAX 15,808.04 +42.23 (+0.27%)

FTSE 100 7,087.90 +29.04 (+0.41%)

USD Index 93.46 -0.11 (-0.12%)

Important events for today:
  • – Australia Manufacturing PMI (m/m) at 02:00 (GMT+3);
  • – Japan Manufacturing PMI (m/m) at 03:30 (GMT+3);
  • – Singapore Consumer Price Index (m/m) at 08:00 (GMT+3);
  • – France Manufacturing PMI (m/m) at 10:15 (GMT+3);
  • – Germany Manufacturing PMI (m/m) at 10:30 (GMT+3);
  • – Eurozone Manufacturing PMI (m/m) at 11:00 (GMT+3);
  • – Eurozone Services PMI (m/m) at 11:00 (GMT+3);
  • – UK Manufacturing PMI (m/m) at 11:30 (GMT+3);
  • – UK Services PMI (m/m) at 11:30 (GMT+3);
  • – US Manufacturing PMI (m/m) at 16:45 (GMT+3);
  • – US Services PMI (m/m) at 16:45 (GMT+3);
  • – US Existing Home Sales (m/m) at 17:00 (GMT+3).

by JustForex


This article reflects a personal opinion and should not be interpreted as an investment advice, and/or offer, and/or a persistent request for carrying out financial transactions, and/or a guarantee, and/or a forecast of future events.

The dollar index continues to rise during the summer

By Admiral Markets

As we commented in our previous analysis of the Forex market, during the first half of the year, the trend in the dollar index was positive, scoring 2.822% and at the moment it seems that this strength is being maintained during the summer months, since since the beginning of last June, the dollar index is experiencing a strong upward trend that has taken it from its support around $90 to an area close to $93.70, thus surpassing the previous annual high at $93.43.

Attention in the foreign exchange market remains focused on possible measures and changes that the Federal Reserve may undertake in the coming months to deal with rising inflation in the United States brought about by the economic recovery and consumption growth thanks to the advanced vaccination process, since a change in policies and an eventual rise in interest rates could boost the dollar.

EURUSD Analysis

After a positive year 2020, the year 2021 is leaving a bitter taste in the EURUSD after during the first half of this lost 2.93% against the dollar due to the recovery that the greenback is experiencing as we have mentioned previously.

So far this summer, the trend remains negative and at the moment shows no signs of recovery in the short term, because if as expected finally the Federal Reserve begins to take measures such as raising interest rates or reducing its asset purchase program thus reducing liquidity,  the dollar can continue to be one of the main beneficiaries thus increasing the downtrend in this pair.

Technically speaking, if we look at the daily chart we can see that EURUSD slowed at the 1.2240 level forming a double a double ceiling (green) which has caused the price to lose several support levels including the uptrend line, the support and resistance zone represented by the orange band and its 200-session moving average.

This bearish move has also caused the so-called death crossover by making a triple bearish crossover of its short, medium and long term moving averages (white, orange and red) thus confirming the change from uptrend to bearish.

Despite the accumulated oversold that we can observe in its stochastic indicator, it seems that the price could head to its next support level represented by the lower red band.

This is an important point and we will have to see if the price is able to maintain this important level and make a upward rebound in search of its 18-session moving average (white) or even its important resistance support zone in the orange band. Therefore, we must be aware of the evolution of the price in this area, since a failure in this possible rebound or the loss of this important level of support, would open the doors to a further correction to levels close to $1.14 per euro.

Source: Daily EURUSD chart of Admiral Markets MetaTrader 5 platform from April 22, 2020 to August 23, 2021. Held on August 23 at 12:00 pm CEST. Please note that past returns do not guarantee future returns.


Evolution of the last 5 years:

  1. 2020 = 8.93%
  2. 2019 = -2.21%
  3. 2018 = -4.47%
  4. 2017 = 14.09%
  5. 2016 = -3.21%

GBPUSD analysis

In the case of GBPUSD, we can see that although during the first half of the year it has risen by 1.12%, since it marked annual highs at the end of last May, it is experiencing a strong decline that has led it to fall from an area above $1.42 dollars to a level close to $1.36.

As we can see on the weekly chart, the price has faced several times its important level of resistance represented by the green band that joins the highs of 2018 and this year 2021 but has not been able to overcome this level.

After its last failed attempt, the price has made a strong correction that has led it to make a bearish cross of its short and medium-term moving averages respectively in search of its resistance support level in the orange band.

If the price finally reaches this level, we will have to be very attentive to the behavior, since the bearish breakout of this level would open the door to a possible change of trend from upside to bearish pending confirmation of the confrontation between the price and its 200-week moving average in the red that acts as the main support. The loss of this moving average would open the door to a further correction in search of $1.30 per pound.

Source: Weekly chart of GBPUSD on Admiral Markets MetaTrader 5 platform from January 11, 2015 to August 23, 2021. Held on August 23 at 12:10 p.m. CEST. Please note that past returns do not guarantee future returns.


Evolution of the last 5 years:

  1. 2020 = 3.10%
  2. 2019 = 3.95%
  3. 2018 = -5.54%
  4. 2017 = 9.43%
  5. 2016 = -16.26%

USDJPY Analysis

Finally, if we look at USDJPY, we can see how the Japanese Yen was one of the big losers with the rises of the dollar since during the first half of the year this has lost 7.61% against the dollar thanks to the strong rises in February and March since it went from trading at levels close to 102,700 to trading at levels close to 111,000.

During this summer, we can observe a fairly lateral movement in the price action between its resistance level represented by the green band and its average of 18 weeks in blank possibly due to the accumulated overbought and the negative divergence that we could find in the past in its stochastic indicator.

Technically speaking, we will have to be very attentive to the evolution of the quote in the coming weeks, since if the price manages to overcome this level of resistance, we could find a bullish rally in search of the upper band of the side channel in green. Conversely, the downside breakout of its 18-session moving average could show strength in the Yen which could seek its next support level in the coincident zone of its 40- and 200-week averages in orange and red respectively.

Source: Weekly chart of USDJPY on Admiral Markets’ MetaTrader 5 platform from January 11, 2015 to August 23, 2021. Held on August 23 at 12:25 p.m. CEST. Please note that past returns do not guarantee future returns.


Evolution of the last 5 years:

  1. 2020 = -4.95%
  2. 2019 = -0.88%
  3. 2018 = -2.76%
  4. 2017 = -3.59%
  5. 2016 = -2.85%


Did you know that you can use the Trading Central Technical Ideas Lookup indicator to find actionable trading ideas on thousands of different markets?

Start your free download by clicking on the banner below:

Download MetaTrader 5 Supreme Edition

INFORMATION ABOUT ANALYTICAL MATERIALS:

The given data provides additional information regarding all analysis, estimates, prognosis, forecasts, market reviews, weekly outlooks or other similar assessments or information (hereinafter “Analysis”) published on the websites of Admiral Markets investment firms operating under the Admiral Markets trademark (hereinafter “Admiral Markets”) Before making any investment decisions please pay close attention to the following:

  1. This is a marketing communication. The content is published for informative purposes only and is in no way to be construed as investment advice or recommendation. It has not been prepared in accordance with legal requirements designed to promote the independence of investment research, and that it is not subject to any prohibition on dealing ahead of the dissemination of investment research.
  2. Any investment decision is made by each client alone whereas Admiral Markets shall not be responsible for any loss or damage arising from any such decision, whether or not based on the content.
  3. With view to protecting the interests of our clients and the objectivity of the Analysis, Admiral Markets has established relevant internal procedures for prevention and management of conflicts of interest.
  4. The Analysis is prepared by an independent analyst, Roberto Rojas (analyst), (hereinafter “Author”) based on their personal estimations.
  5. Whilst every reasonable effort is taken to ensure that all sources of the content are reliable and that all information is presented, as much as possible, in an understandable, timely, precise and complete manner, Admiral Markets does not guarantee the accuracy or completeness of any information contained within the Analysis.
  6. Any kind of past or modeled performance of financial instruments indicated within the content should not be construed as an express or implied promise, guarantee or implication by Admiral Markets for any future performance. The value of the financial instrument may both increase and decrease and the preservation of the asset value is not guaranteed.
  7. Leveraged products (including contracts for difference) are speculative in nature and may result in losses or profit. Before you start trading, please ensure that you fully understand the risks involved.
Avatar-Admirals
Admirals

An all-in-one solution for spending, investing, and managing your moneyMore than a broker, Admirals is a financial hub, offering a wide range of financial products and services. We make it possible to approach personal finance through an all-in-one solution for investing, spending, and managing money.

By Admiral Markets

COT Currency Futures Charts: Dollars, Euro, Yen, Pound, Kiwi, Loonie, Peso

By CountingPips.com COT Home | Data Tables | Data Downloads | Newsletter

Here are the latest charts and statistics for the Commitment of Traders (COT) data published by the Commodities Futures Trading Commission (CFTC).

The latest COT data is updated through Tuesday August 17 2021 and shows a quick view of how large traders (for-profit speculators and commercial entities) were positioned in the futures markets. All currency positions are in direct relation to the US dollar where, for example, a bet for the euro is a bet that the euro will rise versus the dollar while a bet against the euro will be a bet that the euro will decline versus the dollar.


US Dollar Index Futures:

Federal Funds 30-Day Bonds Futures COT Chart
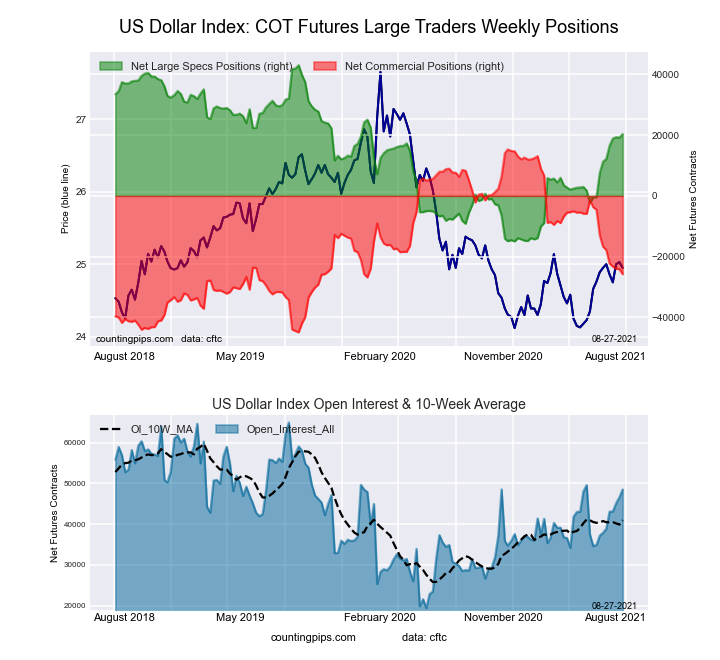
The US Dollar Index large speculator standing this week was a net position of 19,211 contracts in the data reported through Tuesday. This was a weekly reduction of -115 contracts from the previous week which had a total of 19,326 net contracts.

This week’s current strength score (the trader positioning range over the past three years, measured from 0 to 100) shows the speculators are currently Bullish with a score of 58.9 percent. The commercials are Bearish with a score of 34.6 percent and the small traders (not shown in chart) are Bullish-Extreme with a score of 83.3 percent.

US DOLLAR INDEX StatisticsSPECULATORSCOMMERCIALSSMALL TRADERS
– Percent of Open Interest Longs:76.13.515.1
– Percent of Open Interest Shorts:34.955.24.6
– Net Position:19,211-24,0894,878
– Gross Longs:35,4601,6437,014
– Gross Shorts:16,24925,7322,136
– Long to Short Ratio:2.2 to 10.1 to 13.3 to 1
NET POSITION TREND:
– COT Index Score (3 Year Range Pct):58.934.683.3
– COT Index Reading (3 Year Range):BullishBearishBullish-Extreme
NET POSITION MOVEMENT INDEX:
– 6-Week Change in Strength Index:20.1-18.4-7.5


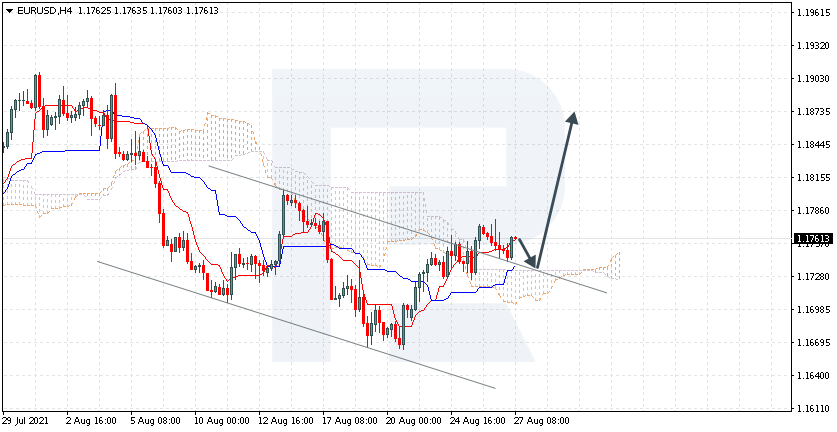
Euro Currency Futures:

2-Year Treasury Bonds Futures COT Chart
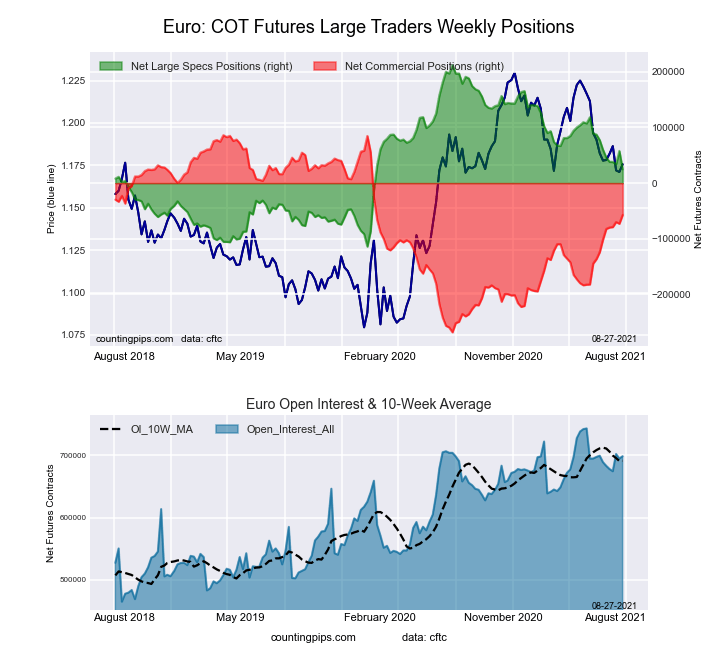
The Euro Currency large speculator standing this week was a net position of 57,640 contracts in the data reported through Tuesday. This was a weekly increase of 23,783 contracts from the previous week which had a total of 33,857 net contracts.

This week’s current strength score (the trader positioning range over the past three years, measured from 0 to 100) shows the speculators are currently Bullish with a score of 52.7 percent. The commercials are Bullish with a score of 55.1 percent and the small traders (not shown in chart) are Bearish-Extreme with a score of 4.4 percent.

EURO Currency StatisticsSPECULATORSCOMMERCIALSSMALL TRADERS
– Percent of Open Interest Longs:33.655.210.1
– Percent of Open Interest Shorts:25.365.77.9
– Net Position:57,640-73,08315,443
– Gross Longs:233,529383,68470,047
– Gross Shorts:175,889456,76754,604
– Long to Short Ratio:1.3 to 10.8 to 11.3 to 1
NET POSITION TREND:
– COT Index Score (3 Year Range Pct):52.755.14.4
– COT Index Reading (3 Year Range):BullishBullishBearish-Extreme
NET POSITION MOVEMENT INDEX:
– 6-Week Change in Strength Index:-6.014.4-49.9


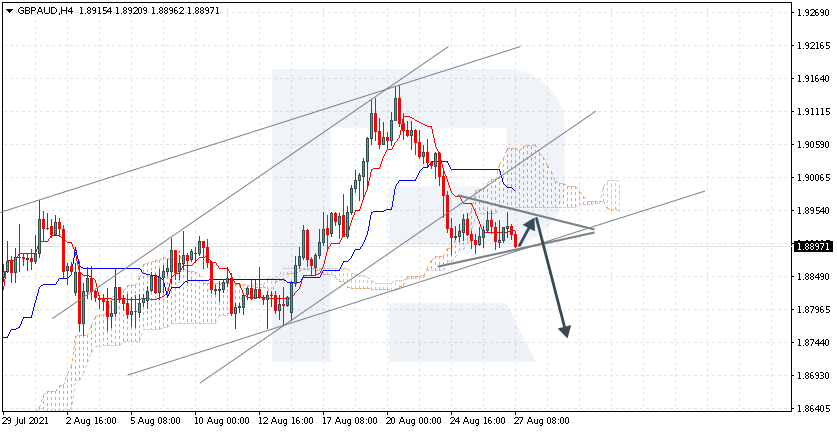
British Pound Sterling Futures:

5-Year Treasury Bonds Futures COT Chart
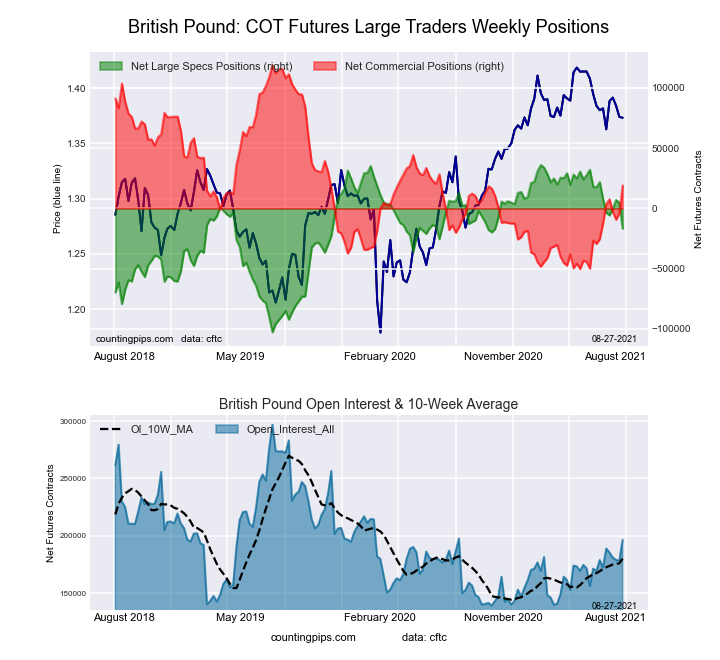
The British Pound Sterling large speculator standing this week was a net position of 4,651 contracts in the data reported through Tuesday. This was a weekly fall of -2,419 contracts from the previous week which had a total of 7,070 net contracts.

This week’s current strength score (the trader positioning range over the past three years, measured from 0 to 100) shows the speculators are currently Bullish with a score of 77.4 percent. The commercials are Bearish with a score of 27.3 percent and the small traders (not shown in chart) are Bullish with a score of 54.4 percent.

BRITISH POUND StatisticsSPECULATORSCOMMERCIALSSMALL TRADERS
– Percent of Open Interest Longs:23.558.116.2
– Percent of Open Interest Shorts:20.960.416.6
– Net Position:4,651-4,054-597
– Gross Longs:41,898103,66728,967
– Gross Shorts:37,247107,72129,564
– Long to Short Ratio:1.1 to 11.0 to 11.0 to 1
NET POSITION TREND:
– COT Index Score (3 Year Range Pct):77.427.354.4
– COT Index Reading (3 Year Range):BullishBearishBullish
NET POSITION MOVEMENT INDEX:
– 6-Week Change in Strength Index:-12.412.6-8.6


Japanese Yen Futures:

10-Year Treasury Notes Bonds Futures COT Chart
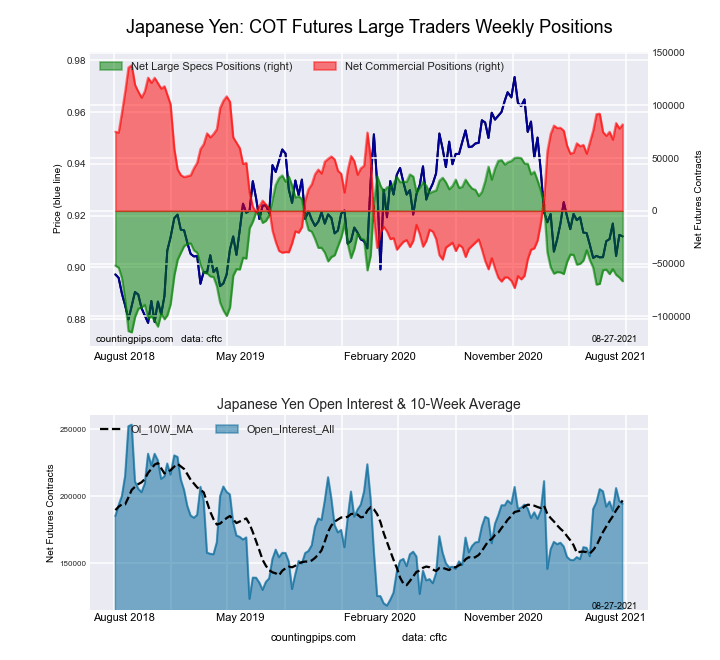
The Japanese Yen large speculator standing this week was a net position of -63,208 contracts in the data reported through Tuesday. This was a weekly reduction of -2,551 contracts from the previous week which had a total of -60,657 net contracts.

This week’s current strength score (the trader positioning range over the past three years, measured from 0 to 100) shows the speculators are currently Bearish with a score of 31.4 percent. The commercials are Bullish with a score of 71.6 percent and the small traders (not shown in chart) are Bearish with a score of 27.8 percent.

JAPANESE YEN StatisticsSPECULATORSCOMMERCIALSSMALL TRADERS
– Percent of Open Interest Longs:14.075.010.3
– Percent of Open Interest Shorts:46.235.317.8
– Net Position:-63,20878,091-14,883
– Gross Longs:27,532147,40320,156
– Gross Shorts:90,74069,31235,039
– Long to Short Ratio:0.3 to 12.1 to 10.6 to 1
NET POSITION TREND:
– COT Index Score (3 Year Range Pct):31.471.627.8
– COT Index Reading (3 Year Range):BearishBullishBearish
NET POSITION MOVEMENT INDEX:
– 6-Week Change in Strength Index:3.6-6.615.5


Swiss Franc Futures:

Ultra 10-Year Treasury Notes Bonds Futures COT Chart
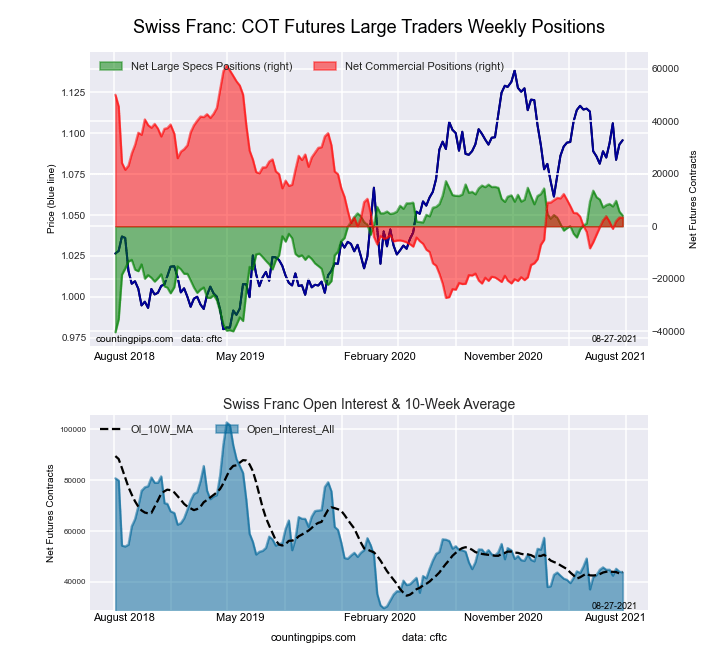
The Swiss Franc large speculator standing this week was a net position of 5,547 contracts in the data reported through Tuesday. This was a weekly fall of -4,131 contracts from the previous week which had a total of 9,678 net contracts.

This week’s current strength score (the trader positioning range over the past three years, measured from 0 to 100) shows the speculators are currently Bullish-Extreme with a score of 81.2 percent. The commercials are Bearish with a score of 34.5 percent and the small traders (not shown in chart) are Bearish with a score of 37.4 percent.

SWISS FRANC StatisticsSPECULATORSCOMMERCIALSSMALL TRADERS
– Percent of Open Interest Longs:32.643.723.3
– Percent of Open Interest Shorts:20.036.243.4
– Net Position:5,5473,277-8,824
– Gross Longs:14,35419,21110,255
– Gross Shorts:8,80715,93419,079
– Long to Short Ratio:1.6 to 11.2 to 10.5 to 1
NET POSITION TREND:
– COT Index Score (3 Year Range Pct):81.234.537.4
– COT Index Reading (3 Year Range):Bullish-ExtremeBearishBearish
NET POSITION MOVEMENT INDEX:
– 6-Week Change in Strength Index:-7.54.22.6


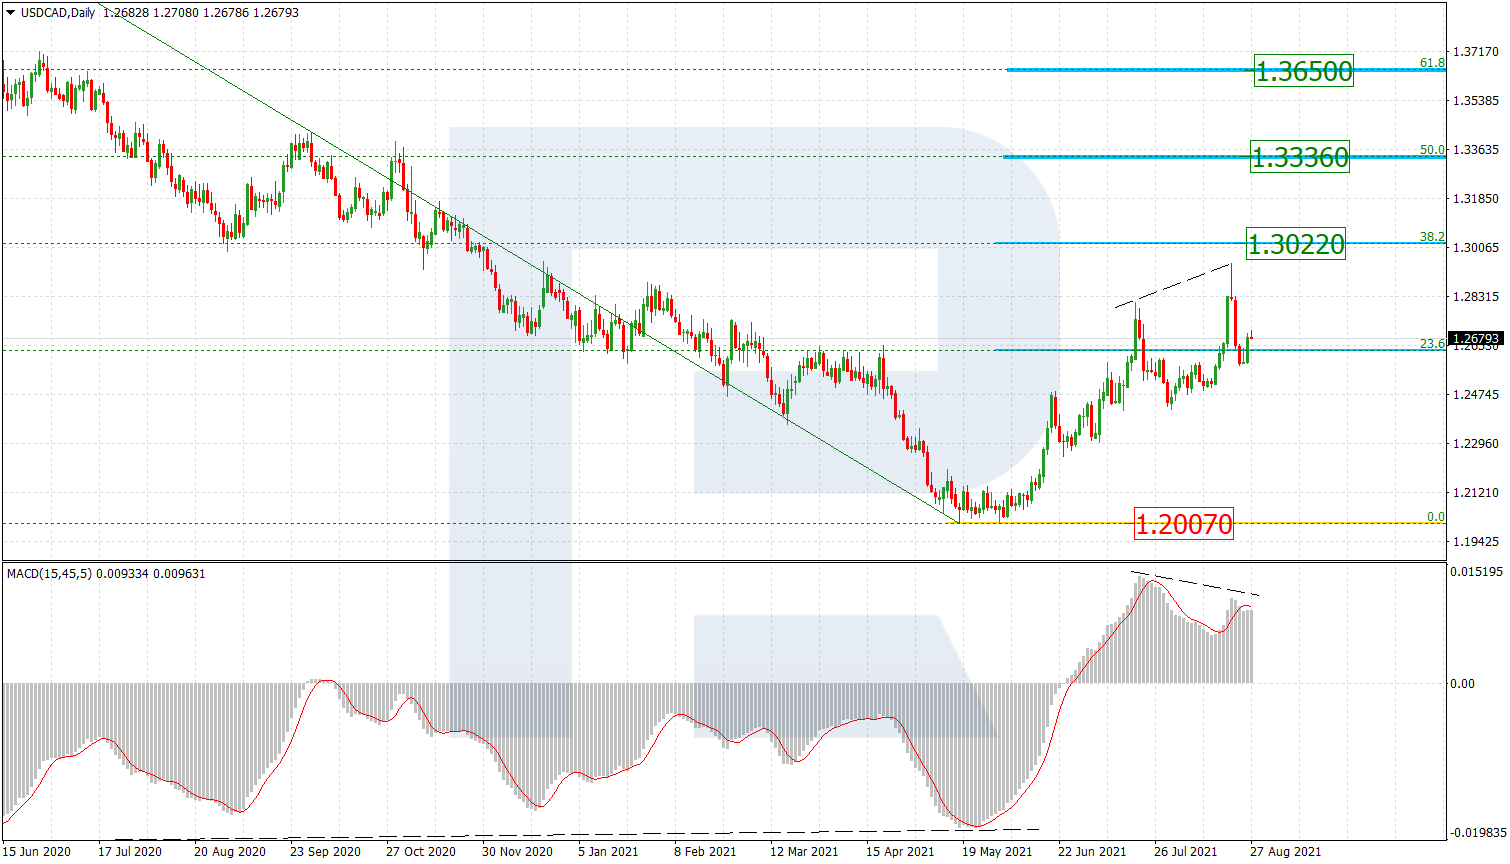
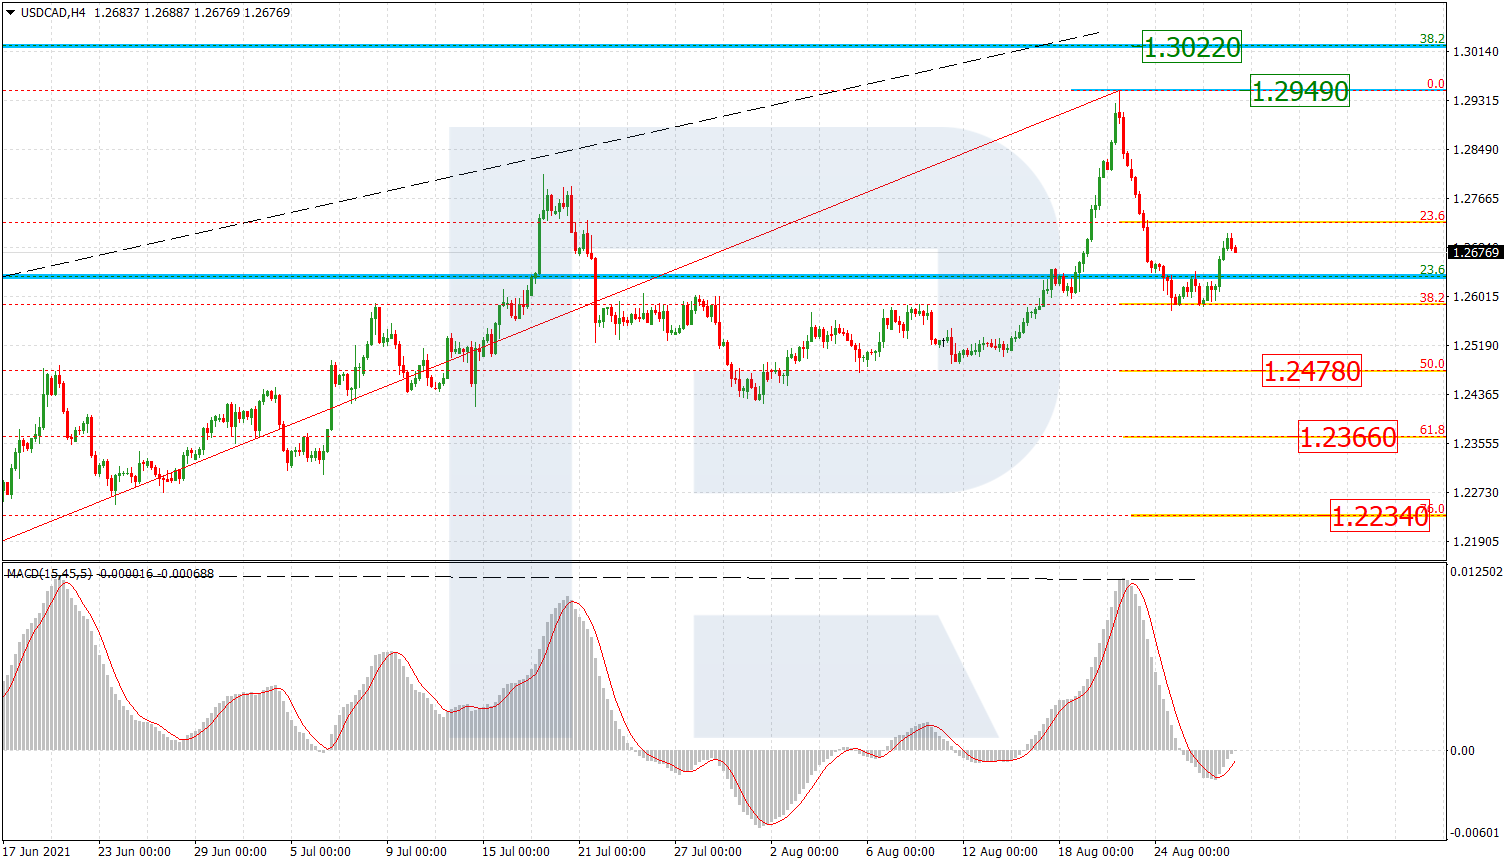
Canadian Dollar Futures:

US Year Treasury Notes Long Bonds Futures COT Chart
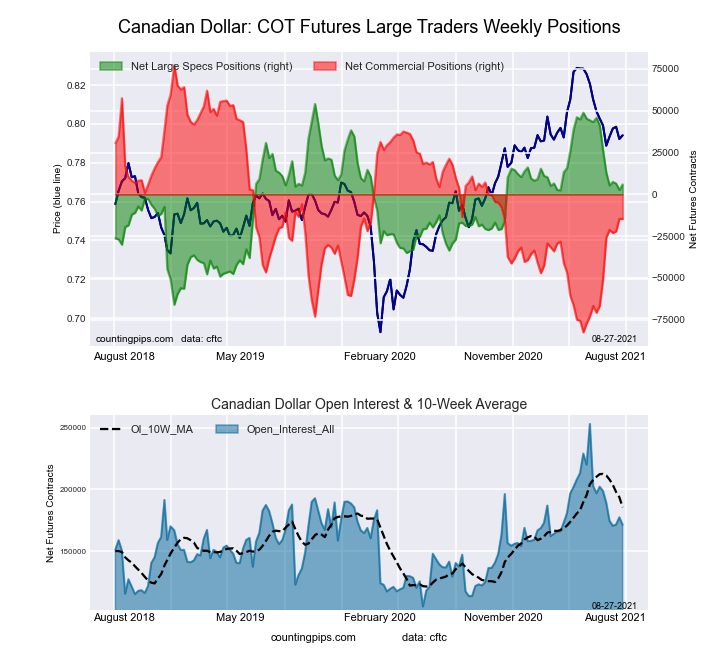
The Canadian Dollar large speculator standing this week was a net position of 2,660 contracts in the data reported through Tuesday. This was a weekly reduction of -3,805 contracts from the previous week which had a total of 6,465 net contracts.

This week’s current strength score (the trader positioning range over the past three years, measured from 0 to 100) shows the speculators are currently Bullish with a score of 57.2 percent. The commercials are Bearish with a score of 42.5 percent and the small traders (not shown in chart) are Bullish with a score of 64.9 percent.

CANADIAN DOLLAR StatisticsSPECULATORSCOMMERCIALSSMALL TRADERS
– Percent of Open Interest Longs:26.252.520.3
– Percent of Open Interest Shorts:24.760.813.6
– Net Position:2,660-14,64211,982
– Gross Longs:46,49993,23436,107
– Gross Shorts:43,839107,87624,125
– Long to Short Ratio:1.1 to 10.9 to 11.5 to 1
NET POSITION TREND:
– COT Index Score (3 Year Range Pct):57.242.564.9
– COT Index Reading (3 Year Range):BullishBearishBullish
NET POSITION MOVEMENT INDEX:
– 6-Week Change in Strength Index:-32.132.6-20.4


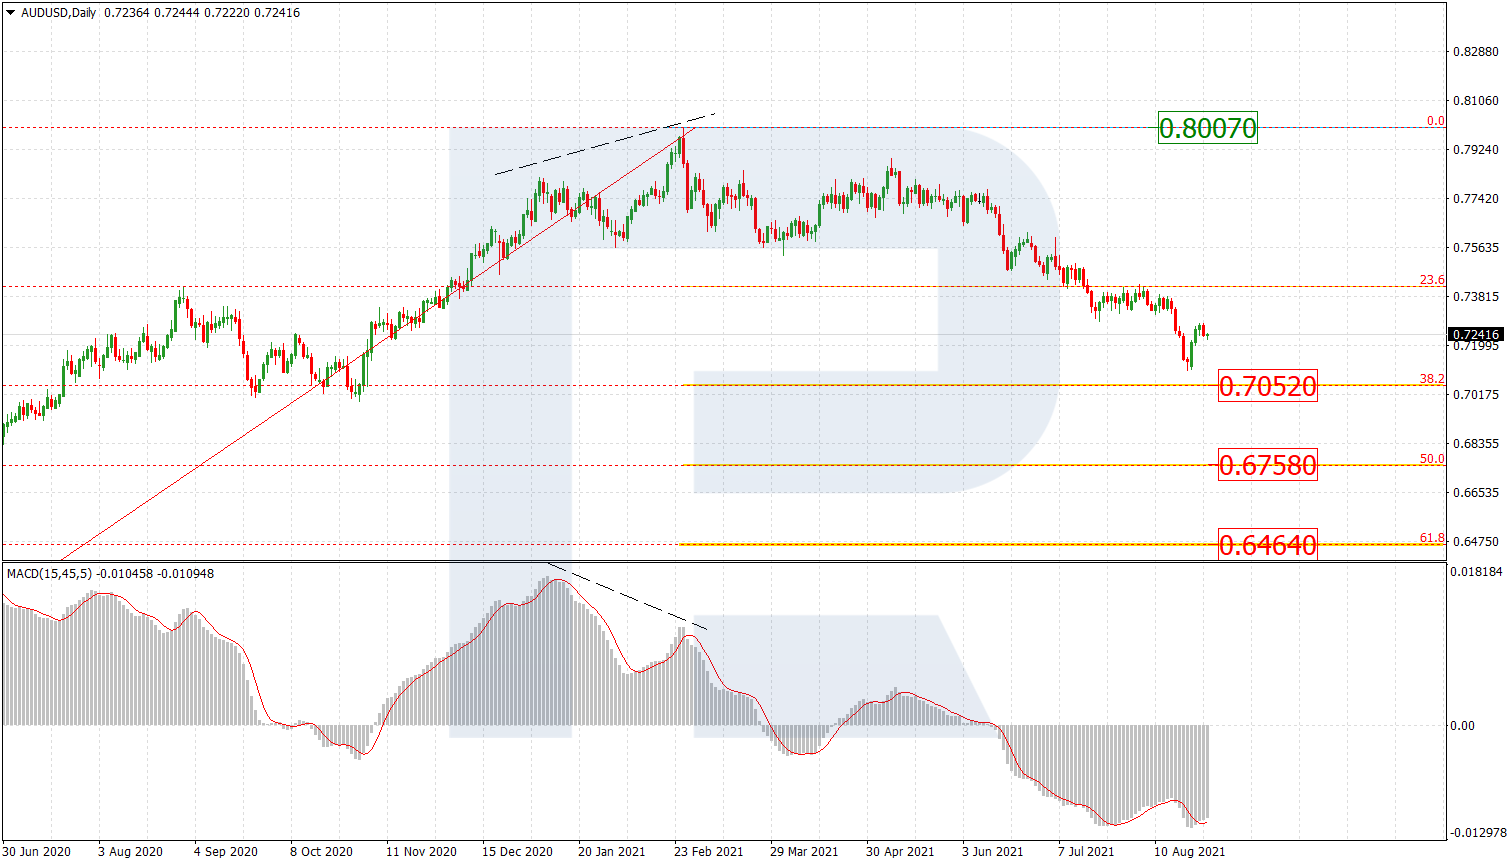
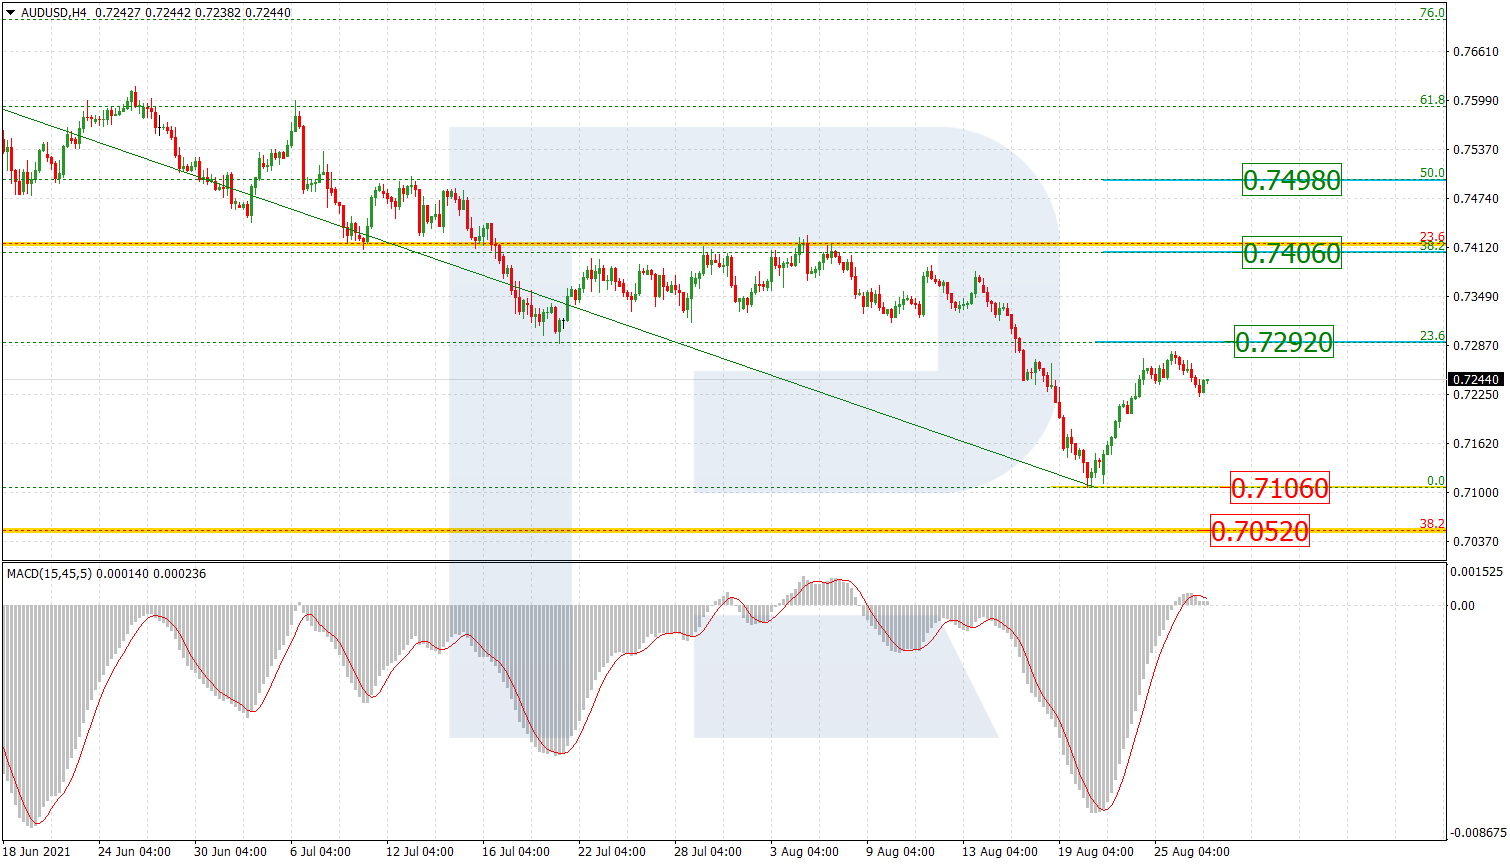
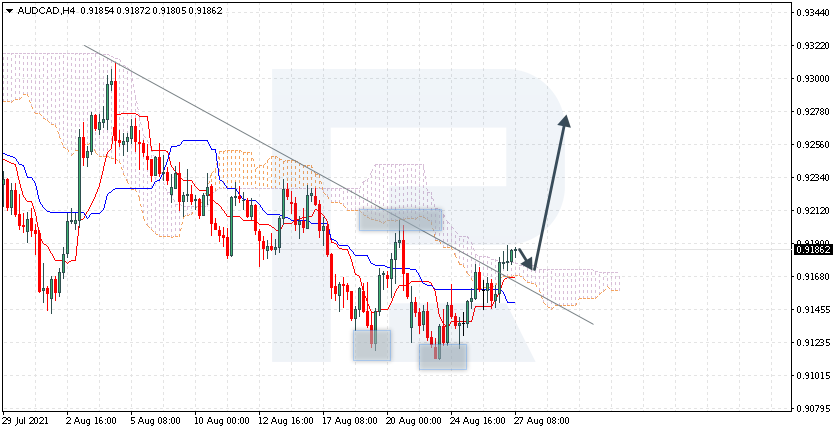
Australian Dollar Futures:

Ultra US Year Treasury Notes Long Bonds Futures COT Chart
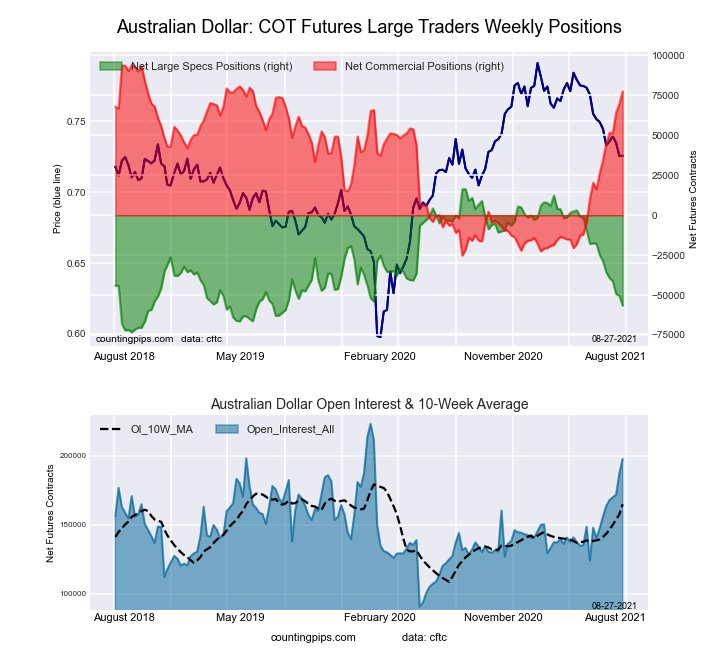
The Australian Dollar large speculator standing this week was a net position of -50,367 contracts in the data reported through Tuesday. This was a weekly lowering of -1,054 contracts from the previous week which had a total of -49,313 net contracts.

This week’s current strength score (the trader positioning range over the past three years, measured from 0 to 100) shows the speculators are currently Bearish with a score of 25.6 percent. The commercials are Bullish with a score of 79.7 percent and the small traders (not shown in chart) are Bearish-Extreme with a score of 14.2 percent.

AUSTRALIAN DOLLAR StatisticsSPECULATORSCOMMERCIALSSMALL TRADERS
– Percent of Open Interest Longs:34.354.49.2
– Percent of Open Interest Shorts:61.317.119.6
– Net Position:-50,36769,709-19,342
– Gross Longs:64,169101,69417,213
– Gross Shorts:114,53631,98536,555
– Long to Short Ratio:0.6 to 13.2 to 10.5 to 1
NET POSITION TREND:
– COT Index Score (3 Year Range Pct):25.679.714.2
– COT Index Reading (3 Year Range):BearishBullishBearish-Extreme
NET POSITION MOVEMENT INDEX:
– 6-Week Change in Strength Index:-28.436.3-39.1


New Zealand Dollar Futures:

Eurodollar Bonds Futures COT Chart
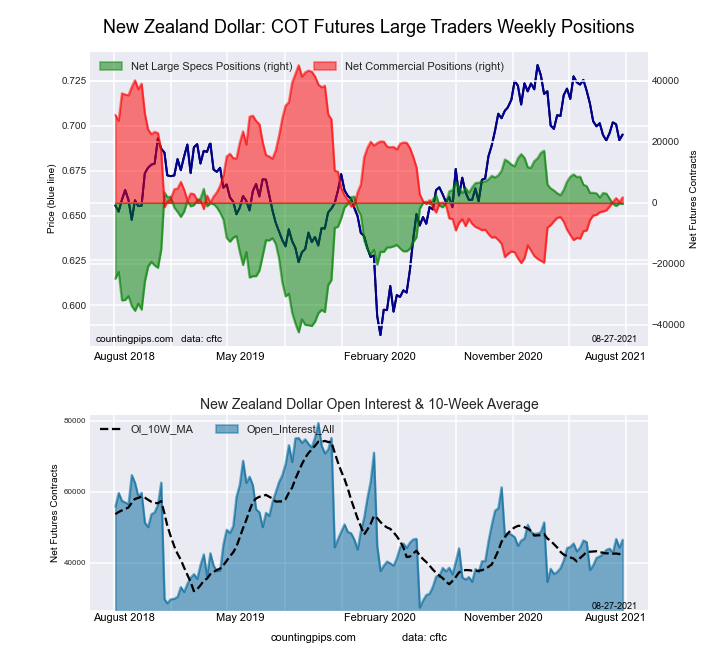
The New Zealand Dollar large speculator standing this week was a net position of -235 contracts in the data reported through Tuesday. This was a weekly increase of 797 contracts from the previous week which had a total of -1,032 net contracts.

This week’s current strength score (the trader positioning range over the past three years, measured from 0 to 100) shows the speculators are currently Bullish with a score of 70.9 percent. The commercials are Bearish with a score of 30.9 percent and the small traders (not shown in chart) are Bullish with a score of 52.0 percent.

NEW ZEALAND DOLLAR StatisticsSPECULATORSCOMMERCIALSSMALL TRADERS
– Percent of Open Interest Longs:37.746.89.3
– Percent of Open Interest Shorts:38.246.09.5
– Net Position:-235344-109
– Gross Longs:16,67420,7074,111
– Gross Shorts:16,90920,3634,220
– Long to Short Ratio:1.0 to 11.0 to 11.0 to 1
NET POSITION TREND:
– COT Index Score (3 Year Range Pct):70.930.952.0
– COT Index Reading (3 Year Range):BullishBearishBullish
NET POSITION MOVEMENT INDEX:
– 6-Week Change in Strength Index:-3.35.3-15.7


Mexican Peso Futures:

Ultra 10-Year Treasury Notes Bonds Futures COT Chart
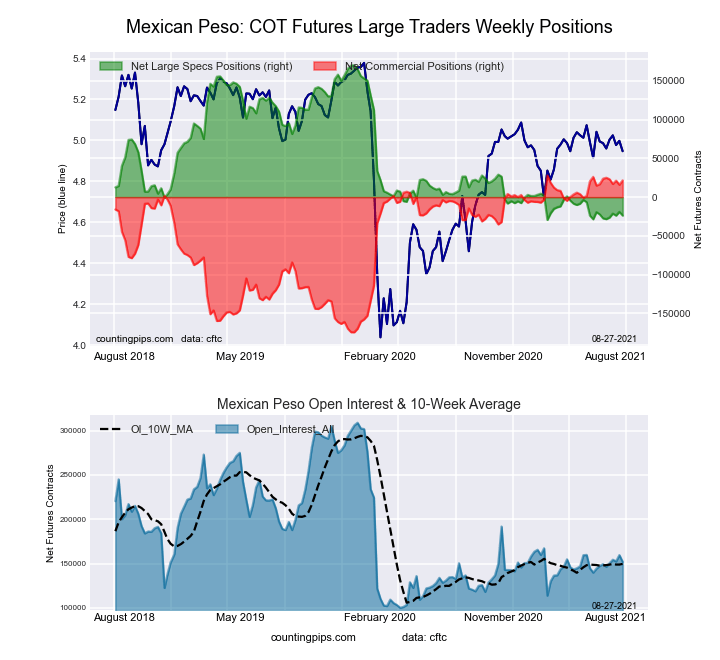
The Mexican Peso large speculator standing this week was a net position of -19,117 contracts in the data reported through Tuesday. This was a weekly boost of 4,770 contracts from the previous week which had a total of -23,887 net contracts.

This week’s current strength score (the trader positioning range over the past three years, measured from 0 to 100) shows the speculators are currently Bearish-Extreme with a score of 5.2 percent. The commercials are Bullish-Extreme with a score of 94.0 percent and the small traders (not shown in chart) are Bullish with a score of 56.5 percent.

MEXICAN PESO StatisticsSPECULATORSCOMMERCIALSSMALL TRADERS
– Percent of Open Interest Longs:48.046.14.1
– Percent of Open Interest Shorts:59.936.22.1
– Net Position:-19,11715,9433,174
– Gross Longs:76,53073,6526,522
– Gross Shorts:95,64757,7093,348
– Long to Short Ratio:0.8 to 11.3 to 11.9 to 1
NET POSITION TREND:
– COT Index Score (3 Year Range Pct):5.294.056.5
– COT Index Reading (3 Year Range):Bearish-ExtremeBullish-ExtremeBullish
NET POSITION MOVEMENT INDEX:
– 6-Week Change in Strength Index:1.6-0.4-10.2


Brazilian Real Futures:

US Year Treasury Notes Long Bonds Futures COT Chart
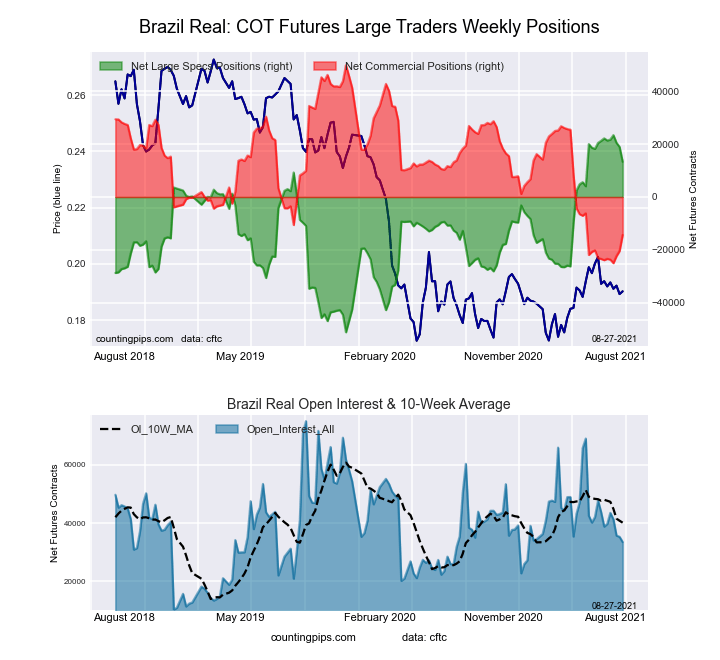
The Brazilian Real large speculator standing this week was a net position of 18,989 contracts in the data reported through Tuesday. This was a weekly reduction of -1,549 contracts from the previous week which had a total of 20,538 net contracts.

This week’s current strength score (the trader positioning range over the past three years, measured from 0 to 100) shows the speculators are currently Bullish-Extreme with a score of 94.0 percent. The commercials are Bearish-Extreme with a score of 6.1 percent and the small traders (not shown in chart) are Bullish-Extreme with a score of 85.0 percent.

BRAZIL REAL StatisticsSPECULATORSCOMMERCIALSSMALL TRADERS
– Percent of Open Interest Longs:73.317.59.2
– Percent of Open Interest Shorts:19.475.64.9
– Net Position:18,989-20,4891,500
– Gross Longs:25,8466,1763,230
– Gross Shorts:6,85726,6651,730
– Long to Short Ratio:3.8 to 10.2 to 11.9 to 1
NET POSITION TREND:
– COT Index Score (3 Year Range Pct):94.06.185.0
– COT Index Reading (3 Year Range):Bullish-ExtremeBearish-ExtremeBullish-Extreme
NET POSITION MOVEMENT INDEX:
– 6-Week Change in Strength Index:-3.14.0-8.0


Russian Ruble Futures:

Ultra US Year Treasury Notes Long Bonds Futures COT Chart
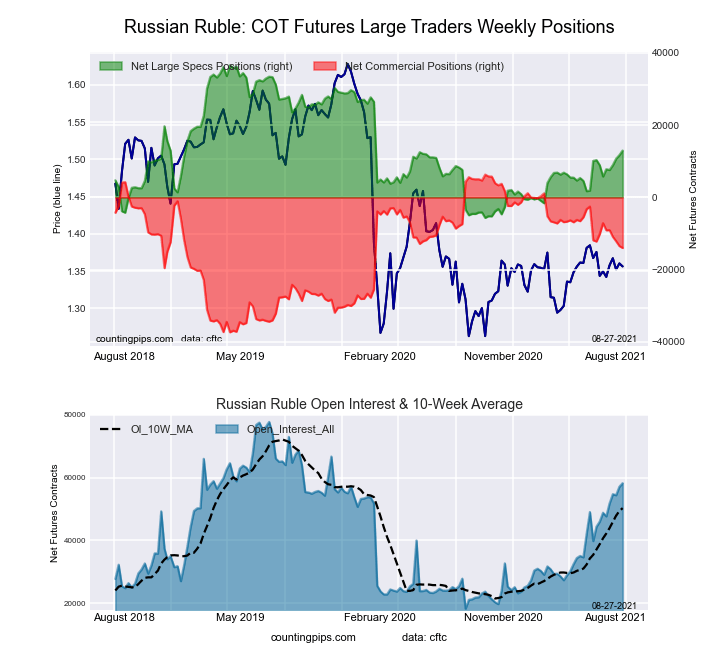
The Russian Ruble large speculator standing this week was a net position of 11,701 contracts in the data reported through Tuesday. This was a weekly gain of 999 contracts from the previous week which had a total of 10,702 net contracts.

This week’s current strength score (the trader positioning range over the past three years, measured from 0 to 100) shows the speculators are currently Bearish with a score of 41.1 percent. The commercials are Bullish with a score of 54.7 percent and the small traders (not shown in chart) are Bullish-Extreme with a score of 93.1 percent.

RUSSIAN RUBLE StatisticsSPECULATORSCOMMERCIALSSMALL TRADERS
– Percent of Open Interest Longs:42.552.54.9
– Percent of Open Interest Shorts:22.076.01.8
– Net Position:11,701-13,4481,747
– Gross Longs:24,23929,9472,796
– Gross Shorts:12,53843,3951,049
– Long to Short Ratio:1.9 to 10.7 to 12.7 to 1
NET POSITION TREND:
– COT Index Score (3 Year Range Pct):41.154.793.1
– COT Index Reading (3 Year Range):BearishBullishBullish-Extreme
NET POSITION MOVEMENT INDEX:
– 6-Week Change in Strength Index:6.6-7.615.1


Bitcoin Futures:

Eurodollar Bonds Futures COT Chart
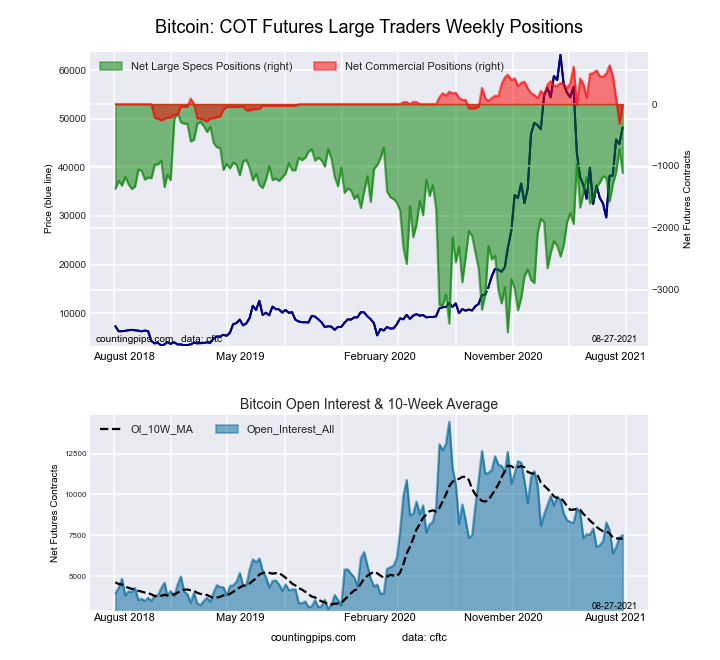
The Bitcoin large speculator standing this week was a net position of -726 contracts in the data reported through Tuesday. This was a weekly gain of 378 contracts from the previous week which had a total of -1,104 net contracts.

This week’s current strength score (the trader positioning range over the past three years, measured from 0 to 100) shows the speculators are currently Bullish-Extreme with a score of 83.5 percent. The commercials are Bearish-Extreme with a score of 0.0 percent and the small traders (not shown in chart) are Bearish with a score of 24.1 percent.

BITCOIN StatisticsSPECULATORSCOMMERCIALSSMALL TRADERS
– Percent of Open Interest Longs:65.24.025.3
– Percent of Open Interest Shorts:75.18.311.1
– Net Position:-726-3211,047
– Gross Longs:4,8042931,863
– Gross Shorts:5,530614816
– Long to Short Ratio:0.9 to 10.5 to 12.3 to 1
NET POSITION TREND:
– COT Index Score (3 Year Range Pct):83.50.024.1
– COT Index Reading (3 Year Range):Bullish-ExtremeBearish-ExtremeBearish
NET POSITION MOVEMENT INDEX:
– 6-Week Change in Strength Index:15.4-81.27.4


Article By CountingPips.comReceive our weekly COT Reports by Email

*COT Report: The COT data, released weekly to the public each Friday, is updated through the most recent Tuesday (data is 3 days old) and shows a quick view of how large speculators or non-commercials (for-profit traders) were positioned in the futures markets.

The CFTC categorizes trader positions according to commercial hedgers (traders who use futures contracts for hedging as part of the business), non-commercials (large traders who speculate to realize trading profits) and nonreportable traders (usually small traders/speculators).

Find CFTC criteria here: (http://www.cftc.gov/MarketReports/CommitmentsofTraders/ExplanatoryNotes/index.htm).

Ichimoku Cloud Analysis 20.08.2021 (EURJPY, GBPUSD, EURGBP)

Article By RoboForex.com

EURJPY, “Euro vs Japanese Yen”

EURJPY is trading at 128.11; the instrument is moving below Ichimoku Cloud, thus indicating a descending tendency. The markets could indicate that the price may test the resistance level at 128.35 and then resume moving downwards to reach 126.95. Another signal in favor of a further downtrend will be a rebound from the descending channel’s downside border. However, the bearish scenario may no longer be valid if the price breaks the cloud’s upside border and fixes above 129.45. In this case, the pair may continue growing towards 130.35.

EURJPY
Risk Warning: the result of previous trading operations do not guarantee the same results in the future

GBPUSD, “Great Britain Pound vs US Dollar”

GBPUSD is trading at 1.3617; the instrument is moving below Ichimoku Cloud, thus indicating a descending tendency. The markets could indicate that the price may test Tenkan-Sen and Kijun-Sen at 1.3655 and then resume moving downwards to reach 1.3485. Another signal in favor of a further downtrend will be a rebound from the descending channel’s upside border. However, the bearish scenario may no longer be valid if the price breaks the cloud’s upside border and fixes above 1.3845. In this case, the pair may continue growing towards 1.3935.

GBPUSD
Risk Warning: the result of previous trading operations do not guarantee the same results in the future

EURGBP, “Euro vs Great Britain Pound”

EURGBP is trading at 0.8576; the instrument is moving above Ichimoku Cloud, thus indicating an ascending tendency. The markets could indicate that the price may test Tenkan-Sen and Kijun-Sen at 0.8535 and then resume moving upwards to reach 0.8635. Another signal in favor of a further uptrend will be a rebound from the rising channel’s downside border. However, the bullish scenario may no longer be valid if the price breaks the cloud’s downside border and fixes below 0.8475. In this case, the pair may continue falling towards 0.8385.

EURGBP

Article By RoboForex.com

Attention!
Forecasts presented in this section only reflect the author’s private opinion and should not be considered as guidance for trading. RoboForex LP bears no responsibility for trading results based on trading recommendations described in these analytical reviews.

Fibonacci Retracements Analysis 20.08.2021 (AUDUSD, USDCAD)

Article By RoboForex.com

AUDUSD, “Australian Dollar vs US Dollar”

In the daily chart, the asset is forming a quick descending wave inside the downtrend. After testing 23.6% fibo from below, AUDUSD is approaching 38.2% at 0.7052 and may later continue trading towards 50.0% and 61.8% fibo at 0.6758 and 0.6464 respectively. The key resistance is the high at 0.8007.

AUDUSD_D1
Risk Warning: the result of previous trading operations do not guarantee the same results in the future

The H1 chart of AUDUSD shows divergence on MACD, which may indicate a potential correctional rebound after the price 38.2% fibo at 0.7052. the correctional targets may be 23,6%, 38.2%, and 50.0% at 0.7141, 0.7195, and 0.7239 respectively.

AUDUSD_H1
Risk Warning: the result of previous trading operations do not guarantee the same results in the future

USDCAD, “US Dollar vs Canadian Dollar”

As we can see in the daily chart, the pair is moving upwards, thus forming a new wave to the upside with the targets at 38.2%, 50.0%, and 61.8% fibo at 1.3022, 1.3336, and 1.3650 respectively. The key support remains at the low at 1.2007.

USDCAD_D1
Risk Warning: the result of previous trading operations do not guarantee the same results in the future

In the H4 chart, after completing the descending correction at 50.0% fibo, the asset has broken its previous high. At the moment, the pair is trading towards the post-correctional extension area between 138.2% and 161.8% fibo at 1.2953 and 1.3044 respectively. The support is the fractal low at 1.2422.

USDCAD_H4

Article By RoboForex.com

Attention!
Forecasts presented in this section only reflect the author’s private opinion and should not be considered as guidance for trading. RoboForex LP bears no responsibility for trading results based on trading recommendations described in these analytical reviews.