Archive for Forex and Currency News – Page 221

Forex Technical Analysis & Forecast 20.09.2021

Article By RoboForex.com

EURUSD, “Euro vs US Dollar”

After reaching the short-term downside target at 1.1730 and forming a new consolidation range there, EURUSD has broken it to the downside to reach 1.1710. Today, the pair may form one more ascending structure to break 1.1730 and then continue the correction to test 1.1750 from below. Later, the market may resume trading within the downtrend with the target at 1.1666.

EURUSD
Risk Warning: the result of previous trading operations do not guarantee the same results in the future

GBPUSD, “Great Britain Pound vs US Dollar”

After reaching the short-term downside target at 1.3734 and then forming a new consolidation range below this level, GBPUSD has broken it to the downside. Possibly, today the pair may continue falling towards 1.3697. Later, the market may start a new correction to return to 1.3734 and then resume trading downwards with the target at 1.3676.

GBPUSD
Risk Warning: the result of previous trading operations do not guarantee the same results in the future

USDRUB, “US Dollar vs Russian Ruble”

USDRUB continues the correction. Today, the pair may reach 73.00 and then form a new descending structure to break 72.50. Later, the market may continue trading within the downtrend with the target at 72.00.

USDRUB
Risk Warning: the result of previous trading operations do not guarantee the same results in the future

USDJPY, “US Dollar vs Japanese Yen”

USDJPY is still consolidating above 109.89. Possibly, the pair may fall to break 109.50 and then continue trading downwards with the target at 108.85.

USDJPY
Risk Warning: the result of previous trading operations do not guarantee the same results in the future

USDCHF, “US Dollar vs Swiss Franc”

After completing the ascending wave at 0.9324, USDCHF is consolidating around this level. Possibly, today the pair may expand the range down and up to 0.9292 and 0.9357 respectively. If later the price breaks this range to the downside, the market may start a new correction towards 0.9260; if to the upside – resume trading within the uptrend with the target at 0.9408.

USDCHF
Risk Warning: the result of previous trading operations do not guarantee the same results in the future

AUDUSD, “Australian Dollar vs US Dollar”

After completing the descending structure at 0.7270 and breaking it to the downside, AUDUSD has reached 0.7227. Today, the pair may correct to test 0.7270 from below and then resume falling with the target at 0.7220.

AUDUSD
Risk Warning: the result of previous trading operations do not guarantee the same results in the future

BRENT

Brent is still consolidating around 75.30. Today, the asset may fall to reach 74.35 and then start a new growth with the short-term target at 77.70.

BRENT
Risk Warning: the result of previous trading operations do not guarantee the same results in the future

XAUUSD, “Gold vs US Dollar”

Gold is still consolidating around 1752.22. Possibly, today the metal may expand the range down to 1741.12 and then form one more ascending structure with the target at 1767.22.

GOLD
Risk Warning: the result of previous trading operations do not guarantee the same results in the future

S&P 500

After forming a new consolidation range above 4438.8 and breaking it to the downside, the S&P index has reached the short-term target at 4400.0; right now, it is consolidating near the latter level. Possibly, the asset may expand the range down to 4390.1 and then start a new growth to break 4414.0. After that, the instrument may continue trading upwards to test 4438.8 from below and then resume falling with the target at 4350.0.

S&P 500

Article By RoboForex.com

Attention!
Forecasts presented in this section only reflect the author’s private opinion and should not be considered as guidance for trading. RoboForex LP bears no responsibility for trading results based on trading recommendations described in these analytical reviews.

The Analytical Overview of the Main Currency Pairs on 2021.09.20

by JustForex

The EUR/USD currency pair

Technical indicators of the currency pair:
  • Prev Open: 1.1761
  • Prev Close: 1.1725
  • % chg. over the last day: -0.30%

Inflationary expectations continue to grow in Germany. Inflation is no longer seen as a temporary phenomenon but as something more permanent. The German inflation expectations index increased by 1.60% last week; it’s the highest level since 2013.

Trading recommendations
  • Support levels: 1.1704, 1.1620
  • Resistance levels: 1.1772, 1.1802, 1.1835, 1.1894, 1.1934, 1.1969

From the technical point of view, the general trend on the EUR/USD currency pair is bullish. However, the selling pressure is rising, and the price has approached the priority change level. The MACD indicator is in the negative zone, but there are signs of overselling and a reversal in the form of divergence. Under such market conditions, buy trades can be considered from the priority change level, but after a new buyers initiative. It is better to look for sell trades throughout the day from the resistance level in the area of the broken triangle.

Alternative scenario: if the price breaks down through the 1.1704 support level and fixes below, the mid-term uptrend will likely be broken.

EUR/USD
News feed for 2021.09.20:
  • – German Producer Price Index (m/m) at 09:00 (GMT+3).

The GBP/USD currency pair

Technical indicators of the currency pair:
  • Prev Open: 1.3788
  • Prev Close: 1.3729
  • % chg. over the last day: -0.43%

Consumer prices in the UK rose at the fastest pace in August as global supply shortages and wage increases accelerated inflation. The National Statistics reported that inflation accelerated from 2% to 3.2% year-over-year.

Trading recommendations
  • Support levels: 1.3692, 1.3632, 1.3614, 1.3525
  • Resistance levels: 1.3769, 1.3886, 1.3935, 1.4002

On the hourly timeframe, the GBP/USD trend is bullish. But amid the strengthening of the dollar index, the GBP/USD currency pair is under sellers’ pressure. The MACD indicator has become negative. There are signs of overselling but no signs of reversal. Under such market conditions, it is better to look for buy trades from the priority change level, but after a new initiative from the buyers. Sell positions can be considered from the resistance levels with short targets throughout the day.

Alternative scenario: if the price breaks down through the 1.3692 support level and consolidates below, the bearish scenario will likely resume.

GBP/USD
There is no news feed for today.

The USD/JPY currency pair

Technical indicators of the currency pair:
  • Prev Open: 109.72
  • Prev Close: 109.97
  • % chg. over the last day: +0.23%

Today is a bank holiday in Japan, so volatility on currency pairs with the Japanese yen will be low, and the price will follow the dollar index.

Trading recommendations
  • Support levels: 109.43, 109.19, 108.65
  • Resistance levels: 110.10, 110.40, 110.66, 110.95, 111.48

The main trend of the USD/JPY currency pair is bearish. But amid the strengthening of the dollar index and weakness of the Japanese yen, the USD/JPY moved upward again. The MACD indicator has become positive, showing no signs of reversal. Under such market conditions, traders should look for sell positions from the priority change level. Buy positions should be considered only from the support levels where the buyers show initiative throughout the day.

Alternative scenario: if the price rises above 110.10, the uptrend is likely to resume.

USD/JPY
There is no news feed for today.

The USD/CAD currency pair

Technical indicators of the currency pair:
  • Prev Open: 1.2680
  • Prev Close: 1.2769
  • % chg. over the last day: +0.70%

The Canadian dollar is a commodity currency, so the USD/CAD currency pair is highly dependent on the dynamics of the dollar index and oil prices. The dollar index increased on Friday, while oil prices decreased. As a result, the price of USD/CAD moved upward. Today federal elections are held in Canada.

Trading recommendations
  • Support levels: 1.2726, 1.2646, 1.2583, 1.2518, 1.2425
  • Resistance levels: 1.2812, 1.2891, 1.2951

In terms of technical analysis, the trend of the USD/CAD currency pair is bearish. But due to the growth of the dollar index, the price is now under the pressure of buyers. On Friday, the price broke out of the triangle upward. Buy positions can be considered from the support levels where buyers show initiative, and only with short targets. It is better to look for sell positions from the priority change level, but only after the new initiative from the sellers.

Alternative scenario: if the price breaks out through the 1.2812 resistance level and fixes above, the uptrend will likely resume.

USD/CAD
News feed for 2021.09.20:
  • – Canada Federal Election, All Day.

by JustForex


This article reflects a personal opinion and should not be interpreted as an investment advice, and/or offer, and/or a persistent request for carrying out financial transactions, and/or a guarantee, and/or a forecast of future events.

The US dollar continues its uptrend

By Admiral Markets

Last week the US dollar maintained its positive sentiment and appreciated against other currencies. The World Reserve Currency index rose to its highest level in over a month, although the overall sentiment in the financial market remains positive and the major equity indices are trading around all-time highs, while bond yields are rising moderately.

USD

US economic data remained strong. The country’s August inflation rate, which showed a 5.3% annual increase in prices, was the main focus of attention. Inflation remains high, despite central bank comments that the rise in prices is temporary and this is just a transitory phase. Another important indicator was retail sales volumes in August, which rose by 13.5% year-over-year and were slightly slower than in the previous month. Industrial production volumes were 6.0% higher than in the same period a year ago. The University of Michigan Consumer index was 71.0 points, which was around its lowest level since 2012. New jobless claims rose marginally from 0.310 to 0.332 million on the week.

The momentum of the pandemic continued to slow and the global average of new cases fell from 552 to 533 thousand per day. The situation in the US fluctuated slightly and was fairly stable, with the weekly average of cases hovering around 148 thousand per day. The number of vaccinations administered increased from 379 to 383 million, with a change of only 4 million. Overall in the US, the number of people vaccinated with at least one dose rose from 63.0% to 63.5% of the population, with a weekly increase of 0.5%. In Lithuania, the number of people vaccinated with at least one dose rose from 60.8% to 61.5%, a difference of 0.7%. In England, the number of cases slowed moderately from 37 to 29 thousand per day.

EUR

The major currency pair EUR/USD consolidated above the level of 1.180 in the first half of the week, but continued to fall since Thursday and ended trading at the level of 1.173. Economic data in the Old Continent were scarce. Among the most important weas industrial production, which increased by 7.7% year-on-year. The EUR/USD pair ended the week’s trading down -0.7%.

JPY

The most important Asian pair USD/JPY maintained its consolidative mood. It depreciated to a one-month low at the beginning of the week, but later recovered its losses and ended the trading session marginally changed at the 50-day moving average on the daily chart. Data included the producer price index, which showed a 5.5% increase and remained stable at its highest level since 2008. Industrial production in July was 11.6% higher than a year earlier, while exports in August were up by as much as 26.2% year-on-year. USD/JPY ended the week unchanged.

GBP

The British pound-US dollar pairing reflected the general sentiment of the currency market. After briefly rising to the level of 1.391 on Tuesday, it then depreciated sharply and ended the week at the level of 1.374. Among the data were labour market indicators, which showed an 8.3% annual increase in average wages, while the number of unemployed fell by 58 thousand and the unemployment rate inched lower to 4.6%. Annual inflation in August was 3.2% and retail sales were unchanged from a year earlier. GBP/USD ended the week down -0.7%.

Economic Events

This week will start rather quietly with the German producer price index being watched and no important data scheduled for Tuesday. Wednesday will start with the Bank of Japan’s central bank meeting and press conference, followed by the release of the US existing home sales figures and the minutes of the US central bank’s last meeting, where investors will be looking for clues on further monetary policy. Thursday will see preliminary purchasing managers’ indices and the Bank of England’s meeting. On Friday, attention will turn to Japanese inflation figures and US new home sales figures.

According to Admiral Markets market sentiment data, 85% of investors have long positions in the EUR/USD pair (up +20 percentage points compared to last week). In the main Asian pair USD/JPY, 24% of investors have long positions (down -25 percentage points). In GBP/USD, 83% of participants expect a rise (up +43 percentage points). Such market data is interpreted as a contrarian indicator, and therefore EUR/USD and GBP/USD are expected to fall, while USD/JPY is expected to appreciate. The analysis of positioning data should be combined with fundamental projections and technical analysis.

Source: bloomberg.com, reuters.com, Admiral Markets MT4 Supreme Edition, investing.com


Trade With MetaTrader 5

INFORMATION ABOUT ANALYTICAL MATERIALS:

The given data provides additional information regarding all analysis, estimates, prognosis, forecasts, market reviews, weekly outlooks or other similar assessments or information (hereinafter “Analysis”) published on the websites of Admiral Markets investment firms operating under the Admiral Markets trademark (hereinafter “Admiral Markets”) Before making any investment decisions please pay close attention to the following:

  • This is a marketing communication. The content is published for informative purposes only and is in no way to be construed as investment advice or recommendation. It has not been prepared in accordance with legal requirements designed to promote the independence of investment research, and that it is not subject to any prohibition on dealing ahead of the dissemination of investment research.
  • Any investment decision is made by each client alone whereas Admiral Markets shall not be responsible for any loss or damage arising from any such decision, whether or not based on the content.
  • With view to protecting the interests of our clients and the objectivity of the Analysis, Admiral Markets has established relevant internal procedures for prevention and management of conflicts of interest.
  • The Analysis is prepared by an independent analyst, Skirmantus Paulavicious (analyst), (hereinafter “Author”) based on their personal estimations.
  • Whilst every reasonable effort is taken to ensure that all sources of the content are reliable and that all information is presented, as much as possible, in an understandable, timely, precise and complete manner, Admiral Markets does not guarantee the accuracy or completeness of any information contained within the Analysis.
  • Any kind of past or modeled performance of financial instruments indicated within the content should not be construed as an express or implied promise, guarantee or implication by Admiral Markets for any future performance. The value of the financial instrument may both increase and decrease and the preservation of the asset value is not guaranteed.
  • Leveraged products (including contracts for difference) are speculative in nature and may result in losses or profit. Before you start trading, please ensure that you fully understand the risks involved.
Avatar-Admirals
Admirals An all-in-one solution for spending, investing, and managing your moneyMore than a broker, Admirals is a financial hub, offering a wide range of financial products and services. We make it possible to approach personal finance through an all-in-one solution for investing, spending, and managing money.

By Admiral Markets

COT Currency Futures Charts: US Dollar Index, Japanese Yen, Swiss Franc, NZD, AUD & Bitcoin

By CountingPips.com COT Home | Data Tables | Data Downloads | Newsletter

Here are the latest charts and statistics for the Commitment of Traders (COT) data published by the Commodities Futures Trading Commission (CFTC).

The latest COT data is updated through Tuesday September 14th 2021 and shows a quick view of how large traders (for-profit speculators and commercial entities) were positioned in the futures markets. All currency positions are in direct relation to the US dollar where, for example, a bet for the euro is a bet that the euro will rise versus the dollar while a bet against the euro will be a bet that the euro will decline versus the dollar.


US Dollar Index Futures:

Federal Funds 30-Day Bonds Futures COT Chart
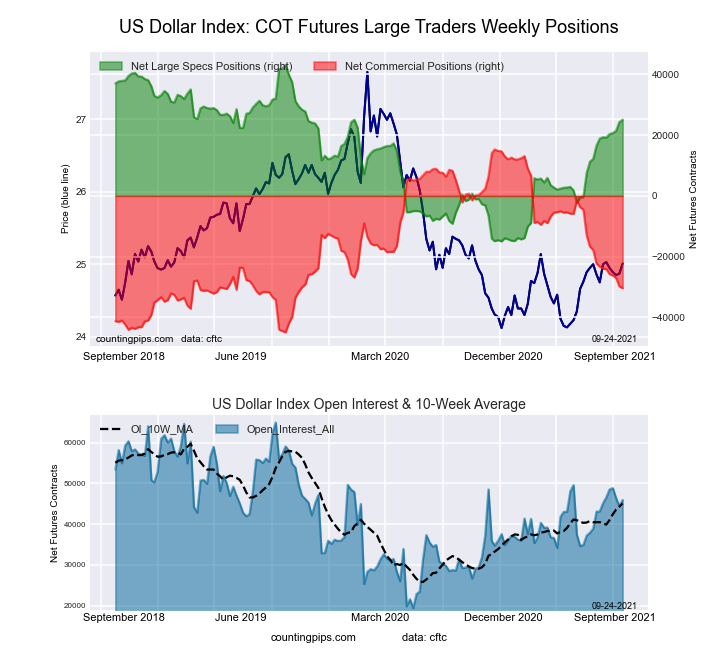
The US Dollar Index large speculator standing this week recorded a net position of 24,273 contracts in the data reported through Tuesday. This was a weekly increase of 2,808 contracts from the previous week which had a total of 21,465 net contracts.

This week’s current strength score (the trader positioning range over the past three years, measured from 0 to 100) shows the speculators are currently Bullish with a score of 67.7 percent. The commercials are Bearish with a score of 25.1 percent and the small traders (not shown in chart) are Bullish-Extreme with a score of 97.1 percent.

US DOLLAR INDEX StatisticsSPECULATORSCOMMERCIALSSMALL TRADERS
– Percent of Open Interest Longs:78.42.716.2
– Percent of Open Interest Shorts:23.769.83.8
– Net Position:24,273-29,7755,502
– Gross Longs:34,8051,2197,185
– Gross Shorts:10,53230,9941,683
– Long to Short Ratio:3.3 to 10.0 to 14.3 to 1
NET POSITION TREND:
– COT Index Score (3 Year Range Pct):67.725.197.1
– COT Index Reading (3 Year Range):BullishBearishBullish-Extreme
NET POSITION MOVEMENT INDEX:
– 6-Week Change in Strength Index:9.3-10.815.5


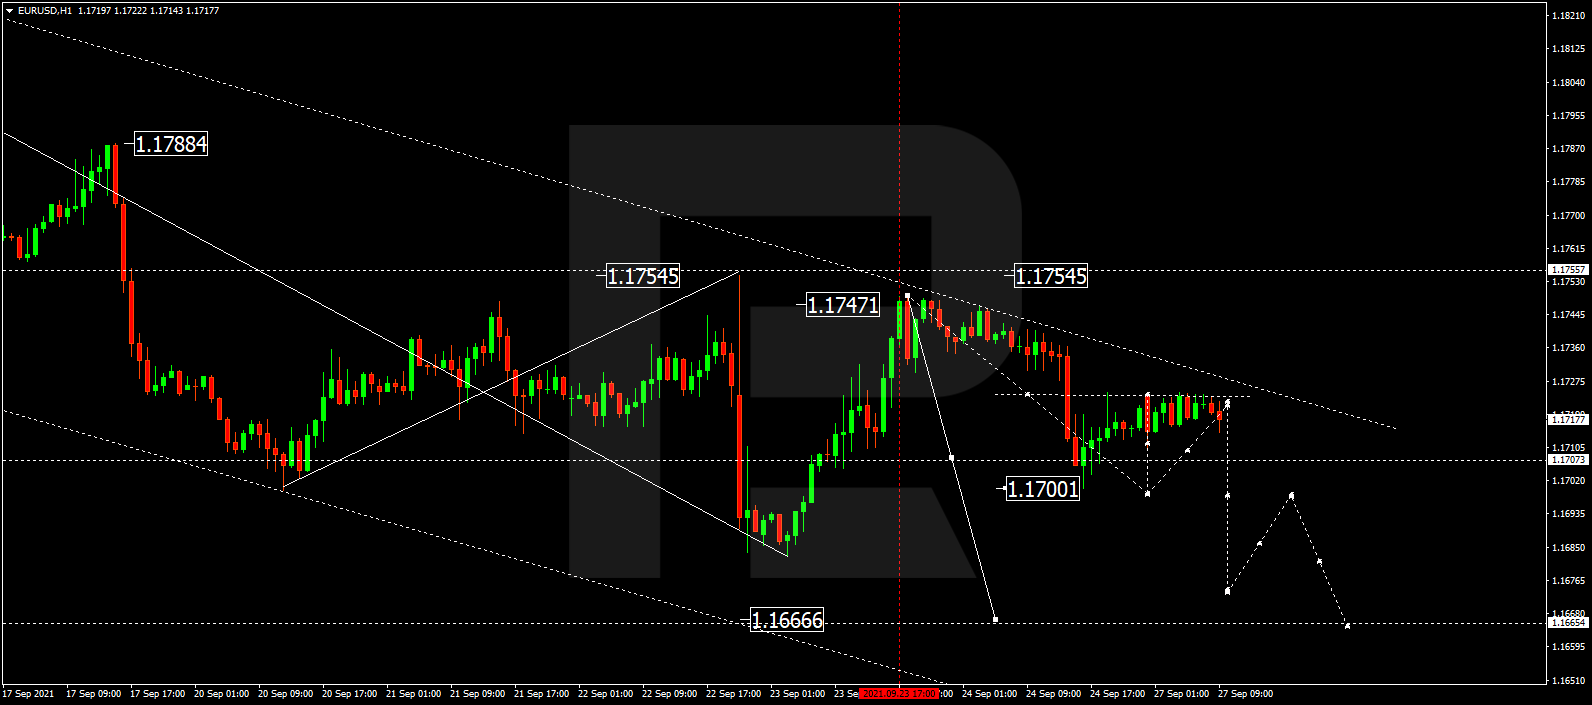
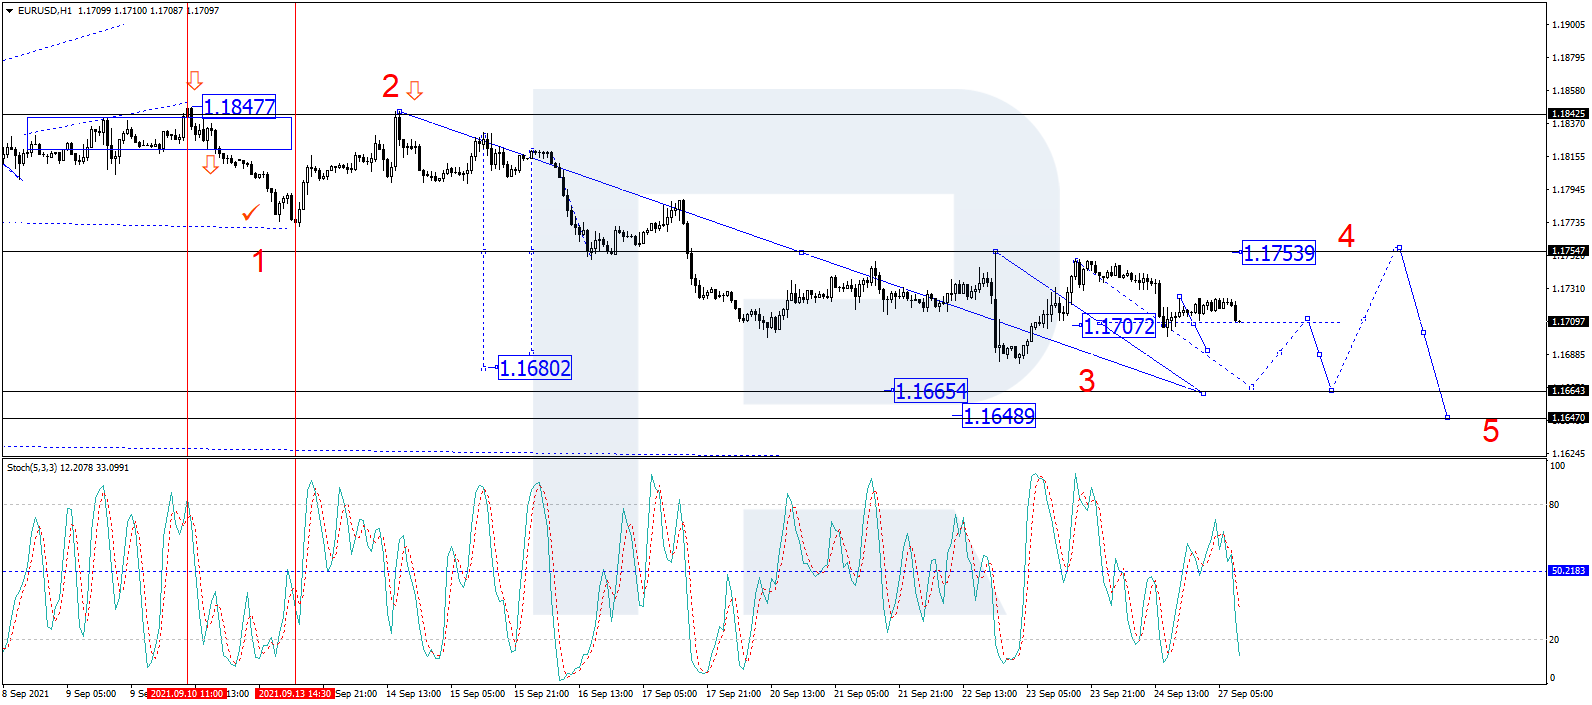
Euro Currency Futures:

2-Year Treasury Bonds Futures COT Chart
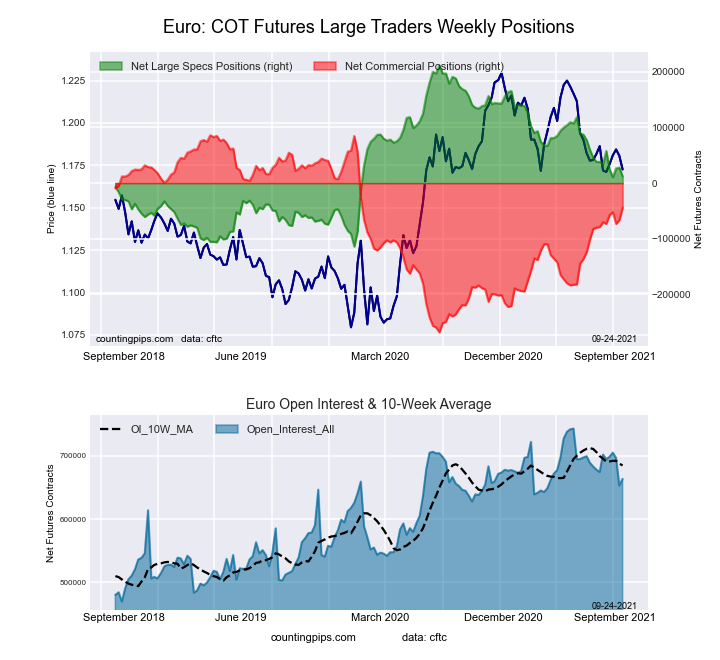
The Euro Currency large speculator standing this week recorded a net position of 27,805 contracts in the data reported through Tuesday. This was a weekly boost of 1,497 contracts from the previous week which had a total of 26,308 net contracts.

This week’s current strength score (the trader positioning range over the past three years, measured from 0 to 100) shows the speculators are currently Bearish with a score of 43.5 percent. The commercials are Bullish with a score of 57.0 percent and the small traders (not shown in chart) are Bearish with a score of 40.8 percent.

EURO Currency StatisticsSPECULATORSCOMMERCIALSSMALL TRADERS
– Percent of Open Interest Longs:28.656.413.8
– Percent of Open Interest Shorts:24.366.67.9
– Net Position:27,805-66,26038,455
– Gross Longs:186,554368,59390,270
– Gross Shorts:158,749434,85351,815
– Long to Short Ratio:1.2 to 10.8 to 11.7 to 1
NET POSITION TREND:
– COT Index Score (3 Year Range Pct):43.557.040.8
– COT Index Reading (3 Year Range):BearishBullishBearish
NET POSITION MOVEMENT INDEX:
– 6-Week Change in Strength Index:-3.13.6-4.1


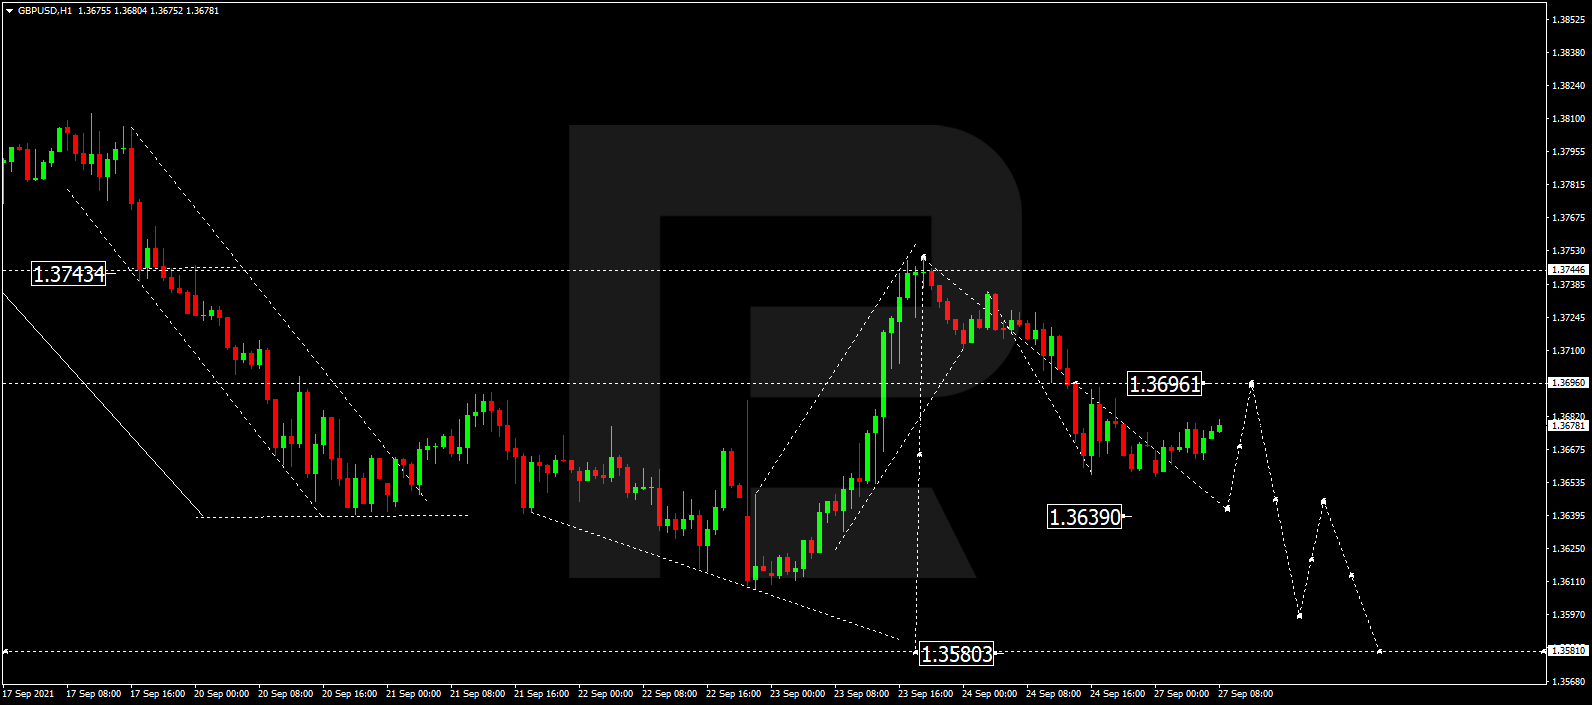
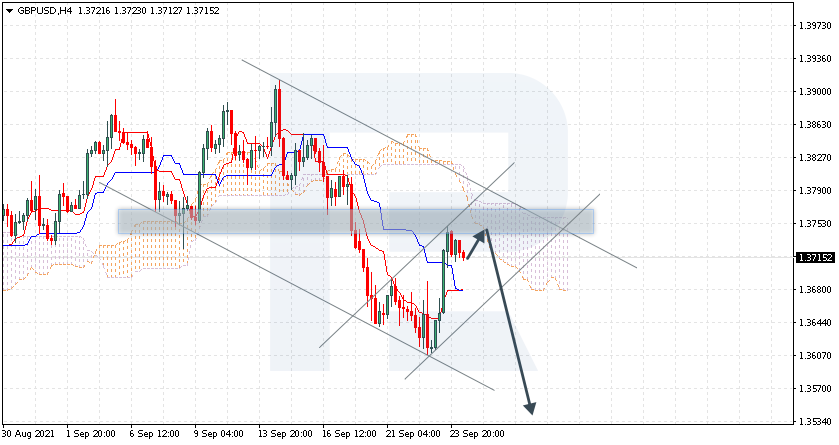
British Pound Sterling Futures:

5-Year Treasury Bonds Futures COT Chart
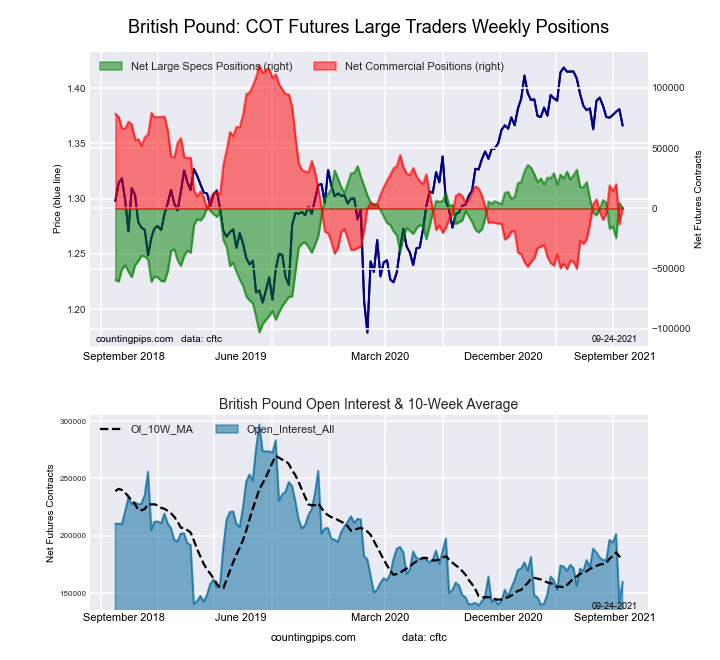
The British Pound Sterling large speculator standing this week recorded a net position of 4,790 contracts in the data reported through Tuesday. This was a weekly advance of 29,314 contracts from the previous week which had a total of -24,524 net contracts.

This week’s current strength score (the trader positioning range over the past three years, measured from 0 to 100) shows the speculators are currently Bullish with a score of 77.5 percent. The commercials are Bearish with a score of 21.9 percent and the small traders (not shown in chart) are Bullish with a score of 72.8 percent.

BRITISH POUND StatisticsSPECULATORSCOMMERCIALSSMALL TRADERS
– Percent of Open Interest Longs:31.046.122.9
– Percent of Open Interest Shorts:27.655.217.0
– Net Position:4,790-13,0778,287
– Gross Longs:44,16165,67932,596
– Gross Shorts:39,37178,75624,309
– Long to Short Ratio:1.1 to 10.8 to 11.3 to 1
NET POSITION TREND:
– COT Index Score (3 Year Range Pct):77.521.972.8
– COT Index Reading (3 Year Range):BullishBearishBullish
NET POSITION MOVEMENT INDEX:
– 6-Week Change in Strength Index:3.5-6.010.9


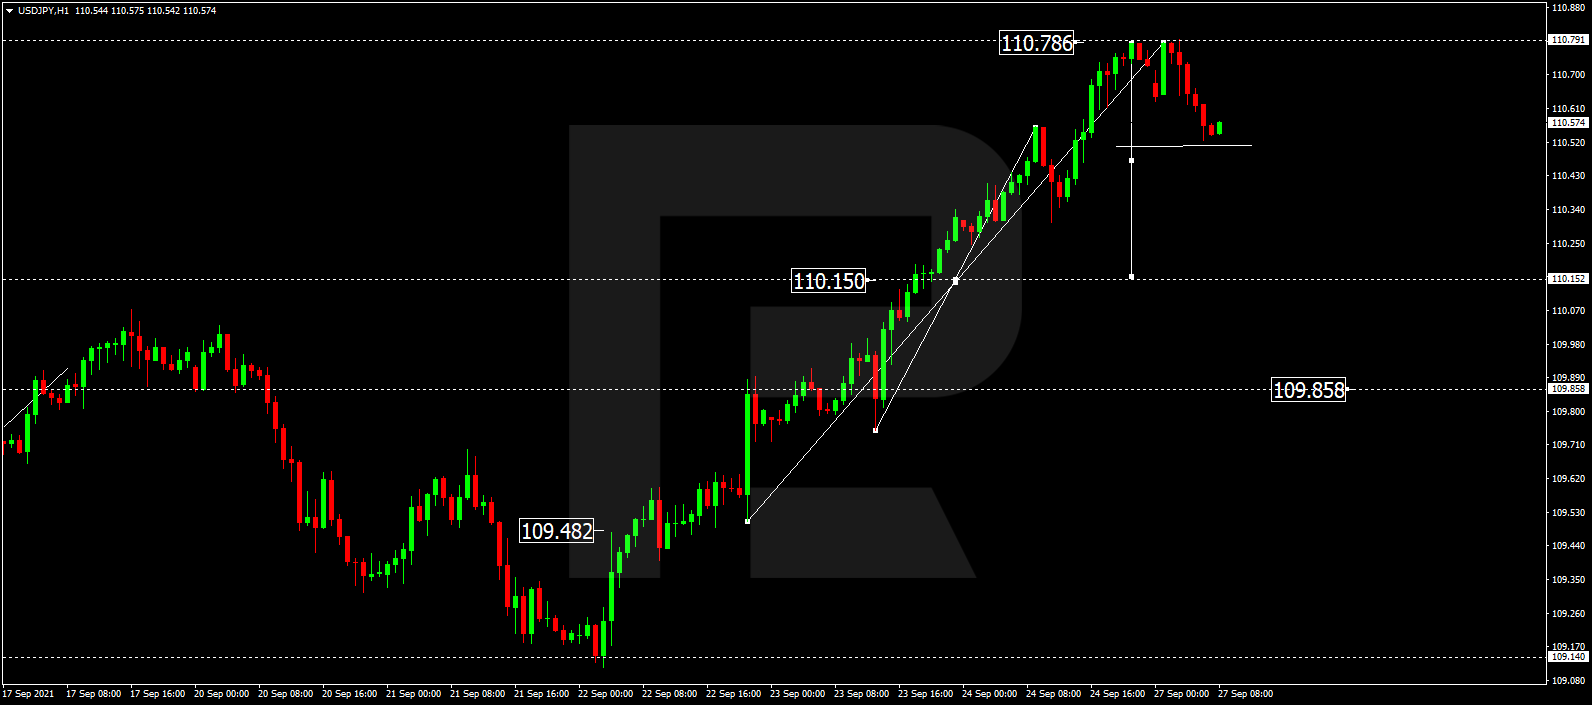
Japanese Yen Futures:

10-Year Treasury Notes Bonds Futures COT ChartThe Japanese Yen large speculator standing this week recorded a net position of -60,295 contracts in the data reported through Tuesday. This was a weekly increase of 2,030 contracts from the previous week which had a total of -62,325 net contracts.

This week’s current strength score (the trader positioning range over the past three years, measured from 0 to 100) shows the speculators are currently Bearish with a score of 33.1 percent. The commercials are Bullish with a score of 66.8 percent and the small traders (not shown in chart) are Bearish with a score of 40.3 percent.

JAPANESE YEN StatisticsSPECULATORSCOMMERCIALSSMALL TRADERS
– Percent of Open Interest Longs:11.376.411.4
– Percent of Open Interest Shorts:42.741.015.5
– Net Position:-60,29568,035-7,740
– Gross Longs:21,728146,71621,950
– Gross Shorts:82,02378,68129,690
– Long to Short Ratio:0.3 to 11.9 to 10.7 to 1
NET POSITION TREND:
– COT Index Score (3 Year Range Pct):33.166.840.3
– COT Index Reading (3 Year Range):BearishBullishBearish
NET POSITION MOVEMENT INDEX:
– 6-Week Change in Strength Index:-3.10.29.1


Swiss Franc Futures:

Ultra 10-Year Treasury Notes Bonds Futures COT Chart
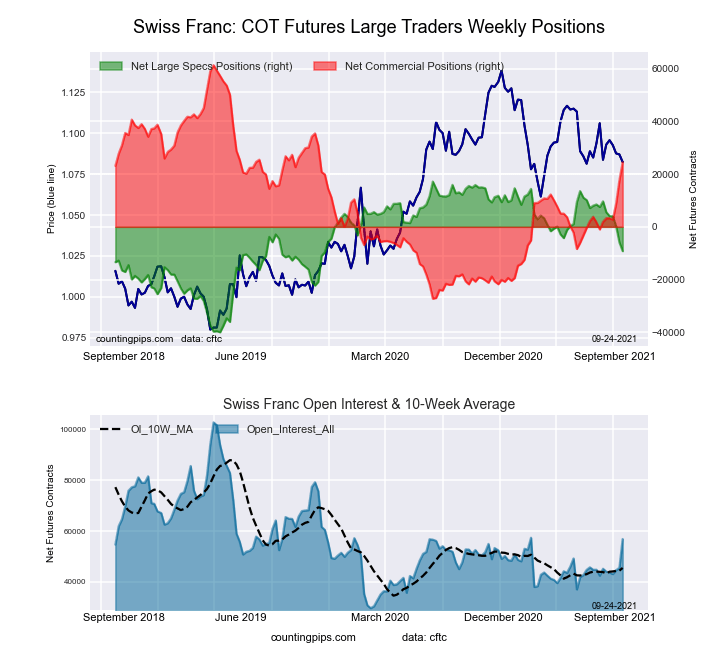
The Swiss Franc large speculator standing this week recorded a net position of -5,878 contracts in the data reported through Tuesday. This was a weekly fall of -6,098 contracts from the previous week which had a total of 220 net contracts.

This week’s current strength score (the trader positioning range over the past three years, measured from 0 to 100) shows the speculators are currently Bullish with a score of 59.7 percent. The commercials are Bullish with a score of 50.6 percent and the small traders (not shown in chart) are Bearish with a score of 29.0 percent.

SWISS FRANC StatisticsSPECULATORSCOMMERCIALSSMALL TRADERS
– Percent of Open Interest Longs:13.666.019.9
– Percent of Open Interest Shorts:26.527.445.6
– Net Position:-5,87817,574-11,696
– Gross Longs:6,17030,0539,048
– Gross Shorts:12,04812,47920,744
– Long to Short Ratio:0.5 to 12.4 to 10.4 to 1
NET POSITION TREND:
– COT Index Score (3 Year Range Pct):59.750.629.0
– COT Index Reading (3 Year Range):BullishBullishBearish
NET POSITION MOVEMENT INDEX:
– 6-Week Change in Strength Index:-23.520.9-15.1


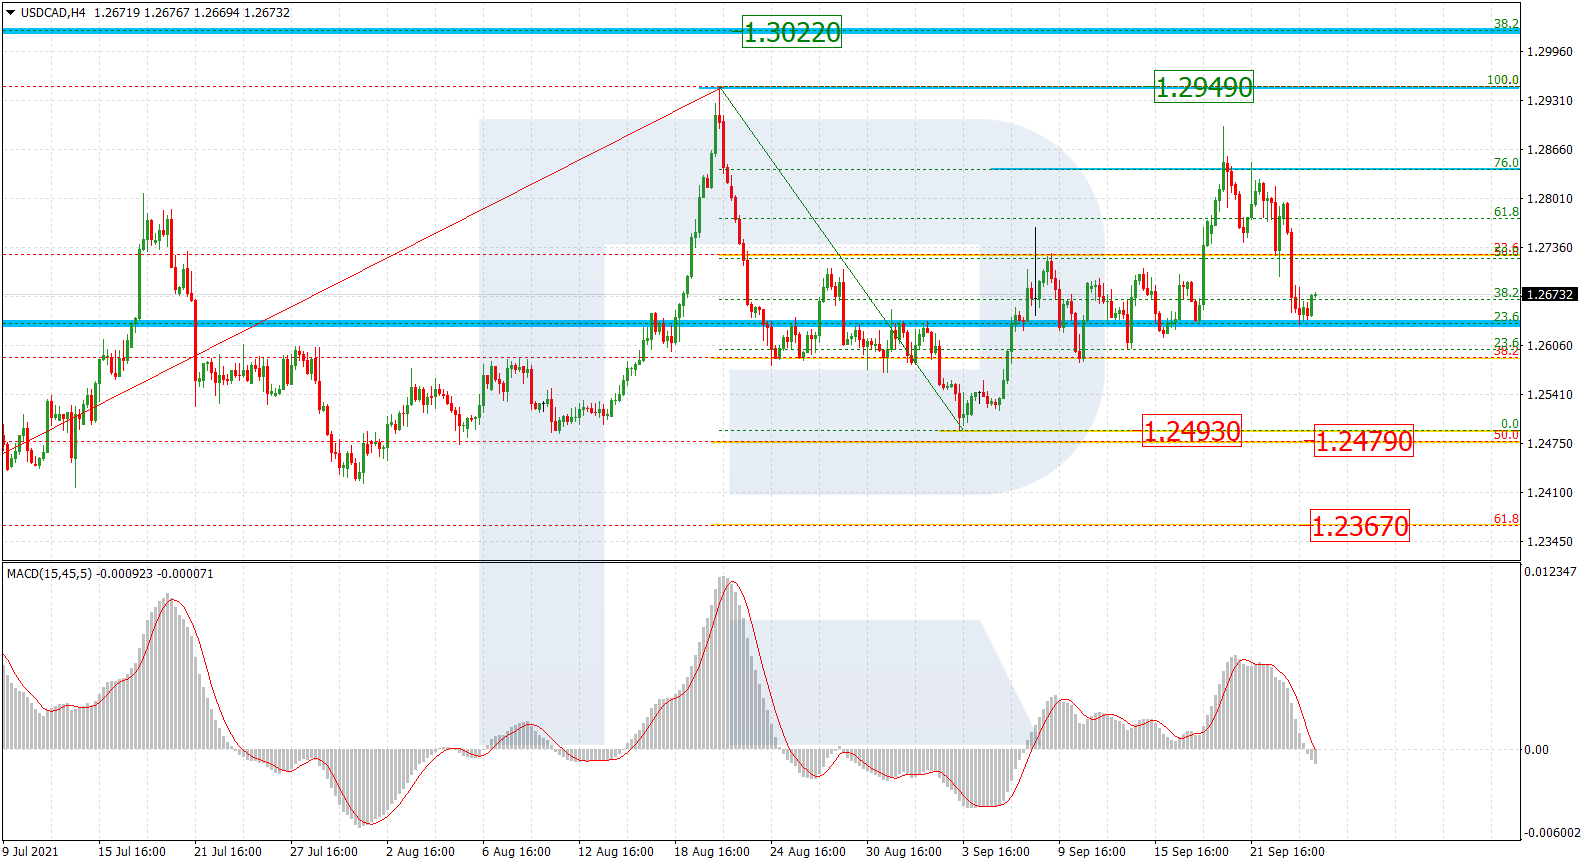
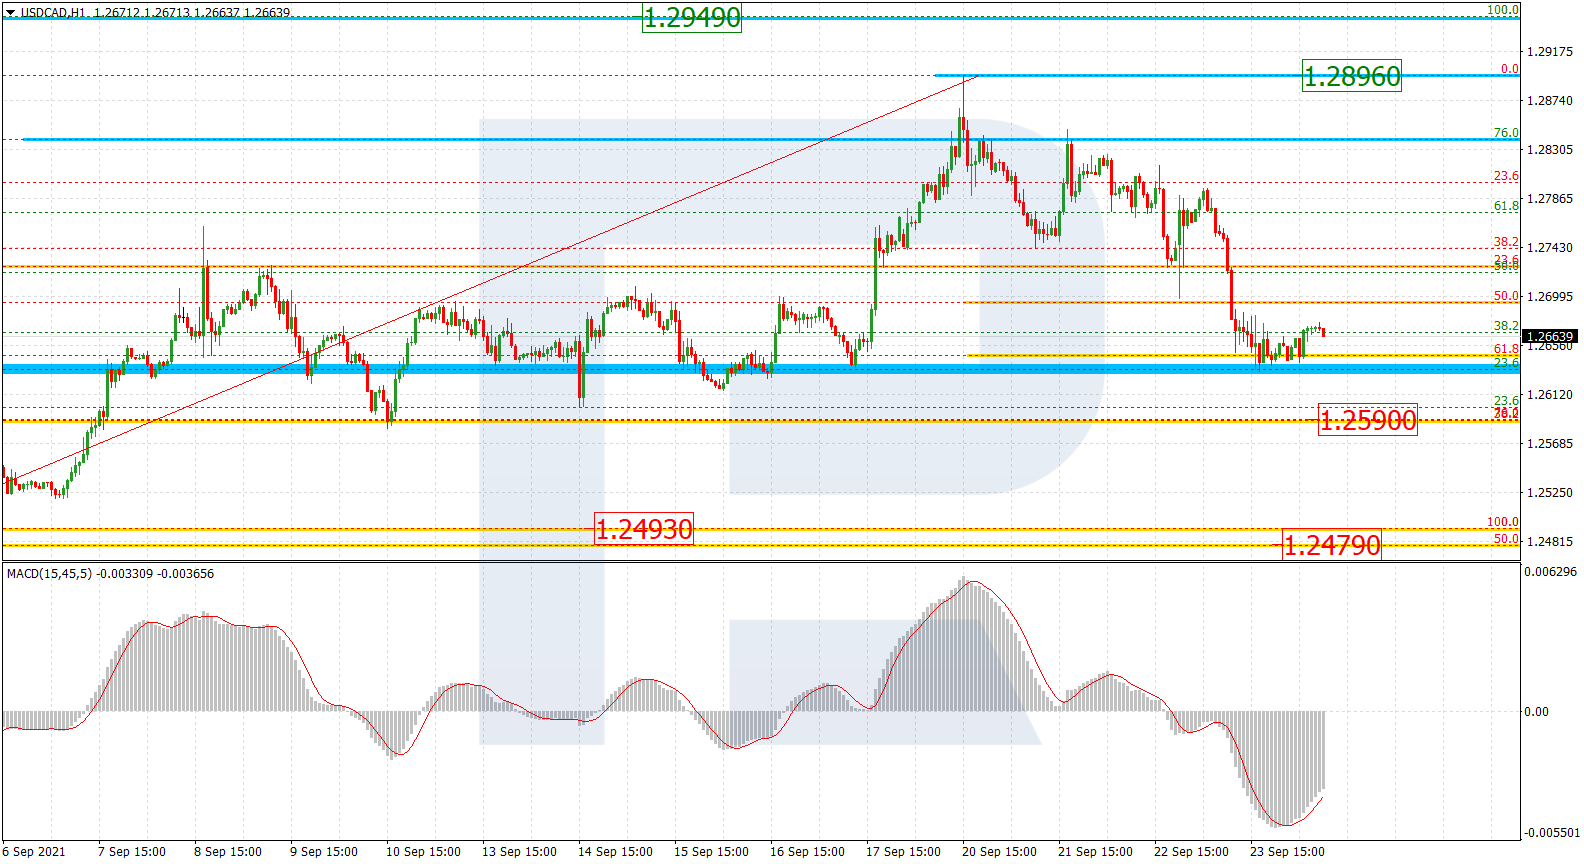
Canadian Dollar Futures:

US Year Treasury Notes Long Bonds Futures COT Chart
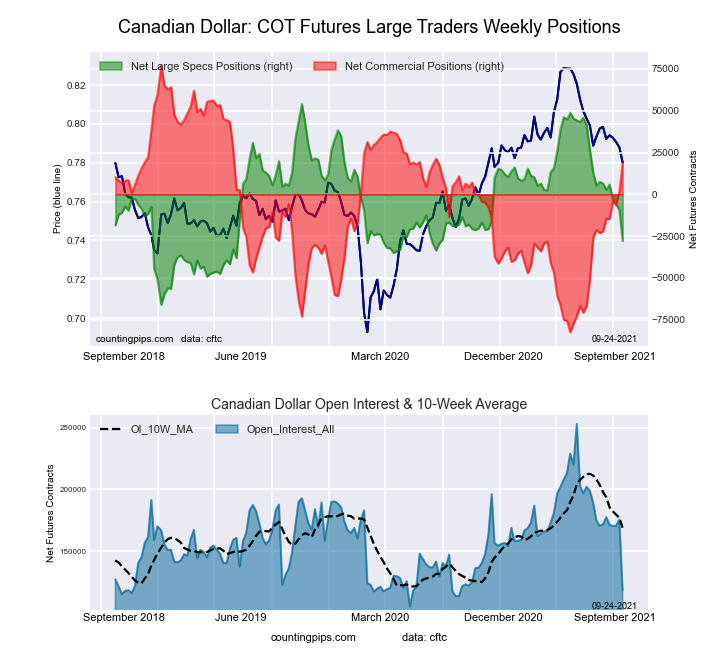
The Canadian Dollar large speculator standing this week recorded a net position of -9,283 contracts in the data reported through Tuesday. This was a weekly reduction of -3,273 contracts from the previous week which had a total of -6,010 net contracts.

This week’s current strength score (the trader positioning range over the past three years, measured from 0 to 100) shows the speculators are currently Bearish with a score of 47.3 percent. The commercials are Bullish with a score of 52.5 percent and the small traders (not shown in chart) are Bullish with a score of 58.7 percent.

CANADIAN DOLLAR StatisticsSPECULATORSCOMMERCIALSSMALL TRADERS
– Percent of Open Interest Longs:20.958.519.1
– Percent of Open Interest Shorts:26.257.714.6
– Net Position:-9,2831,4247,859
– Gross Longs:36,677102,84633,509
– Gross Shorts:45,960101,42225,650
– Long to Short Ratio:0.8 to 11.0 to 11.3 to 1
NET POSITION TREND:
– COT Index Score (3 Year Range Pct):47.352.558.7
– COT Index Reading (3 Year Range):BearishBullishBullish
NET POSITION MOVEMENT INDEX:
– 6-Week Change in Strength Index:-14.015.3-11.7


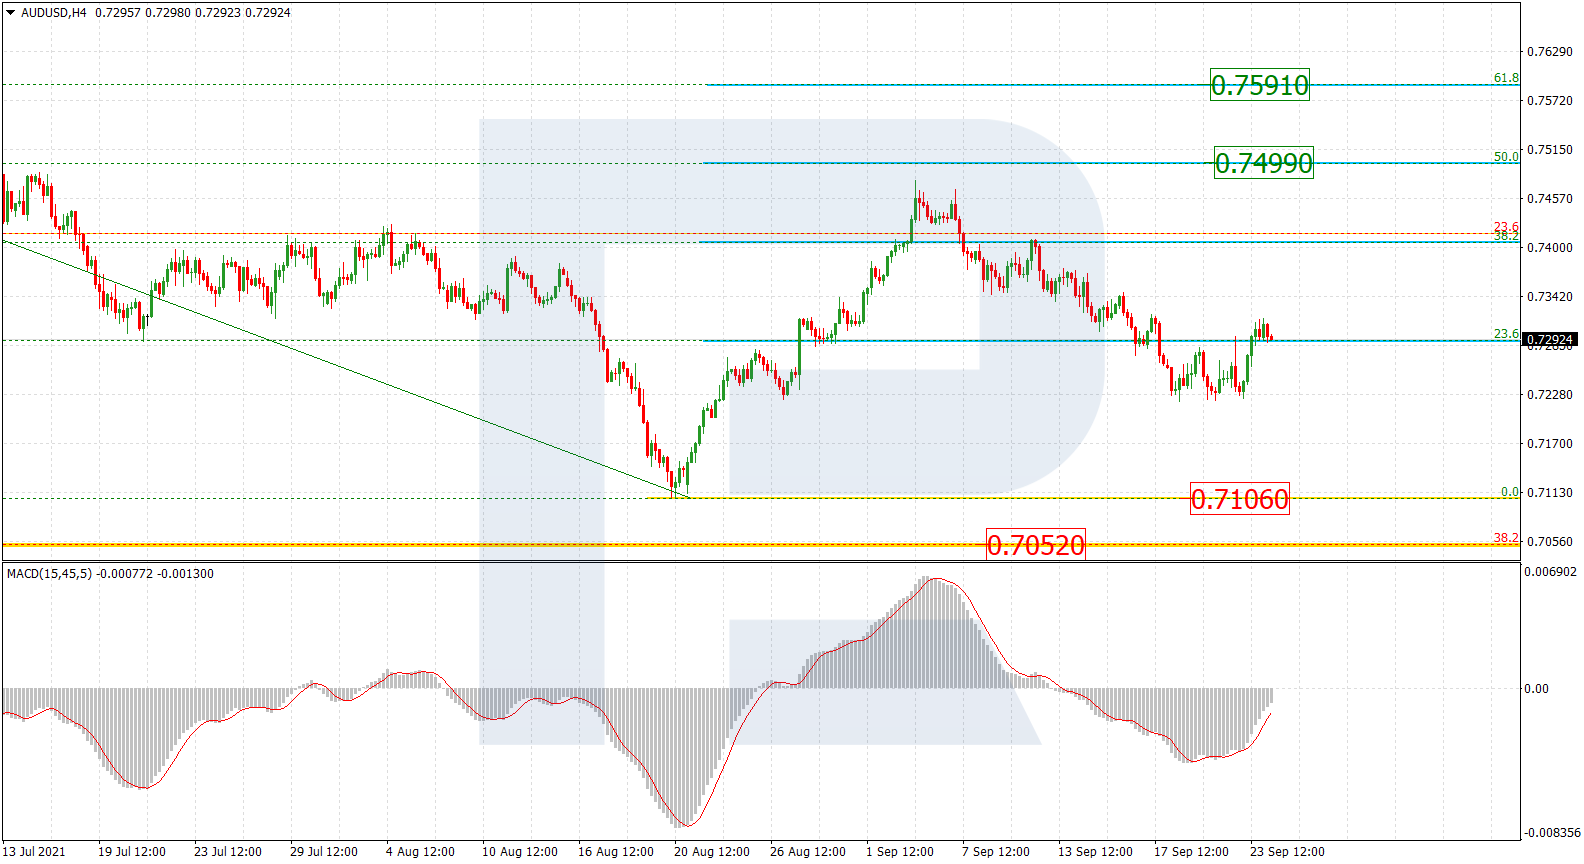
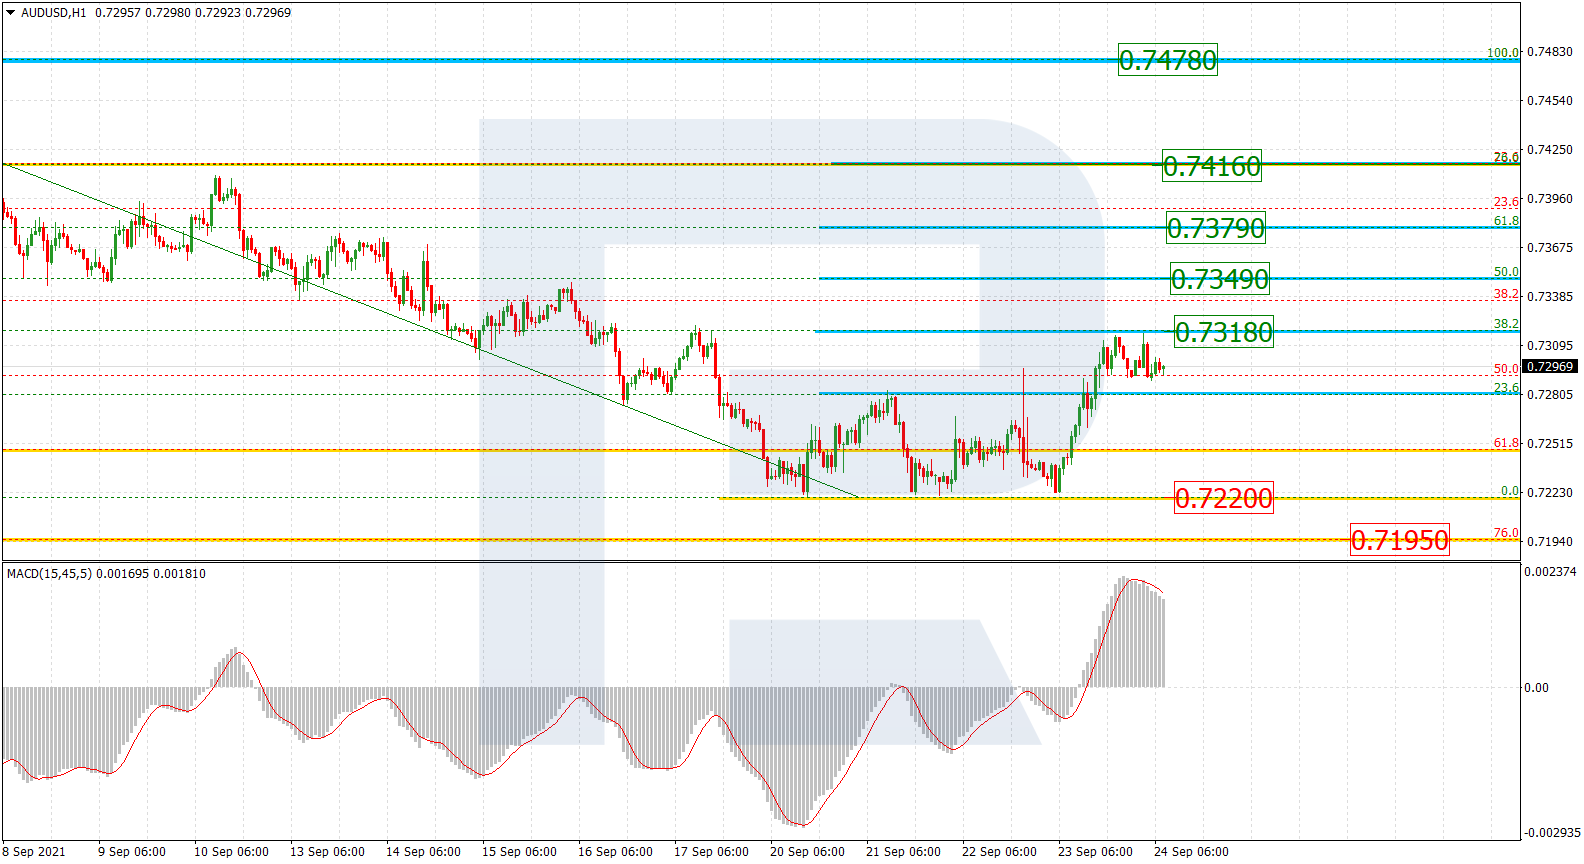
Australian Dollar Futures:

Ultra US Year Treasury Notes Long Bonds Futures COT Chart
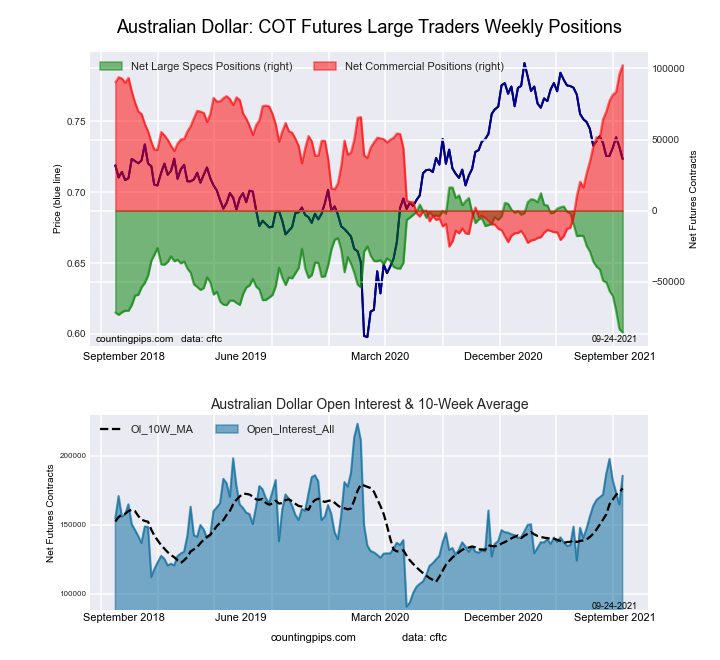
The Australian Dollar large speculator standing this week recorded a net position of -83,383 contracts in the data reported through Tuesday. This was a weekly reduction of -12,895 contracts from the previous week which had a total of -70,488 net contracts.

This week’s current strength score (the trader positioning range over the past three years, measured from 0 to 100) shows the speculators are currently Bearish-Extreme with a score of 0.0 percent. The commercials are Bullish-Extreme with a score of 100.0 percent and the small traders (not shown in chart) are Bearish with a score of 24.3 percent.

AUSTRALIAN DOLLAR StatisticsSPECULATORSCOMMERCIALSSMALL TRADERS
– Percent of Open Interest Longs:8.079.69.9
– Percent of Open Interest Shorts:58.621.317.6
– Net Position:-83,38396,033-12,650
– Gross Longs:13,116131,16316,375
– Gross Shorts:96,49935,13029,025
– Long to Short Ratio:0.1 to 13.7 to 10.6 to 1
NET POSITION TREND:
– COT Index Score (3 Year Range Pct):0.0100.024.3
– COT Index Reading (3 Year Range):Bearish-ExtremeBullish-ExtremeBearish
NET POSITION MOVEMENT INDEX:
– 6-Week Change in Strength Index:-42.236.8-5.9


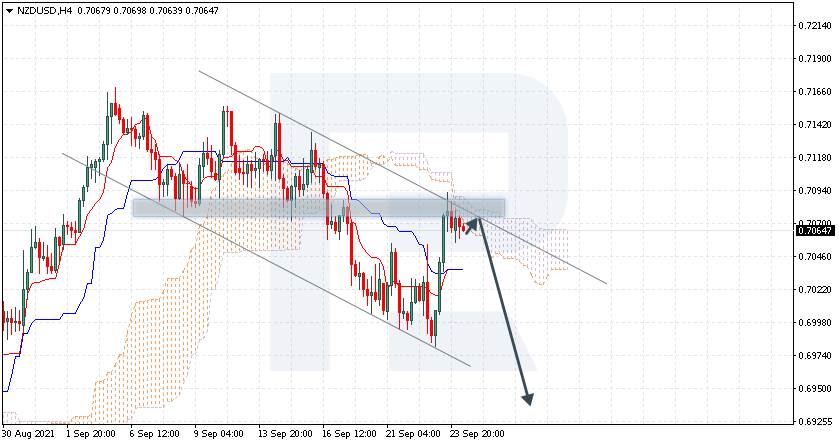
New Zealand Dollar Futures:

Eurodollar Bonds Futures COT Chart
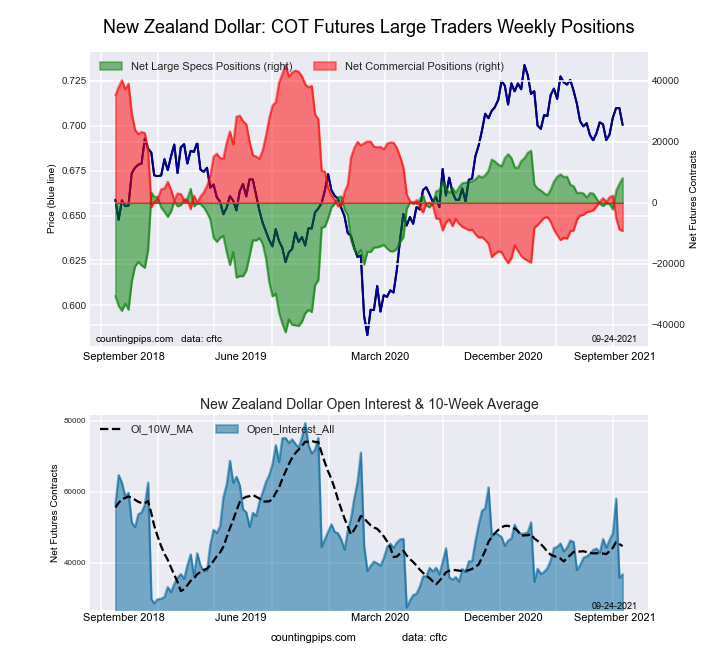
The New Zealand Dollar large speculator standing this week recorded a net position of 6,206 contracts in the data reported through Tuesday. This was a weekly rise of 2,343 contracts from the previous week which had a total of 3,863 net contracts.

This week’s current strength score (the trader positioning range over the past three years, measured from 0 to 100) shows the speculators are currently Bullish-Extreme with a score of 81.7 percent. The commercials are Bearish-Extreme with a score of 16.9 percent and the small traders (not shown in chart) are Bullish-Extreme with a score of 81.6 percent.

NEW ZEALAND DOLLAR StatisticsSPECULATORSCOMMERCIALSSMALL TRADERS
– Percent of Open Interest Longs:49.231.416.5
– Percent of Open Interest Shorts:31.855.99.3
– Net Position:6,206-8,7552,549
– Gross Longs:17,55411,1965,873
– Gross Shorts:11,34819,9513,324
– Long to Short Ratio:1.5 to 10.6 to 11.8 to 1
NET POSITION TREND:
– COT Index Score (3 Year Range Pct):81.716.981.6
– COT Index Reading (3 Year Range):Bullish-ExtremeBearish-ExtremeBullish-Extreme
NET POSITION MOVEMENT INDEX:
– 6-Week Change in Strength Index:11.0-14.028.3


Mexican Peso Futures:

Ultra 10-Year Treasury Notes Bonds Futures COT Chart
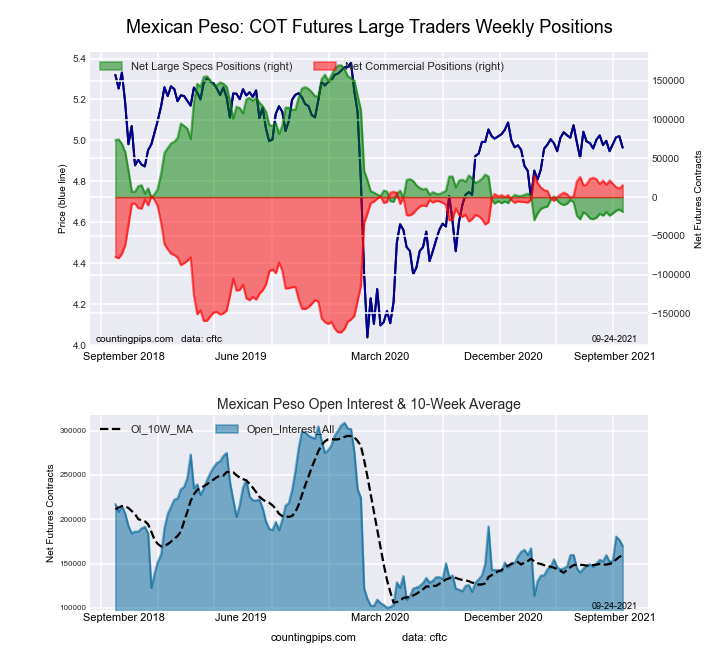
The Mexican Peso large speculator standing this week recorded a net position of -15,852 contracts in the data reported through Tuesday. This was a weekly boost of 1,665 contracts from the previous week which had a total of -17,517 net contracts.

This week’s current strength score (the trader positioning range over the past three years, measured from 0 to 100) shows the speculators are currently Bearish-Extreme with a score of 6.8 percent. The commercials are Bullish-Extreme with a score of 91.6 percent and the small traders (not shown in chart) are Bullish with a score of 63.3 percent.

MEXICAN PESO StatisticsSPECULATORSCOMMERCIALSSMALL TRADERS
– Percent of Open Interest Longs:54.341.14.1
– Percent of Open Interest Shorts:63.234.81.4
– Net Position:-15,85211,0734,779
– Gross Longs:95,94872,5697,213
– Gross Shorts:111,80061,4962,434
– Long to Short Ratio:0.9 to 11.2 to 13.0 to 1
NET POSITION TREND:
– COT Index Score (3 Year Range Pct):6.891.663.3
– COT Index Reading (3 Year Range):Bearish-ExtremeBullish-ExtremeBullish
NET POSITION MOVEMENT INDEX:
– 6-Week Change in Strength Index:2.7-2.91.9


Brazilian Real Futures:

US Year Treasury Notes Long Bonds Futures COT Chart
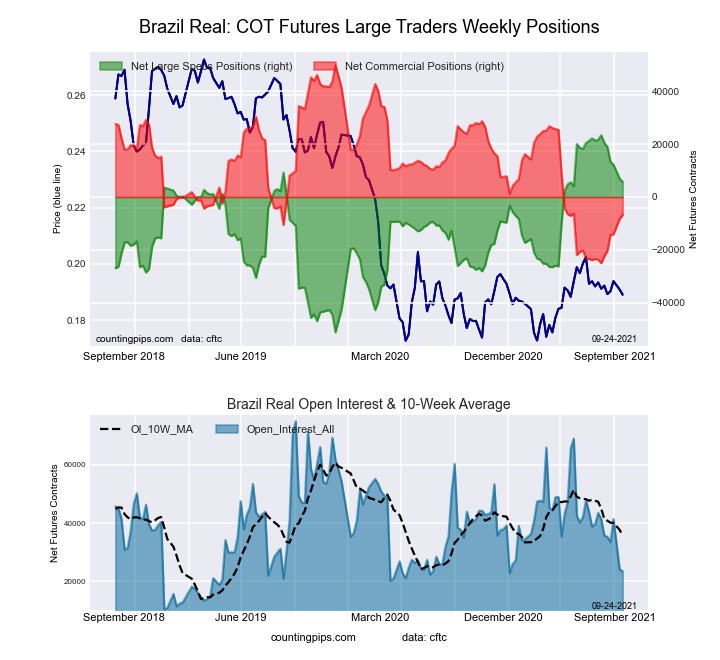
The Brazilian Real large speculator standing this week recorded a net position of 6,994 contracts in the data reported through Tuesday. This was a weekly advance of 660 contracts from the previous week which had a total of 12,258 net contracts.

This week’s current strength score (the trader positioning range over the past three years, measured from 0 to 100) shows the speculators are currently Bullish with a score of 78.0 percent. The commercials are Bearish with a score of 22.3 percent and the small traders (not shown in chart) are Bullish-Extreme with a score of 83.2 percent.

BRAZIL REAL StatisticsSPECULATORSCOMMERCIALSSMALL TRADERS
– Percent of Open Interest Longs:57.829.212.9
– Percent of Open Interest Shorts:28.963.77.4
– Net Position:6,994-8,3461,352
– Gross Longs:13,9837,0553,130
– Gross Shorts:6,98915,4011,778
– Long to Short Ratio:2.0 to 10.5 to 11.8 to 1
NET POSITION TREND:
– COT Index Score (3 Year Range Pct):78.022.383.2
– COT Index Reading (3 Year Range):BullishBearishBullish-Extreme
NET POSITION MOVEMENT INDEX:
– 6-Week Change in Strength Index:-22.022.3-3.3


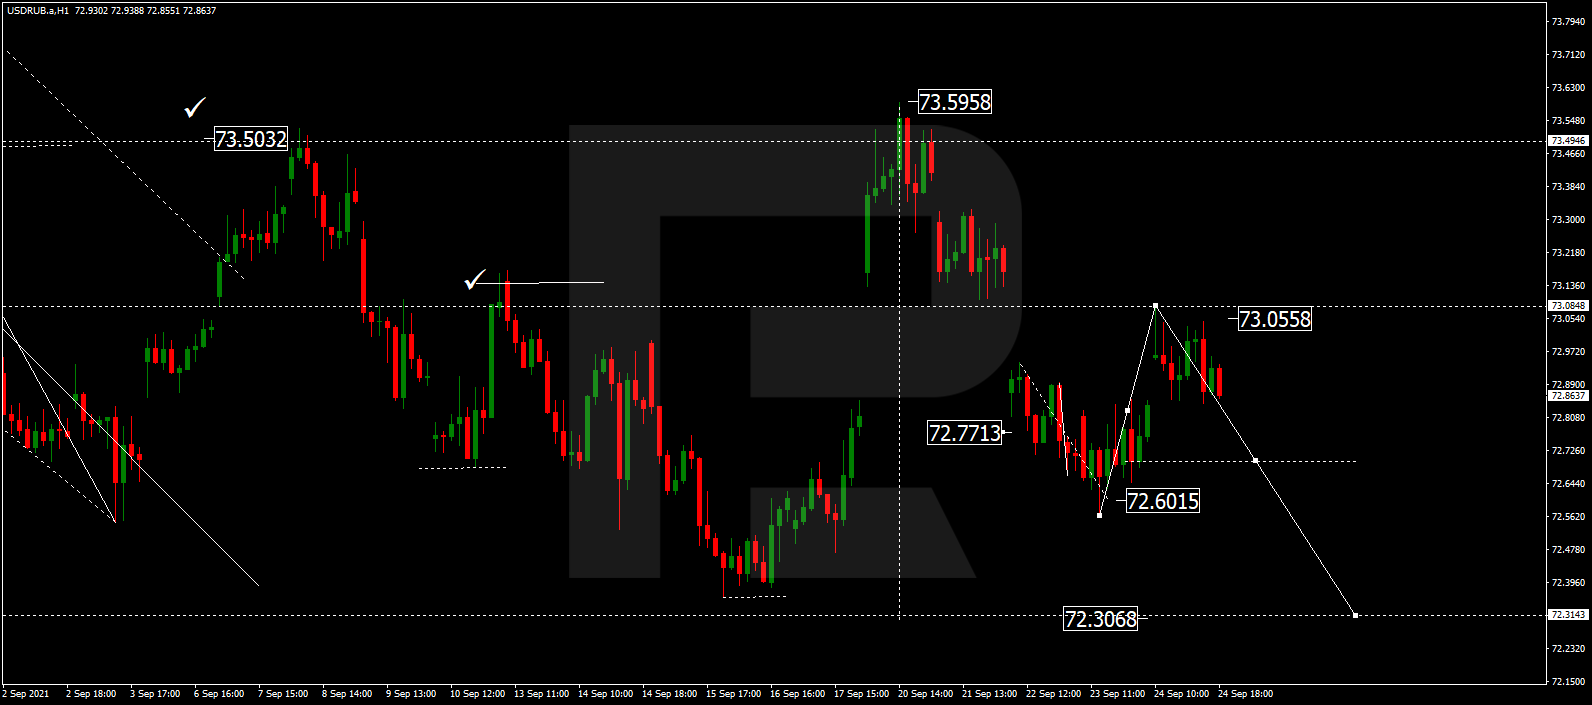
Russian Ruble Futures:

Ultra US Year Treasury Notes Long Bonds Futures COT Chart
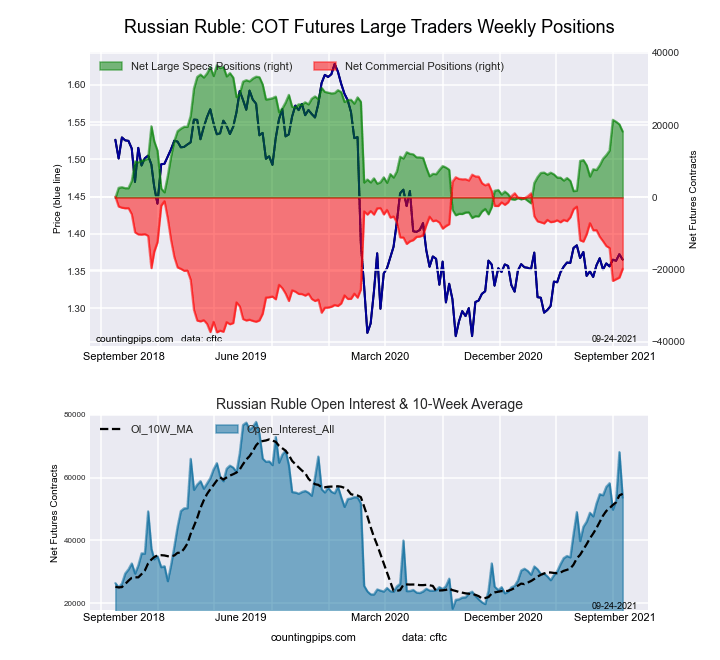
The Russian Ruble large speculator standing this week recorded a net position of 20,223 contracts in the data reported through Tuesday. This was a weekly decline of -722 contracts from the previous week which had a total of 20,945 net contracts.

This week’s current strength score (the trader positioning range over the past three years, measured from 0 to 100) shows the speculators are currently Bullish with a score of 61.3 percent. The commercials are Bearish with a score of 34.8 percent and the small traders (not shown in chart) are Bullish-Extreme with a score of 98.6 percent.

RUSSIAN RUBLE StatisticsSPECULATORSCOMMERCIALSSMALL TRADERS
– Percent of Open Interest Longs:41.748.24.0
– Percent of Open Interest Shorts:12.080.71.2
– Net Position:20,223-22,1491,926
– Gross Longs:28,37632,8362,737
– Gross Shorts:8,15354,985811
– Long to Short Ratio:3.5 to 10.6 to 13.4 to 1
NET POSITION TREND:
– COT Index Score (3 Year Range Pct):61.334.898.6
– COT Index Reading (3 Year Range):BullishBearishBullish-Extreme
NET POSITION MOVEMENT INDEX:
– 6-Week Change in Strength Index:26.7-25.8-1.4


Bitcoin Futures:

Eurodollar Bonds Futures COT Chart
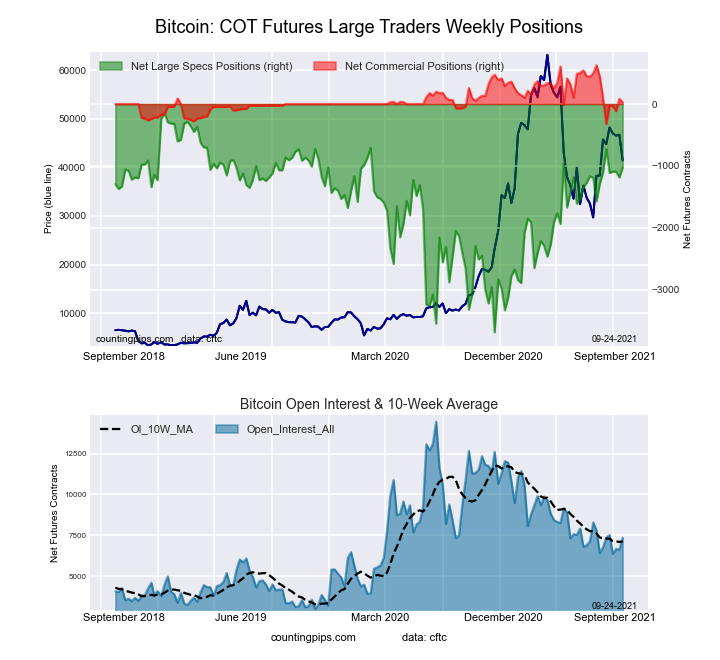
The Bitcoin large speculator standing this week recorded a net position of -1,187 contracts in the data reported through Tuesday. This was a weekly reduction of -93 contracts from the previous week which had a total of -1,094 net contracts.

This week’s current strength score (the trader positioning range over the past three years, measured from 0 to 100) shows the speculators are currently Bullish with a score of 70.5 percent. The commercials are Bearish with a score of 42.9 percent and the small traders (not shown in chart) are Bearish with a score of 25.9 percent.

BITCOIN StatisticsSPECULATORSCOMMERCIALSSMALL TRADERS
– Percent of Open Interest Longs:58.45.827.4
– Percent of Open Interest Shorts:76.34.510.7
– Net Position:-1,187861,101
– Gross Longs:3,8663851,811
– Gross Shorts:5,053299710
– Long to Short Ratio:0.8 to 11.3 to 12.6 to 1
NET POSITION TREND:
– COT Index Score (3 Year Range Pct):70.542.925.9
– COT Index Reading (3 Year Range):BullishBearishBearish
NET POSITION MOVEMENT INDEX:
– 6-Week Change in Strength Index:2.9-37.98.5


Article By CountingPips.comReceive our weekly COT Reports by Email

*COT Report: The COT data, released weekly to the public each Friday, is updated through the most recent Tuesday (data is 3 days old) and shows a quick view of how large speculators or non-commercials (for-profit traders) were positioned in the futures markets.

The CFTC categorizes trader positions according to commercial hedgers (traders who use futures contracts for hedging as part of the business), non-commercials (large traders who speculate to realize trading profits) and nonreportable traders (usually small traders/speculators).

Find CFTC criteria here: (http://www.cftc.gov/MarketReports/CommitmentsofTraders/ExplanatoryNotes/index.htm).

DXY Has Cycle Correction IV Ended?

By Orbex

In the long term, DXY seems to be forming a bearish impulse that consists of five cycle sub-waves.

The chart shows the final part of the deep correction wave IV, which, apparently, has come to an end. It took the form of a primary triple zigzag Ⓦ-Ⓧ-Ⓨ-Ⓧ-Ⓩ.

We are currently in the initial part of the cycle wave V, which could be a 5-wave ①-②-③-④-⑤ impulse.

In the near future, primary wave ③ will lead the market towards the 89.53 area, or even lower.

DXY

The alternative scenario suggests the continuation of the development of the cycle correction wave IV. Perhaps wave IV is a large double zigzag of the primary degree Ⓦ-Ⓧ-Ⓨ.

The primary wave Ⓨ, which is similar to the triple zigzag (W)-(X)-(Y)-(X)-(Z), is currently under development. The first four parts of this figure have ended, with the final sub-wave (Z) under construction.

We can assume that the intermediate wave (Z) will end near 95.53. At that level, wave Ⓨ will be at 161.8% of wave Ⓦ.


Orbex-LogoArticle by Orbex

Orbex is a fully licensed broker that was established in 2011. Founded with a mission to serve its traders responsibly and provides traders with access to the world’s largest and most liquid financial markets. www.orbex.com

Intraday Market Analysis – USD Finds Bullish Impetus

By Orbex

AUDUSD struggles for support

AUDUSD

The Australian dollar softens as lockdowns led to sharp job losses in August.

The pair has struggled to hold on to gains after 0.7400. Traders are testing supports as the initial surge fades.

A break below 0.7310 is a sign of weak buying interest. Then a breach below 0.7290 would lead to a test of 0.7245 which happens to be the 61.8% Fibonacci retracement level from the daily chart.

The resistance could cap a rebound at 0.7345 and rather be an opportunity to sell into strength.

USDJPY bounces off daily support

USDJPY

The US dollar surged after August’s upbeat retail sales took the market by surprise.

The greenback was bid up by a buying-the-dips crowd on the daily support (109.10) when the RSI showed an oversold situation. The indicator’s bullish divergence pointed to a loss in the sell-off momentum.

The break above the immediate resistance at 109.75 would prompt sellers to cover their positions. 110.15 is a key hurdle ahead and a bullish breakout may raise volatility and jump-start a new round of rally in the dollar.

GBPUSD falls through trendline

GBPUSD

The US dollar’s rally across the board puts the sterling on the defense.

The pair has been climbing along a rising trendline. Then it met stiff selling pressure in the daily supply zone near 1.3900. An initial fall below 1.3800 indicated a lack of conviction in the rebound after a repeatedly overbought RSI.

The invalidation of the trendline would turn sentiment upside down with buyers cashing in.

1.3730 is the next support as the firesale gains traction. On the upside, the bulls will need to lift 1.3840 before they could hope for a bounce.


Orbex-LogoArticle by Orbex

Orbex is a fully licensed broker that was established in 2011. Founded with a mission to serve its traders responsibly and provides traders with access to the world’s largest and most liquid financial markets. www.orbex.com

The Week Ahead – Can The Fed Contain US Dollar Rally?

By Orbex

USD

USDCHF surges on policy divergence

USDCHF

The Swiss franc weakens as markets expect growing policy divergence between the SNB and the Federal Reserve.

As the Swiss economy almost recovers to its pre-crisis level, keeping the franc from appreciating is a top priority for policymakers. SNB vice-chairman Fritz Zurbruegg has voiced the necessity to maintain the policy of negative interest rates.

While global markets have jittered over ‘transitory’, the Swiss central bank has a greater incentive to use and abuse that keyword longer than their US counterpart would.

A break above 0.9270 would propel the pair to April’s high at 0.9460. 0.9170 has become fresh support.

USDJPY bounces ahead of FOMC

USDJPY

The Japanese yen whipsawed as traders await major decisions from both central banks.

A drop in Japan’s covid cases and further progress in vaccinations may allow the BOJ to paint an optimistic picture. Other than that, the BOJ would deliver little surprise as inflationary pressures still lag behind the US and Europe.

On the other side of the Pacific, odds are better for a hawkish note from the FOMC. Rising prices continue to put the Fed officials on hot seats. An upbeat outlook could be enough to trigger the dollar bulls.

The pair may resume its rally once above 110.70 with 109.00 as the immediate support.

GBPUSD goes sideways as the BOE is indecisive

GBPUSD

The pound trades in a narrowing range as markets look for catalysts. The current consolidation looks like a staring contest between the Bank of England and the Federal Reserve.

The sterling still holds the high ground as traders expect the former to raise interest rates earlier. Inflation-wise, on top of supply bottlenecks major economies are facing, the UK has the unenviable task of having to deal with Brexit disruptions.

The pound would lift the psychological level of 1.4000 if an evenly split Monetary Policy Committee breaks the stalemate. Otherwise, the bulls will need to watch for a retest of the support at 1.3600.

SPX 500 steadies as sentiment resilient

US500

The S&P 500 keeps on rolling as investors remain confident ahead of the Fed meeting.

While August’s retail numbers came out as a nice surprise, a rise in new claims for unemployment counterbalanced inflation pressures. However, the market has chosen to give the data the benefit of the doubt.

Despite volatility in the currency market, stock markets’ relentless advance tells that a meaningful shift in monetary policy could be miles away. With so much at stake, a slight change in wind direction would trigger profit-takings.

The index is testing the rising trendline at 4440. A bounce would set 4600 as the next target.


Orbex-LogoArticle by Orbex

Orbex is a fully licensed broker that was established in 2011. Founded with a mission to serve its traders responsibly and provides traders with access to the world’s largest and most liquid financial markets. www.orbex.com

Fibonacci Retracements Analysis 17.09.2021 (AUDUSD, USDCAD)

Article By RoboForex.com

AUDUSD, “Australian Dollar vs US Dollar”

As we can see in the H4 chart, after growing and reaching 38.2% fibo, AUDUSD is forming a new descending wave that may seem to be heading to break the low at 0.7106 and then reach the mid-term 38.2% fibo at 0.7052. However, this wave should be considered as a correction relative to the previous ascending wave, which, in its turn, might be a part of the correctional phase of the previous downtrend. After the current pullback is over, the asset may resume growing towards 50.0% and 61.8% fibo at 0.7556 and 0.7662 respectively.

AUDUSD_H4
Risk Warning: the result of previous trading operations do not guarantee the same results in the future

The H1 chart of AUDUSD shows convergence on MACD after the price reached 50.0% fibo. Possibly, there may be one more descending impulse towards 61.8% fibo but the overall technical picture implies that the correction is over. Later, the asset may resume growing towards the high at 0.7478.

AUDUSD_H1
Risk Warning: the result of previous trading operations do not guarantee the same results in the future

USDCAD, “US Dollar vs Canadian Dollar”

As we can see in the H4 chart, after an attempt to fall and reach 50.0% fibo at 1.2478, the pair completed a quick rising impulse, which was later followed by a consolidation range in the form of the Triangle pattern. This range should be considered as a correction relative to the previous rising impulse. Such a technical picture implies that the asset is currently trying to decide where to move next, down or up. A new wave to the downside may lead to 50.0% and 61.8% fibo at 1.2478 and 1.2367 respectively. On the other hand, one more rising wave may break the high at 1.2949 and then reach the long-term 38.2% fibo at 1.3022.

USDCAD_H4
Risk Warning: the result of previous trading operations do not guarantee the same results in the future

The H1 chart shows a more detailed structure of the current consolidation. Since this channel is a part of a rising impulse, the price may break it upwards and reach 61.8% and 76.0% fibo at 1.2774 and 1.2840 respectively. The support is the low at 1.2493.

USDCAD_H1

Article By RoboForex.com

Attention!
Forecasts presented in this section only reflect the author’s private opinion and should not be considered as guidance for trading. RoboForex LP bears no responsibility for trading results based on trading recommendations described in these analytical reviews.

Investors awaiting inflation data in Europe

by JustForex

Despite a slight increase in initial jobless claims, strong US retail sales data strengthened the dollar index and gave even more reason to believe that the Federal Reserve will announce the start of QE program cuts at its meeting on September 22. The US stock market ended Thursday’s trading without a single dynamic. At the closing time of the stock exchange, the Dow Jones index decreased by 0.18%, the S&P 500 lost 0.15%, and the NASDAQ added 0.13%. The technological sector became the growth leader, while the negative dynamics were demonstrated by the oil, gas, and utility sectors.

European stock indices were up yesterday at the end of the day. British FTSE 100 and German DAX added 0.2% each, French CAC 40 increased by 0.6%, Spanish IBEX 35 and Italian FTSE MIB added 1.1% and 0.8% respectively. Yesterday, ECB head Christine Lagarde said that Europe is recovering faster than originally expected. But analysts are looking at the situation from a slightly different angle. Europe is already facing its worst natural gas crisis in decades, with prices climbing to record levels before winter. Goldman Sachs warned that skyrocketing commodity prices will put heavy industry across Europe at risk of power outages this winter, especially if frosts in Europe are delayed. Europe will report on inflation today. A surge in inflation may provoke the ECB to start cutting stimulus as soon as the next meeting.

Global GDP may grow by +5.3% in 2021 due to “radical” policy measures and successful vaccine introductions in advanced economies. But next year’s growth is likely to slow to +3.6%.

Precious metals prices have decreased. Gold fell by nearly 3% on Thursday, and silver lost 5% on the back of a stronger dollar index and US Treasury yields. Unless any geopolitical event occurs, the trajectory of gold and silver is unlikely to change before the FOMC meeting.

Oil is slightly down as US supplies affected by the hurricane are slowly getting back. On the other hand, oil is in a bullish trend and the upward trend in fuel prices is likely to continue because supply is seriously lagging far behind demand.

Asian tech stocks increased for the first time this week. Chinese stocks were mixed on the back of the China Evergrande Group debt crisis and the central bank’s short-term cash infusion. Hong Kong’s Hang Seng index increased by 0.23% after recording its lowest close in 10 months the day before. Australia’s ASX 200 index decreased by 0.8% as falling iron ore prices hurt mining companies. Chinese blue chips (CSI 300) increased by 0.58%, and Japan’s Nikkei 225 index increased by 0.62%, returning to a 31-year high reached on Monday.

Main market quotes:

S&P 500 (F) 4,473.75 −6.95 (−0.16%)

Dow Jones 34,751.32 −63.07 (−0.18%)

DAX 15,651.75 +35.75 (+0.23%)

FTSE 100 7,027.48 +10.99 (+0.16%)

USD Index 92.84 +0.30 (+0.32%)

Important events for today:
  • – UK Retail Sales (m/m) at 09:00 (GMT+3);
  • – Eurozone Consumer Price Index (m/m) at 12:00 (GMT+3);
  • – US Michigan Consumer Sentiment (m/m) at 17:00 (GMT+3).

by JustForex


This article reflects a personal opinion and should not be interpreted as an investment advice, and/or offer, and/or a persistent request for carrying out financial transactions, and/or a guarantee, and/or a forecast of future events.

Ichimoku Cloud Analysis 17.09.2021 (EURUSD, USDCAD, GBPUSD)

Article By RoboForex.com

EURUSD, “Euro vs US Dollar”

EURUSD is trading at 1.1771; the instrument is moving below Ichimoku Cloud, thus indicating a descending tendency. The markets could indicate that the price may test the cloud’s downside border at 1.1795 and then resume moving downwards to reach 1.1655. Another signal in favor of a further downtrend will be a rebound from the rising channel’s downside border. However, the bearish scenario may no longer be valid if the price breaks the cloud’s upside border and fixes above 1.1855. In this case, the pair may continue growing towards 1.1945.

EURUSD
Risk Warning: the result of previous trading operations do not guarantee the same results in the future

USDCAD, “US Dollar vs Canadian Dollar”

USDCAD is trading at 1.2663; the instrument is moving above Ichimoku Cloud, thus indicating an ascending tendency. The markets could indicate that the price may test the cloud’s upside border at 1.2645 and then resume moving upwards to reach 1.2865. Another signal in favor of a further uptrend will be a rebound from the downside border of the Triangle pattern. However, the bullish scenario may no longer be valid if the price breaks the cloud’s downside border and fixes below 1.2570. In this case, the pair may continue falling towards 1.2480. To confirm further growth, the asset must break the resistance level and fix above 1.2725, thus breaking the pattern’s upside border.

USDCAD
Risk Warning: the result of previous trading operations do not guarantee the same results in the future

GBPUSD, “Great Britain Pound vs US Dollar”

GBPUSD is trading at 1.3794; the instrument is moving below Ichimoku Cloud, thus indicating a descending tendency. The markets could indicate that the price may test the cloud’s upside border at 1.3825 and then resume moving downwards to reach 1.3655. Another signal in favor of a further downtrend will be a rebound from the resistance level. However, the bearish scenario may no longer be valid if the price breaks the cloud’s upside border and fixes above 1.3870. In this case, the pair may continue growing towards 1.3965. To confirm further decline, the asset must break the rising channel’s downside border and fix below 1.3740.

GBPUSD

Article By RoboForex.com

Attention!
Forecasts presented in this section only reflect the author’s private opinion and should not be considered as guidance for trading. RoboForex LP bears no responsibility for trading results based on trading recommendations described in these analytical reviews.